4549
3-Dimensional Strain Mapping of the Eyeball during Adduction, Abduction Tasks1Biomedical Engineering, Stony Brook University, Stony Brook, NY, United States, 2Ophthalmology, Stony Brook University, Stony Brook, NY, United States, 3Radiology, Stony Brook University, Stony Brook, NY, United States
Synopsis
This study employed high-resolution 3D-MRI to map the strain of the eyeball during adduction and abduction tasks. The strain map is highly heterogeneous with high strain toward the anterior region. Adduction induced higher strain than abduction, as expected due to more stretching of the optic nerve in the adduction position. This is the first MRI measurement of strain of the eyeball. This approach could have clinical applications in eye movement disorders and eye diseases.
Introduction
Recent studies quantifying the strain in the optic nerve head during abduction and adduction have raised questions over the role of eye movement in the development of optic nerve and retina disorders, such as glaucoma and papilledema [1, 2]. In this study, we employed high spatial and high temporal resolution 3D MRI to map the strain of the eyeball during adduction and abduction tasks. While past studies have examined strain on the optic nerve head with optical coherence tomography (which is limited to a few mm field of view), this is the first MRI study to map the strain of the whole eye in 3 dimensions.Methods
MRI was acquired at 3T on 8 healthy volunteers with no history of eye disease. Three fixation points were placed inside of the magnet bore; one on the center line and one each ~20o to the left and right to induce abduction and adduction of the eye respectively. A single 4cm loop coil was positioned over the left eye. High-resolution (0.8mm3 isotropic) 3D balanced steady state free procession (bSSFP) images were acquired with the subjects fixating on each point in turn, with an acquisition time of ~40 seconds.
Two bSSFP images with a frequency offset of 100Hz were acquired at each gaze and combined with a maximum intensity projection to remove banding artifacts. Structures outside of the eye were masked by thresholding, and the masked abduction and adduction images were registered to the neutral gaze image, first with an affine transform and then a nonlinear b-splines registration [3]. The resulting displacement fields from the nonlinear registration were used to calculate the strain tensor at each point in the eye due to abduction and adduction with respect to the neutral position. The effective strain was calculated and projected onto the center gaze image. The average effective strain in an ROI near the optic nerve head was compared between gaze positions with a paired two-tailed t-test. The ROI was split into medial and lateral halves for comparison of strain differences on either side of the eye during abduction and adduction.
Results
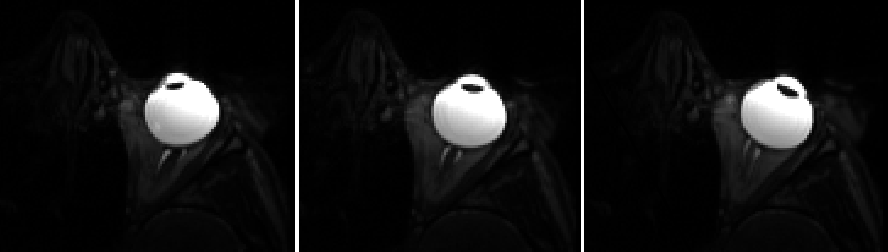
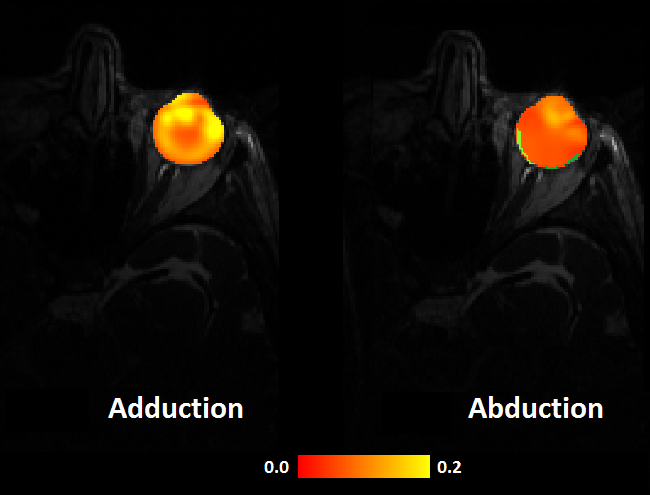
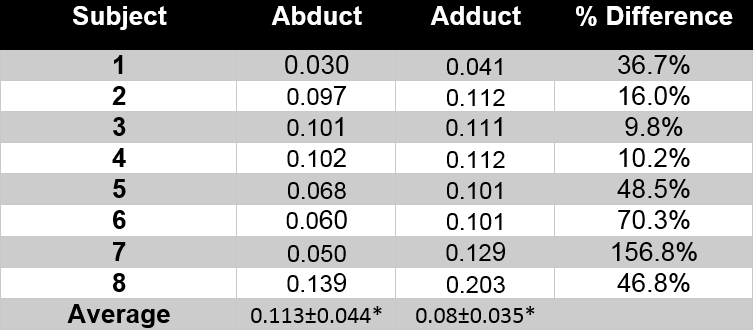
Images during adduction, abduction, and neutral positions are shown in Figure 1. Strain maps from each gaze position, mapped onto the neutral gaze image, are shown in Figure 2. The strain map is heterogeneous with higher strain in the anterior portion of the eye. Mean effective strain in the ROI at the posterior globe was significantly different between abduction and adduction (p=0.01), with adduction showing higher strain (Table 1). The effective strain in the medial and lateral ROIs was also significantly different between gaze directions (p=0.005 and p=.023 respectively, see Table 2). The strain in the medial ROI was significantly higher than the strain in the lateral ROI for the adduction position (p<0.001). In the abduction position, strain on the medial side trended lower than the lateral side trending toward statistical significance (p=0.055).Discussion
The amount of strain between abduction and adduction was highly variable between subjects, but within subjects there was a consistent increase within the ROI from abduction to adduction. The higher inter-subject variability could due to subject compliance to the task, effects of fixation stability, and/or reliability of the method. These issues could be addressed in future studies with eye tracking.
We found higher strain in adduction compared to abduction. This is expected due to the stretching of the optic nerve in the adduction position. The difference in strain on the medial and lateral surfaces show the ability of this technique to detect localized strain differences throughout the globe of the eye.
The strain map is heterogeneous with higher strain in the anterior portion of the eye (Figure 2). It is unclear if this is due to optic nerve stretching or another mechanical source; more detailed analysis using the entire strain tensor as opposed to effective strain may provide further information about the forces acting on the eye during horizontal movement.
Conclusion
This is the first MRI measurement of strain of the eyeball due to horizontal abduction and adduction. The bSSFP acquisition yielded high combined spatiotemporal resolution which enabled such measurement. We found heterogenous strain distribution in the eyeball during adduction and abduction. Adduction induced higher strain than abduction. This approach could have clinical applications in eye movement disorders (such as strabismus and nystagmus) and eye diseases (such as glaucoma and papilledema).Acknowledgements
No acknowledgement found.References
1. Wang, X., et al., In Vivo 3-Dimensional Strain Mapping Confirms Large Optic Nerve Head Deformations Following Horizontal Eye Movements. Investigative Ophthalmology & Visual Science, 2016. 57(13): p. 5825-5833.
2. Sibony, P.A., Gaze Evoked Deformations of the Peripapillary Retina in Papilledema and Ischemic Optic Neuropathy. Investigative Ophthalmology & Visual Science, 2016. 57(11): p. 4979-4987.
3. Kroon, D.-J., B-spline Grid, Image and Point based Registration. 2011: MathWorks.
Figures