4537
Practical Considerations for Mapping R1 in the Cerebral Cortex Across Sites1Psychology, Neuroscience & Behaviour, McMaster University, Hamilton, ON, Canada, 2Psychiatry & Behavioural Neuroscience, McMaster University, Hamilton, ON, Canada
Synopsis
We map R1 in the cortex across two sites, using IR-GRE and GRE images to calculate R1 values based on the ratio of the images (IR-GRE/GRE)) using signal equations. We collect B1+ maps to analytically correct R1 inhomogeneities that might cause site-dependent variation. We tested our R1 mapping method with two different input ratio images: one formed using an IR-GRE sequence with typical neuroanatomical contrast, and one using an IR-GRE sequence optimized to produce strong intracortical contrast. We found the ratio image with the higher intracortical contrast produced more consistent R1 maps across sites, which were less sensitive to B1+.
Introduction
Differences in R1 across the cortex are smaller than differences across the entire brain, so care must be taken to reduce measurement errors, such as the B1+ (transmit) field inhomogeneity that can overwhelm the endogenous cortical contrast [1]. This is especially true in multi-site studies, where differences in B1+ between scanners can produce site-specific effects.
In this study, we imaged 40 healthy control subjects split evenly between two imaging sites. Both sites had 3T General Electric MRI scanners. We collected two inversion-recovery gradient echo images (IR-GRE), a gradient echo (GRE) image, and a B1+ map. We estimate R1 (1/T1) by simulating values of the ratio image (IR-GRE/GRE) for a given value of T1 using signal equations that incorporate B1+. We can then reverse-lookup values of T1 at values of the ratio image and B1+ map (see [2-3] for signal equations and [4] for method). To test the effect of the IR-GRE image on R1 estimation, we collected two versions: one with typical neuroanatomical contrast, and one with optimized contrast in the cortex that took longer to acquire.
Methods
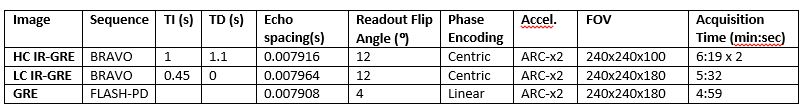
Imaging: We collected low intracortical contrast (LC) and high contrast (HC) IR-GRE images, and a GRE image all at 1mm isotropic resolution (see parameters in Figure 1), and B1+ maps at 5mm isotropic resolution at the two imaging sites. We used General Electric’s built in B1+ mapping sequence which is based on the Bloch-Siegert shift method. Both sites used a 3T General Electric Signa MR750w Discovery with a receive 32 channel head coil, and both had the same software (Software: 25\LX\MR Software release:DV25.0_R02_1549.b). The difference between the HC and LC images is that the HC IR-GRE sequence uses a longer inversion time (TI) and delay time between the end of the acquisition block and next inversion pulse (TD), which produces stronger intracortical contrast[5]. The HC image is also made from two separate scans – the right and left half of the brain are imaged separately and later combined[6].
Mapping data to surfaces: We closely follow the HCP minimal processing pipeline for generating myelin maps[7]. Briefly, we run Freesurfer version 6.0 (https://surfer.nmr.mgh.harvard.edu) on the LC IR-GRE image which generates white and pial surfaces. Using the outputs of Freesurfer, we computed a middle depth surface and sampled the signal of all images onto this surface. Final surfaces are read using the gifti toolbox for MATLAB (https://www.artefact.tk/software/matlab/gifti/) and displayed using the SurfStat toolbox for MATLAB (http://www.math.mcgill.ca/keith/surfstat/).
R1 Calculations: The surface images were loaded into MATLAB and used as inputs to a routine that calculates R1 in each vertex based on a lookup table generated from solutions to signal equations R1 maps were calculated without and with corrections for B1+ induced variations in the small tip angles in the readouts of the IR-GE and GE sequences.
Results
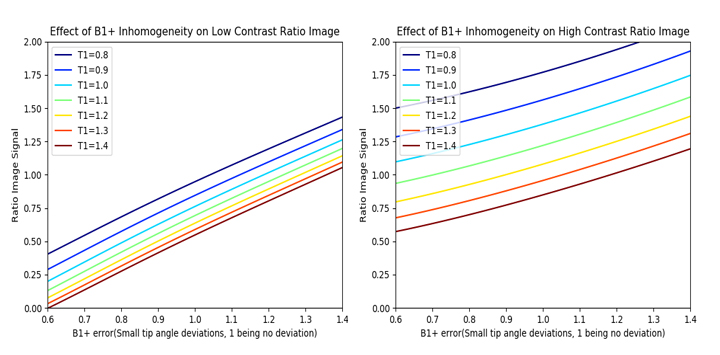
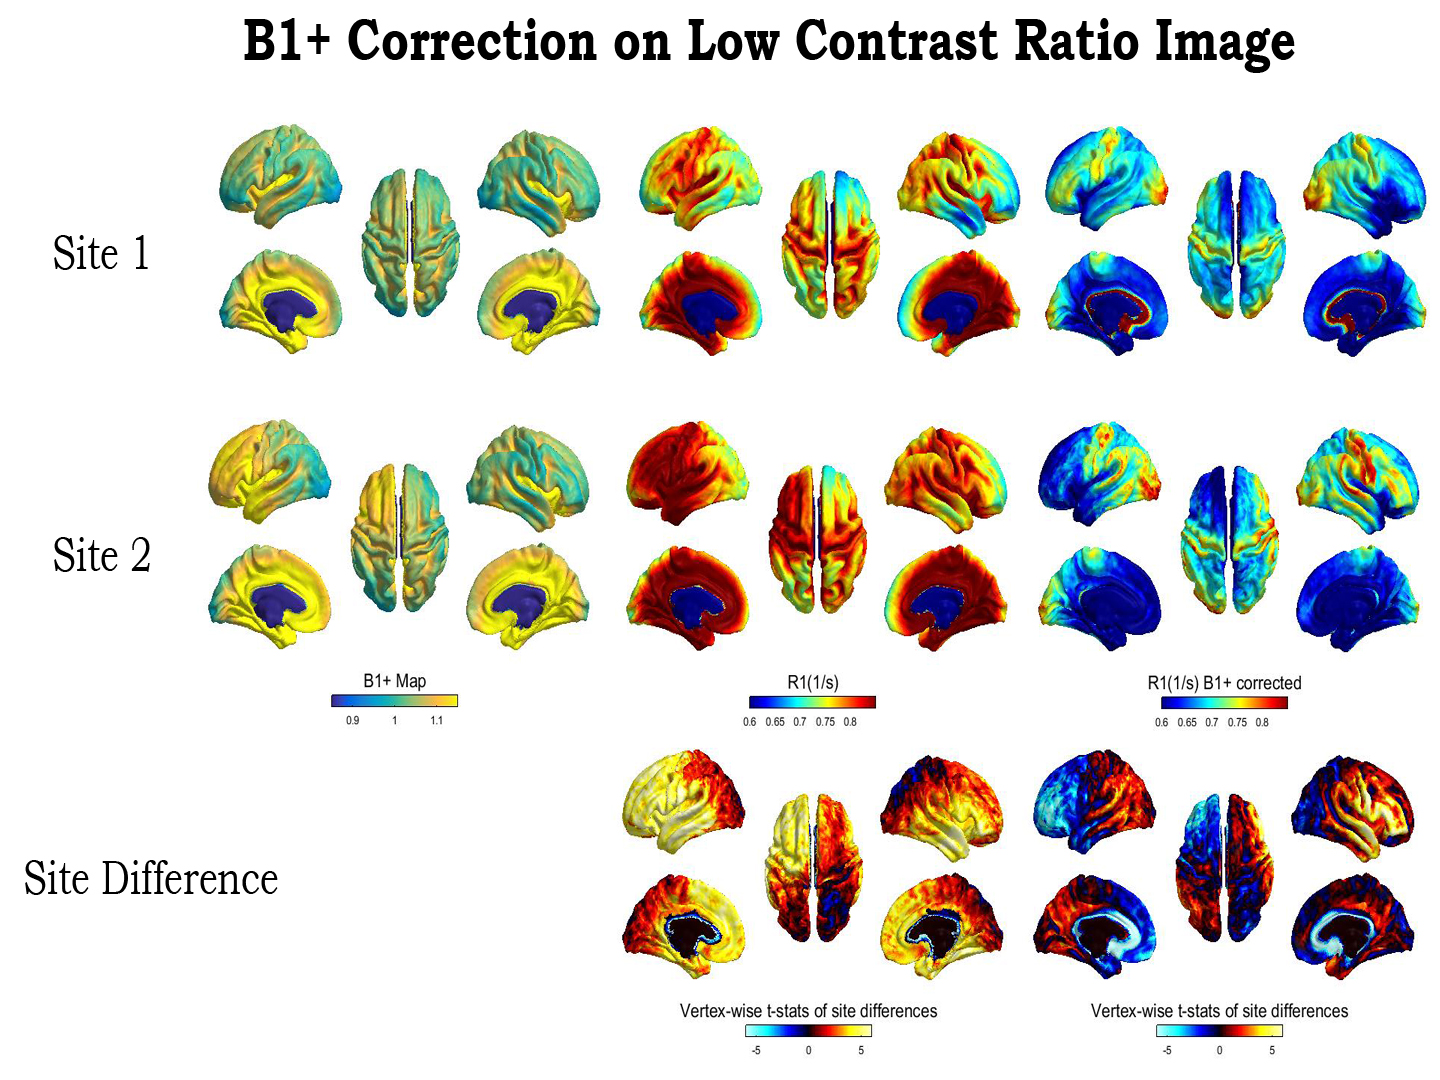
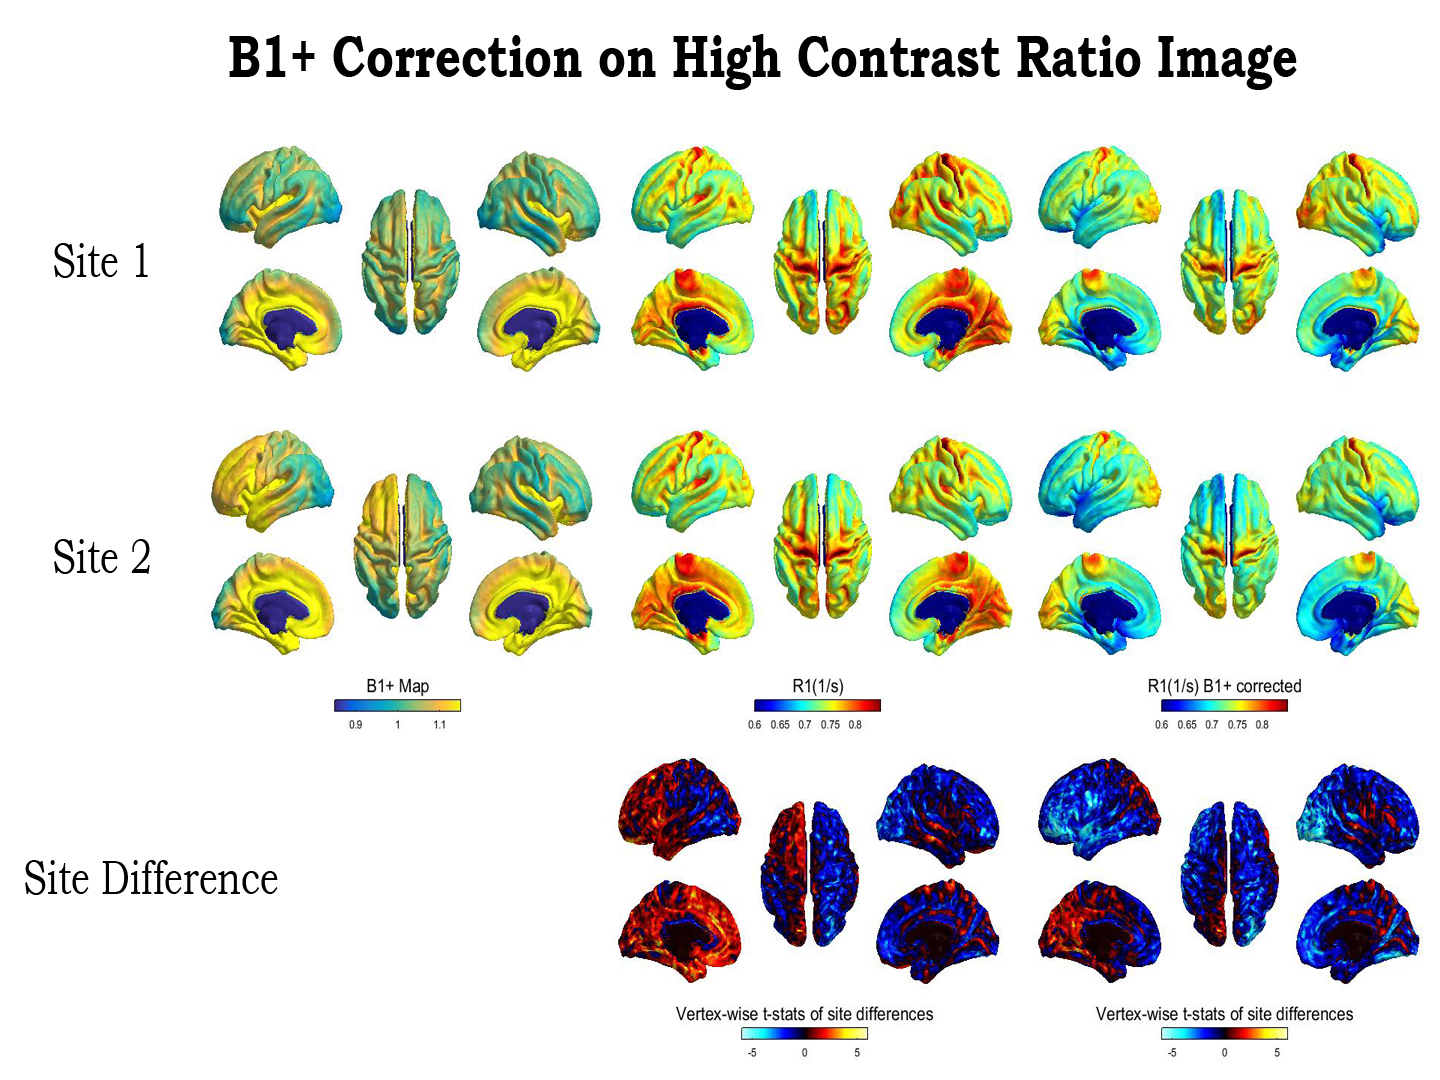
Based on simulations, R1 values calculated with the LC IR-GRE images are more strongly affected by variations in B1+ (Figure 2). This is evident in the R1 maps, as uncorrected maps made with the LC IR-GRE images show a strong site-wide dependence on the B1+ map (Figure 3), while the effect is smaller in the R1 maps made with the HC IR-GRE image. (Figure 4). The B1+ corrected maps show more accurate depictions of myelin distributions in both cases, these being most apparent in the medial wall. The B1+ correction reduced the site differences of the R1 maps made with the LC IR-GRE image, but did not seem to affect site differences of R1 maps made with HC IR-GRE image.Discussion
Based on our findings, increasing the intracortical contrast in the IR-GRE image used in our R1 calculations made the resulting maps less susceptible to variations arising from B1+ inhomogeneity. However, our B1+ correction only applied to the small tip angles in the readouts in our IR-GRE and GRE sequences and in both cases the R1 maps following this correction still showed variation that was visually correlated with the B1+ map. We suspect that residual asymmetries in the maps from both sites are caused by the fact that we didn’t correct for the effect of B1+ inhomogeneity on the inversion pulse in our sequences [8].Conclusion
We show that maximizing intracortical contrast in the IR-GRE image reduces site-dependent effects on R1 mapping in the cerebral cortex. These effects can be reduced by correcting for B1+ variations in the small tip angles used in the readouts of the ratio image; however, a full correction that takes into account B1+ variations in the transmit efficiency would likely reduce the site-effect further.Acknowledgements
No acknowledgement found.References
1. Lutti, A., Dick, F., Sereno, M. I., & Weiskopf, N. (2014). Using high-resolution quantitative mapping of R1 as an index of cortical myelination. Neuroimage, 93, 176-188.
2. Deichmann, R., Good, C. D., Josephs, O., Ashburner, J., & Turner, R. (2000). Optimization of 3-D MP-RAGE sequences for structural brain imaging. Neuroimage, 12(1), 112-127.
3. Wang, J., He, L., Zheng, H., & Lu, Z. L. (2014). Optimizing the magnetization-prepared rapid gradient-echo (MP-RAGE) sequence. PLoS One, 9(5), e96899.
4. Marques, J. P., Kober, T., Krueger, G., van der Zwaag, W., Van de Moortele, P. F., & Gruetter, R. (2010). MP2RAGE, a self bias-field corrected sequence for improved segmentation and T1-mapping at high field. Neuroimage, 49(2), 1271-1281.
5. Bock, N. A., Hashim, E., Janik, R., Konyer, N. B., Weiss, M., Stanisz, G. J., Turner, R., & Geyer, S. (2013). Optimizing T1-weighted imaging of cortical myelin content at 3.0 T. Neuroimage, 65, 1-12.
6. Rowley, C. D., Bazin, P. L., Tardif, C. L., Sehmbi, M., Hashim, E., Zaharieva, N., Minuzzi, L., Frey, B. N., & Bock, N. A. (2015). Assessing intracortical myelin in the living human brain using myelinated cortical thickness. Frontiers in neuroscience, 9, 396.
7. Glasser, M. F., Sotiropoulos, S. N., Wilson, J. A., Coalson, T. S., Fischl, B., Andersson, J. L., et al. (2013). The minimal preprocessing pipelines for the Human Connectome Project. Neuroimage, 80, 105-124.
8. Hagberg, G. E., Bause, J., Ethofer, T., Ehses, P., Dresler, T., Herbert, C., ... & Scheffler, K. (2017). Whole brain MP2RAGE-based mapping of the longitudinal relaxation time at 9.4 T. Neuroimage, 144, 203-216.
Figures