4536
Optimised T2 Preparation for Brain Imaging: Application to Compressed Sensing 3D T2 Mapping1Advanced Clinical Imaging Technology, Siemens Healthcare AG, Lausanne, Switzerland, 2Department of Radiology, University Hospital (CHUV), Lausanne, Switzerland, 3LTS5, École Polytechnique Fédérale de Lausanne (EPFL), Lausanne, Switzerland, 4Magnetic Resonance, Siemens Healthcare GmbH, Erlangen, Germany, 5Center for BioMedical Imaging (CIBM), Lausanne and Geneva, Switzerland
Synopsis
T2-mapping is becoming an important tool to detect pathological tissue; however, achieving high isotropic resolution is challenging. This work optimises a T2-prepared 3D compressed-sensing acquisition. Two T2-preparation modules (modified-BIR4, hyperbolic secant) and three Cartesian sampling trajectories (spiral, radial, VC-spiral) are explored. The NIST-ISMRM phantom and three in vivo subjects were scanned to test T2 accuracy and homogeneity. Results show more homogeneous and accurate T2 values with BIR4, due to a decreased sensitivity to B1. In vivo data showed more homogeneous T2 in WM using a radial trajectory. Based on these results, we propose an optimised 3D T2-mapping protocol of 9:48min.
Introduction
T2-mapping is a quantitative measure for various clinical applications in neurology (e.g. oedema, inflammation)1. Due to long acquisition times and specific absorption rate limitations, most T2-mapping strategies are limited to 2D acquisitions, yielding low through-plane resolution. T2-prepared acquisitions were already suggested as a 3D alternative, especially for cardiac applications2. To reduce acquisition time, it was proposed3 to accelerate T2-prepared scans with compressed sensing (CS)4, requiring an incoherent centre-out k-space trajectory. Optimised strategies should minimise known challenges for T2-prepared imaging (i.e. sensitivity to B0 and B1), while using a trajectory which maintains T2-weighting as much as possible. This work aims at determining the best combination of T2-preparation characteristics and trajectory with the objective to derive an optimised brain T2-mapping protocol.Methods
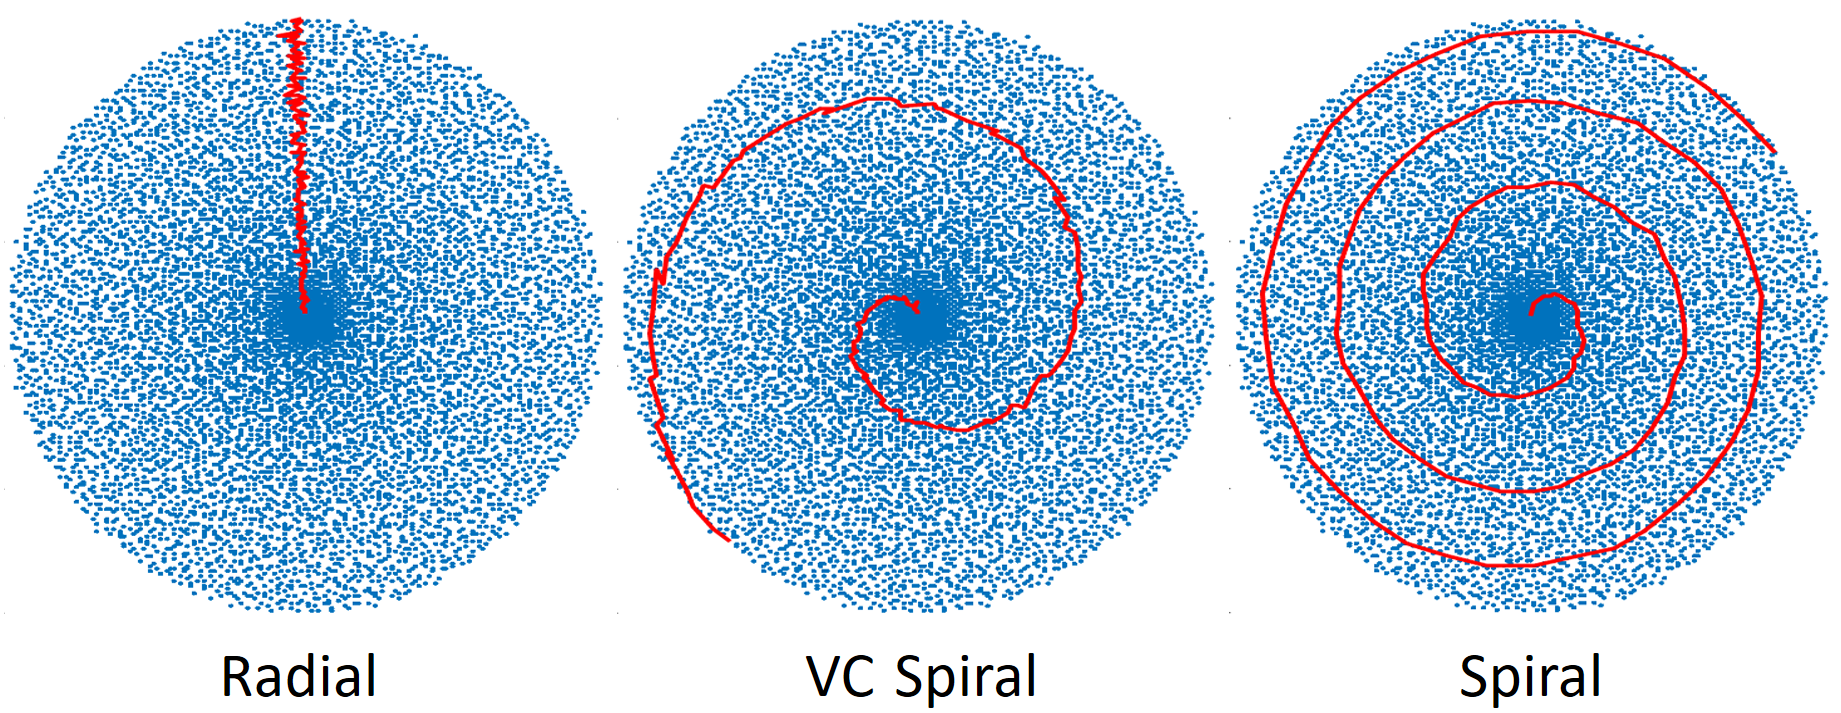
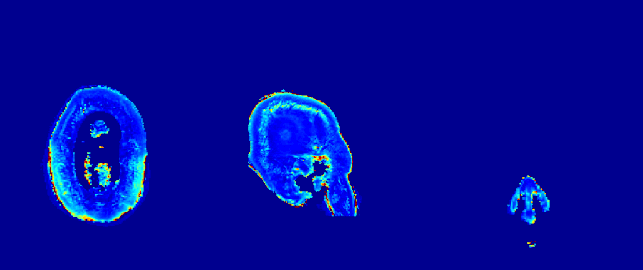
A T2-preparation module was added to a prototype MP-RAGE sequence performing incoherent undersampling3. Two different T2-preparation modules were explored: a modified BIR4 pulse5 and a module using sinc tip-down/up with two adiabatic hyperbolic secant (HS) refocusing pulses6. A variable-density Cartesian spiral phyllotaxis pattern7 was used to calculate the undersampling scheme; using these points on a Cartesian grid, three trajectories were implemented as shown in Figure 1 (all Cartesian): spiral centre-out, radial jittered centre-out, and variable-curvature (VC) spiral. The undersampled acquisitions with different T2-preparation times were individually reconstructed using CS4. Subsequently, T2 and M0 maps were computed by fitting a mono-exponential decay with an additional parameter δ8, accounting for T1 effects (e.g. T1 recovery). As these effects depend on the pulse, δ was optimised for each T2-preparation with respect to T1 effects on reference phantom T2 values.
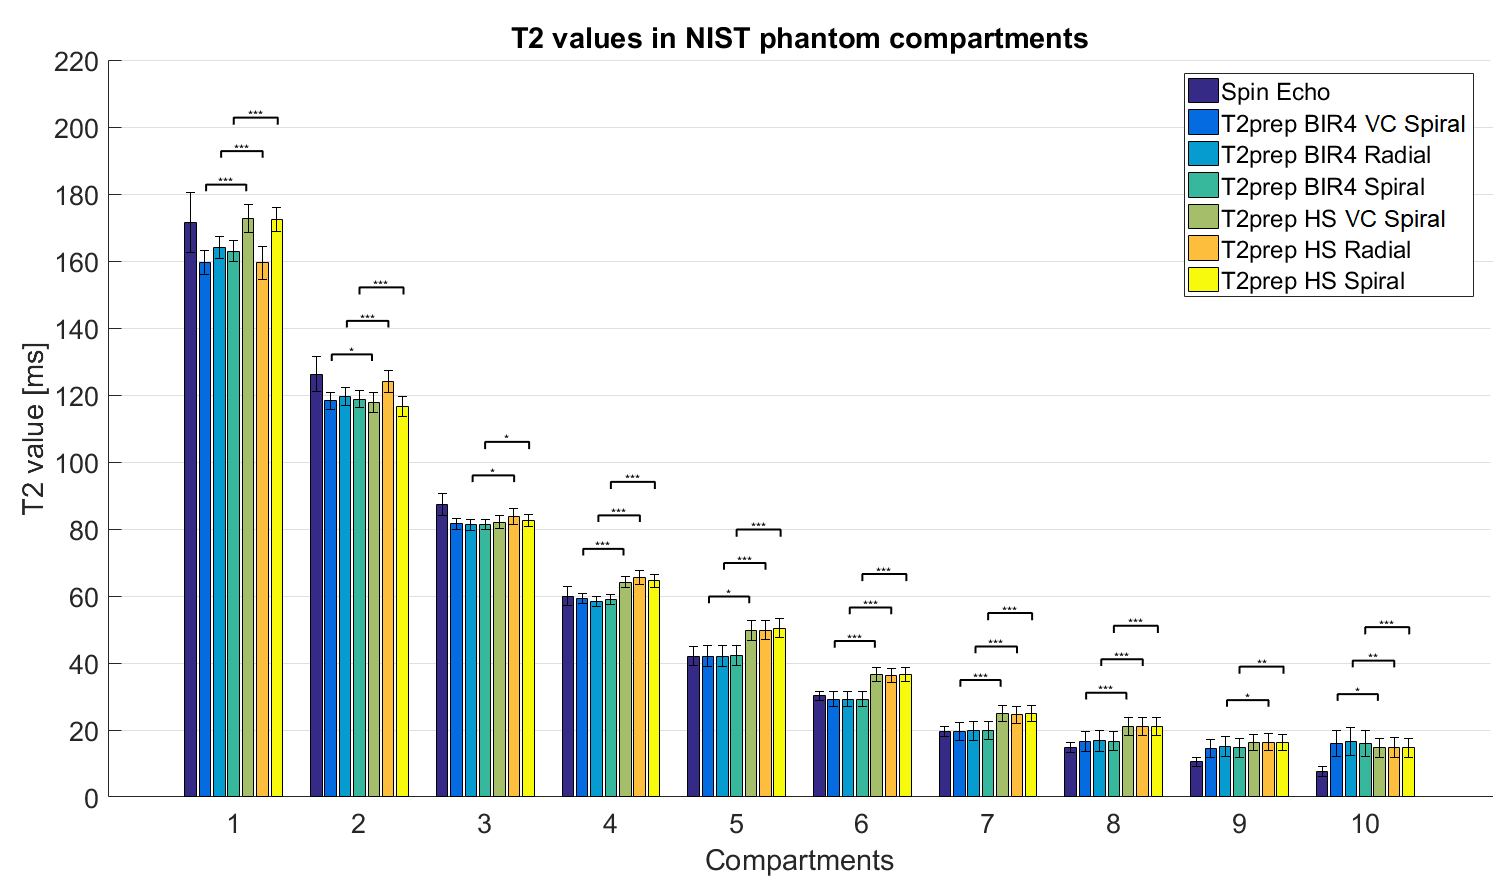
Phantom experiments were performed to test the six combinations of T2-preparation modules and trajectories. Data were acquired from a NIST-ISMRM quantitative System Phantom9 at 3T (MAGNETOM Skyra, Siemens Healthcare, Erlangen, Germany) using a 64-channel head/neck coil with the following sequence parameters: T2prep times=0/25/60/100ms, TR=2000ms, flip angle=7°, resolution=(1x1x1.2)mm³, matrix=256x240x176, undersampling factor=4, samples/TR=121, total TA=9:48min. As a reference for the T2-mapping, single-echo SE sequences (TR=3000ms, resolution=(1.7x1.7x3.3)mm³, matrix=128x128x1, TEs=10/15/20/40/80/150ms) were acquired. Wilcoxon rank sum tests were performed to compare T2 values between the different acquisitions (same pulse but different trajectories, same trajectory but different pulses). Additionally, root-mean-square errors (RMSE) to the reference were computed.
In vivo data of all six combinations were acquired according to the local ethics regulations from three subjects using the same sequence parameters as in the phantom experiments. Single-echo SE was not acquired in vivo due to time constraints. A white matter (WM) mask was obtained using the prototype Morphobox10 segmentation and eroded to avoid partial volume effects; assuming that T2 variations in WM are due both to individual microstructure and acquisition-induced biases, WM T2 homogeneity was used as a comparison metric.
Results
Figure 2 shows the mean and standard deviation of T2 phantom values. T2 values obtained with BIR4 are significantly different (p=5.82·10-7) from those obtained with HS, independent from the trajectory. Furthermore, BIR4 exhibit lower RMSE than HS images (RMSEBIR4=5.319, RMSEHS=6.387). The trajectory had no significant effect on T2 values except for the two highest T2 compartments (T2>126ms). For these, the radial/BIR4 combination provided the most accurate results.
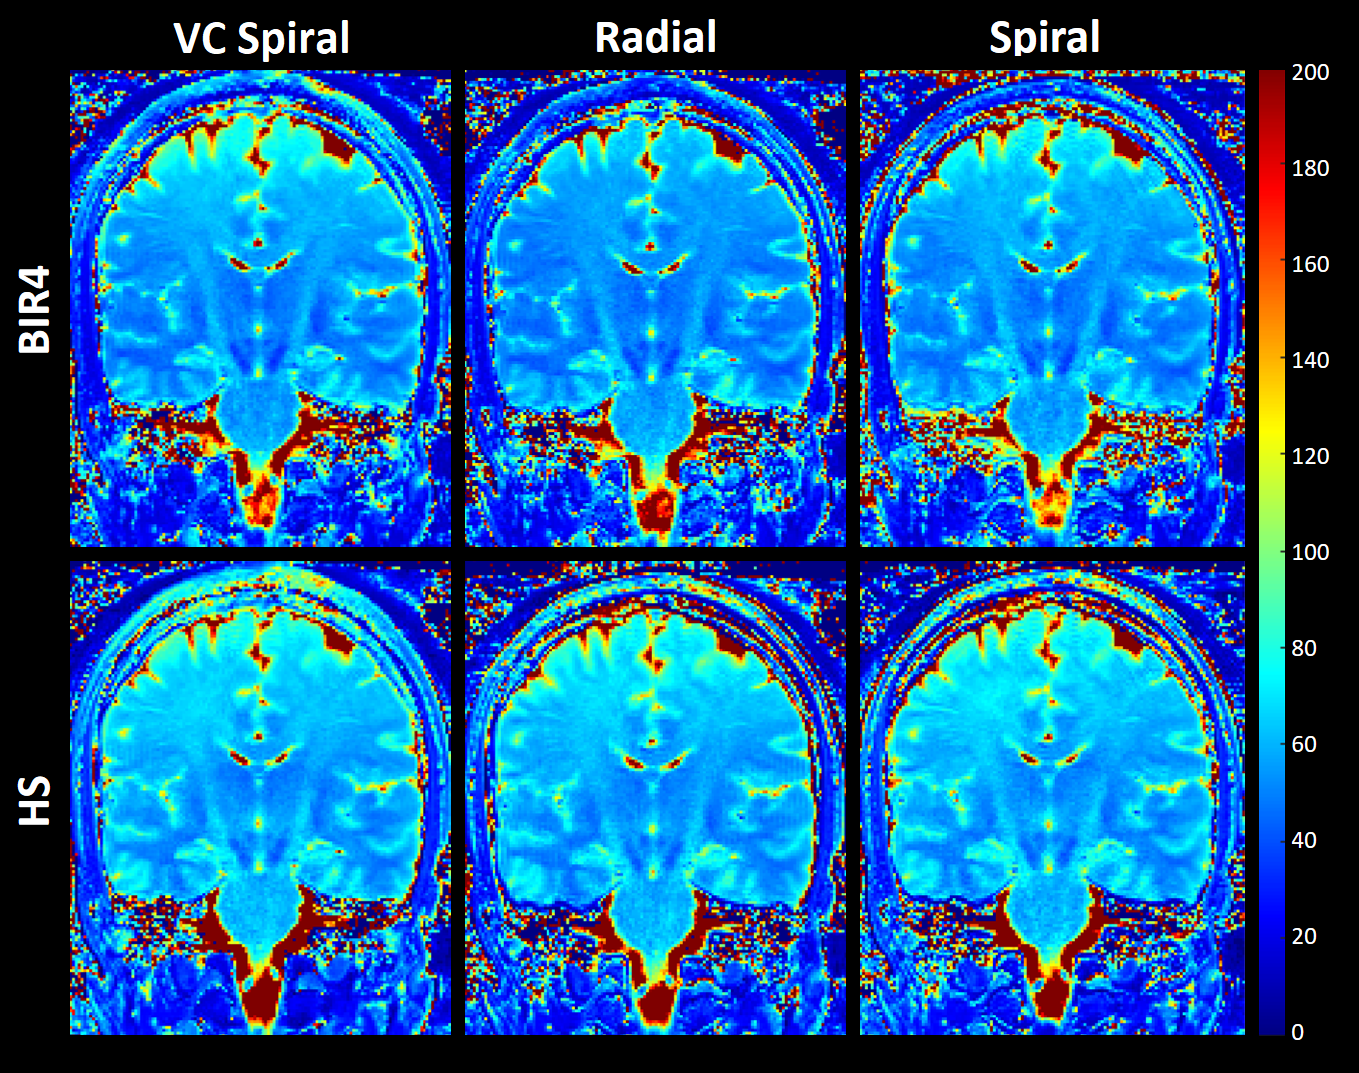
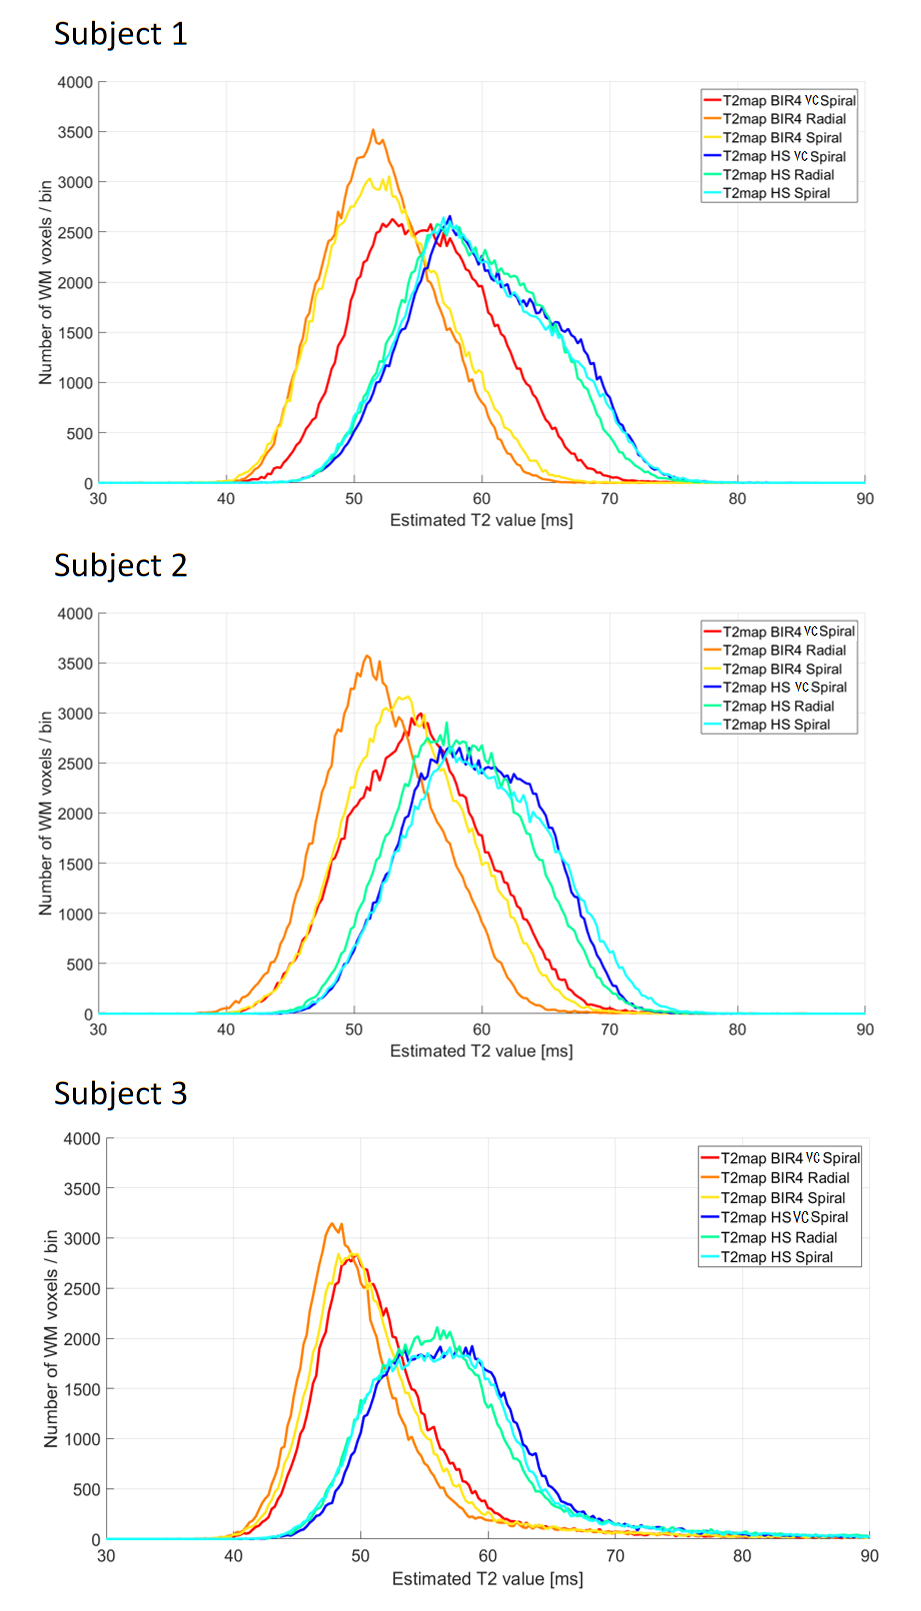
Figure 3 shows T2 maps from one subject for all six combinations. T2 maps acquired with a HS have slightly higher T2 values than BIR4 (~4ms) in most of the structures. HS appears to be more sensitive to B1 inhomogeneity than BIR4. T2 maps acquired with BIR4 show more homogeneous T2 values, except for the inferior part of the cerebellum and close to the nasal cavity, where B0 inhomogeneity potentially affects T2. Figure 4 compares WM T2 histograms acquired with the six different combinations. Histograms from HS T2-preparations have different distributions, presumably due to B1 inhomogeneity. Similar to the phantom data, the influence of the k-space trajectory on T2 values appears smaller. However, the WM histogram shows better homogeneity for radial jittered centre-out trajectories combined with a BIR4 module.
Discussion and Conclusion
We tested combinations of two types of T2-preparations and three k-space trajectories for CS 3D T2-mapping of the brain. Results from phantom and in vivo experiments showed best T2 accuracy with respect to the reference SE data using a BIR4 preparation. HS pulses appear more sensitive to B1 inhomogeneity, resulting in systematically elevated T2 values. No SE reference was acquired in vivo, WM T2 homogeneity was used for validation instead. This analysis confirmed the inferior performance of the HS preparation and a preference for a Cartesian jittered centre-out radial k-space trajectory. This combination (BIR4/Cartesian radial) and a previously optimised protocol enables whole-brain 3D T2-mapping in 9:48min at 1mm isotropic resolution.Acknowledgements
No acknowledgement found.References
1. Deoni SCL., “Quantitative relaxometry of the brain.” TMRI 21(2):101, 2010.
2. Jenista E., et al., “Motion and flow insensitive adiabatic T2 -preparation module for cardiac MR imaging at 3 Tesla.” Magn. Reson. Med., 70(5):1360-8, 2013.
3. Mussard E., et al., “High-resolution 3D T2 mapping of the Brain Using T2-prepared Cartesian Spiral Phyllotaxis FLASH and Compressed Sensing.” Proceedings of the International Society of Magnetic Resonance in Medicine, Honolulu, USA, 2017.
4. Lustig M., Donoho D., and Pauly J. M., “Sparse MRI: The application of compressed sensing for rapid MR imaging.” Magn. Reson. Med., 58(6):1182–1195, 2007.
5. Nezafat R. et al., “Spectrally selective B1-insensitive T2 magnetization preparation sequence.” Magn. Reson. Med., 61(6):1326–1335, 2009.
6. Nezafat R., et al., “B1-insensitive T2 Preparation for Improved Coronary Magnetic Resonance Angiography at 3T.” Magn. Reson. Med., 55:858-864, 2006.
7. Forman C., et al., “High-resolution 3D whole-heart coronary MRA: a study on the combination of data acquisition in multiple breath-holds and 1D residual respiratory motion compensation.” MAGMA, 27(5):435–443, 2014.
8. van Heeswijk R.B., et al., “Free-Breathing 3 T Magnetic Resonance T2 Mapping of the Heart.” JCMG, 5(12):1231–1239, 2012.
9. Keenan, K.E., et al., “Comparison of T1 measurements using ISMRM/NIST system phantom.” Proceedings of the International Society of Magnetic Resonance in Medicine, Singapore, 2016.
10. Schmitter, D., et al., “An evaluation of volume-based morphometry for prediction of mild cognitive impairment and Alzheimer's disease.” NeuroImage: Clinical, 7:7-17, 2015.
Figures