4534
Extracting Gold Standard Relaxation Times and Field Map Estimates from the Balanced SSFP Frequency Profile by Neural Network Fitting1High Field Magnetic Resonance, Max Planck Institute for Biological Cybernetics, Tübingen, Germany, 2Department of Biomedical Magnetic Resonance, University of Tübingen, Tübingen, Germany
Synopsis
It has been observed that the balanced steady-state free precession (bSSFP) frequency profile exhibits asymmetries if the intra-voxel frequency content is inhomogeneous and asymmetric. Recent attempts to calculate T1 and T2 values of human brain tissues from the measured bSSFP profile fail to account for anisotropies in the tissue microenvironment and are thus subject to a considerable bias, in particular for white matter. To eliminate this bias, a feedforward neural network is trained with the bSSFP profile as input and a multi-parametric output (i.e., T1, T2, B1, ∆B0) using gold standard relaxation times and reference field maps as ground truth.
Introduction
Phase-cycled balanced
steady-state free precession (bSSFP) imaging allows sampling the characteristic
tissue-specific frequency profile, which is sensitive to T1 and T2.
In existing relaxometry techniques using phase-cycled bSSFP experiments such as
MIRACLE 1 or PLANET 2, the estimated relaxation times of
human brain tissues mismatch gold standard reference values. The observed bias
is especially prominent in white matter and likely linked to an asymmetric intra-voxel
frequency content 3,4 due to fiber tract geometry, in combination with
multi-component relaxation, e.g. due to the presence of myelin. Here, we aim to
use neural network fitting to recover the gold standard T1 and T2
values from the bSSFP frequency profile while simultaneously mapping B1
and B0 field inhomogeneity.Methods
MR acquisition protocol.
3D sagittal bSSFP experiments were performed at 3T in four healthy volunteers. Twelve RF phase cycles were acquired covering a range of 360° in steps of 30°, with an isotropic resolution of 1.3x1.3x1.3 mm3, 128 slices, a TR/TE of 4.8 ms/2.4 ms, and a flip angle of 15°. Each phase-cycle acquisition was preceded by 256 dummy pulses and elliptical scanning was used, yielding a total acquisition time of 17min 13s. One volunteer was additionally scanned with a GRAPPA acceleration factor of 2, shortening the acquisition time to 10min 12s. Reference B1 and ∆B0 maps were obtained using a TurboFLASH sequence with preconditioning RF pulse for B1 5 and a standard dual-echo gradient-echo acquisition for ∆B0. Gold standard T1 and T2 values were derived from 2D multi-slice inversion recovery turbo-spin-echo (IR-TSE) scans with variable inversion times (TI = [100, 400, 800, 1600, 3200] ms) and 2D multi-slice single-echo spin-echo (SE) scans with variable echo times (TE = [10, 30, 60, 100] ms), respectively (in-plane resolution: 1.3x2.6 mm2, 30 axial slices, 2.6mm slice thickness, 100% slice gap). Overall scan time for the gold standard measurement was 17min 32s. For anatomical reference and segmentation purposes, a 3D sagittal MPRAGE acquisition was added to the protocol.
Neural network training.
The data of three volunteers was included into the training of a feedforward 4-layer deep neural network (NN) with in total 72 neurons in the three hidden layers, taking the magnitude and phase of the Fourier transformed complex bSSFP frequency response as input and the multi-parametric set [T1, T2, B1, ∆B0] available from the reference scans as target. The data set was divided randomly into three sets to prevent overfitting: training (70%), validation (15%), and testing (15%). Prior to input, the phase-cycled bSSFP data were registered onto the reference data and skull-stripped. The voxels containing CSF were excluded using the MPRAGE images for segmentation, yielding ~407000 voxels, which were included into training. The learned neural network was applied to trained data and untrained data from a fourth volunteer who was additionally scanned with GRAPPA-accelerated bSSFP. For comparison, T1 and T2 maps were derived using MIRACLE 1.
Results
Representative magnitude and phase images of a phase-cycled bSSFP experiment in the human brain are shown in Figure 1a. Asymmetries in the bSSFP frequency profile can be observed, which are substantially more pronounced in white than in gray matter (cf. Fig. 1b). Neural network prediction of T1 and T2 for trained (cf. Fig. 2, columns 1+2) as well as untrained (cf. Fig. 3, columns 1+2) data yields high agreement with the measured gold standard whereas MIRACLE substantially underestimates WM T1 and T2 as well as GM T1 (cf. Table 1). Predicted B1 and ∆B0 maps show the expected spatial inhomogeneity patterns in agreement with the reference measurements (cf. Figs. 2+3, columns 3+4). The B1 predicted for data not contained in the training set tends to overestimate B1 in comparison to the reference by about 10% in the center of the brain (cf. Fig. 3, column 3). The GRAPPA-accelerated quantitative data are nearly identical to the unaccelerated results (cf. Table 1 and Fig. 3). The substantial T1 and T2 underestimation of MIRACLE in comparison to the NN prediction is evident in Figure 4a, and explored in Figure 4b to assess tissue microstructure by T2 ratio maps.Discussion and Conclusion
Neural network fitting
enables to obtain gold standard relaxation time maps from the bSSFP frequency profile
with simultaneous B1 and B0 estimation. The ratio of the NN
predicted relaxation times to MIRACLE T1 and T2 has
potential to enhance the sensitivity to tissue microenvironment, such as myelin
content, as demonstrated here for T2. In conclusion, neural network
fitting of phase-cycled bSSFP data is a promising method for accurate
multi-parametric mapping and suited for rapid acquisitions accelerated by
parallel imaging.Acknowledgements
No acknowledgement found.References
1. Nguyen D, Bieri O. Motion-insensitive rapid configuration relaxometry. Magn Reson Med 2017;78(2):518-526.
2. Shcherbakova Y, van den Berg CAT, Moonen CTW, Bartels LW. PLANET: An ellipse fitting approach for simultaneous T1 and T2 mapping using phase-cycled balanced steady-state free precession. Magn Reson Med 2018;79(2):711-722.
3. Miller KL. Asymmetries of the balanced SSFP profile. Part I: theory and observation. Magn Reson Med 2010;63:385–395.
4. Miller KL. Asymmetries of the balanced SSFP profile. Part II: white matter. Magn Reson Med 2010;63:385–395.
5. Chung S, Kim D, Breton E, Axel L. Rapid B1+ mapping using a preconditioning RF pulse with TurboFLASH readout. Magn Reson Med 2010;64(2):439-446.
Figures
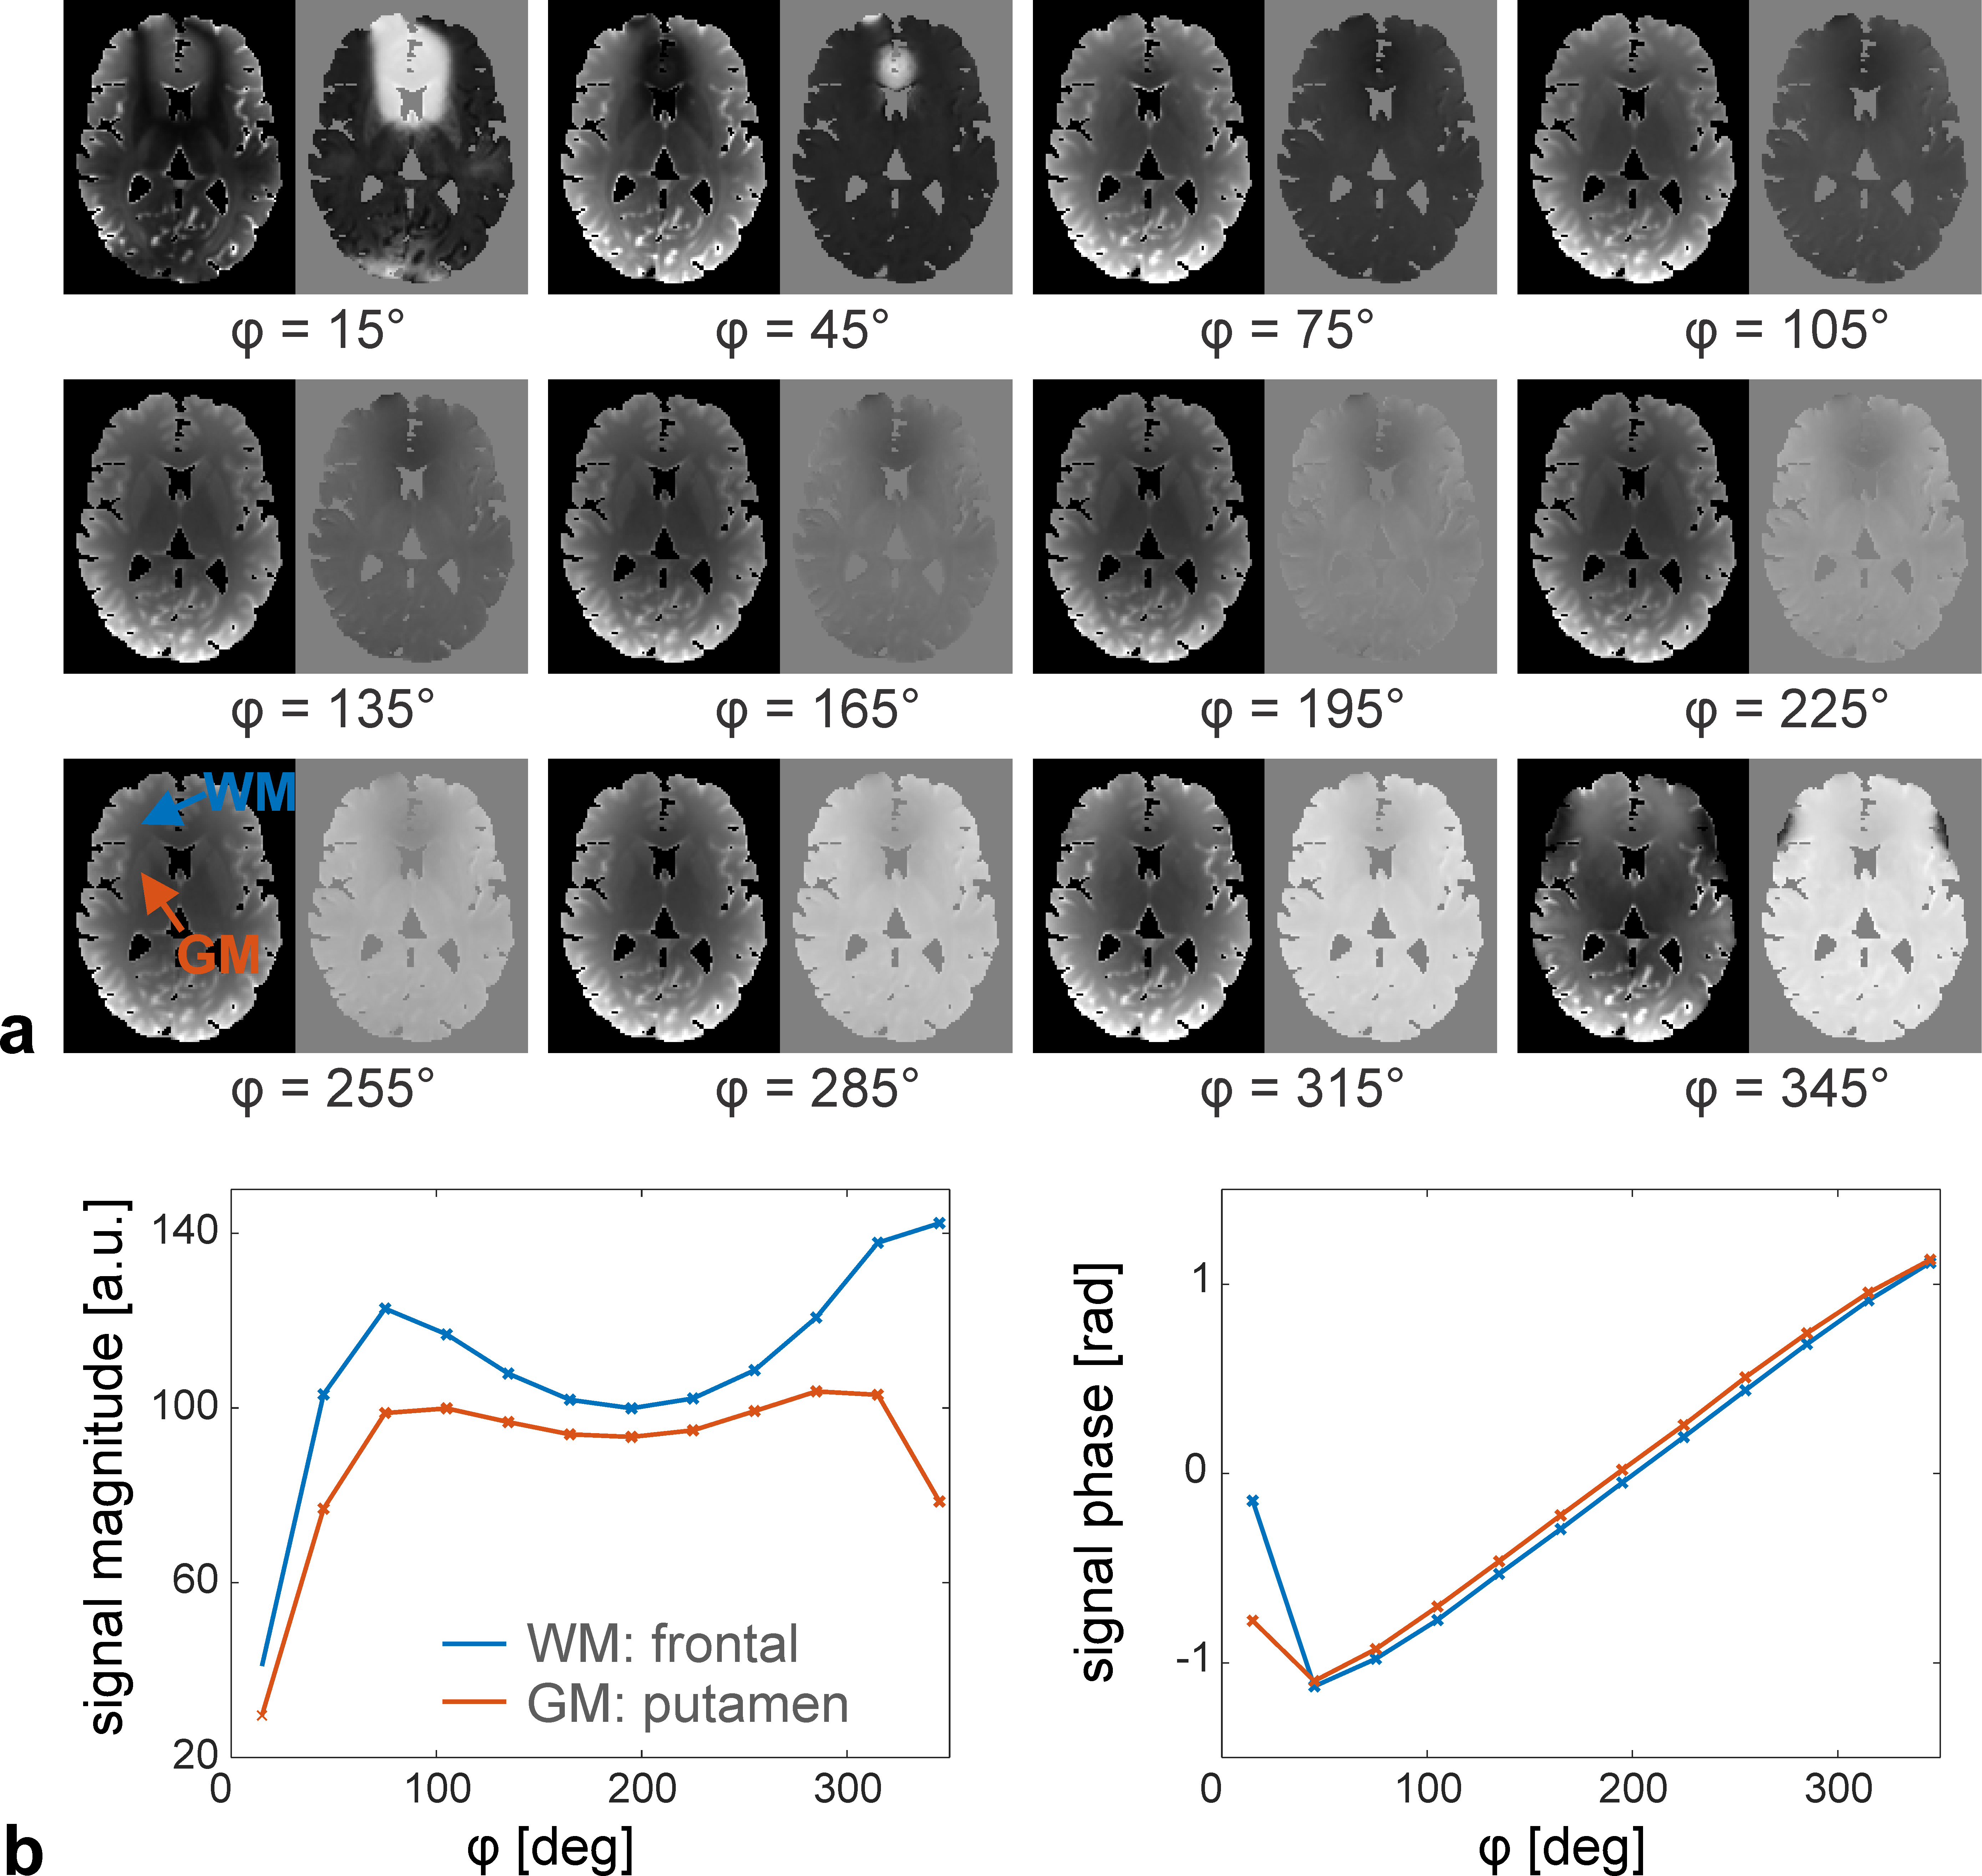
Figure 1. (a) Magnitude (left) and phase (right) pairs of a representative slice acquired with bSSFP experiments at twelve different phase-cycles φ in the range (0°,360°) in a healthy volunteer at 3T. For input into the neural network, the data was masked by skull-stripping and CSF removal as displayed here. (b) Region-of-interest (ROI) assessment for frontal white matter (blue) and gray matter (putamen, red), as indicated by the arrows in the bottom left image in (a). The magnitude (left) and phase (right) of the bSSFP frequency profile in the WM and GM ROI is plotted versus the RF phase increment (phase-cycle) φ.