4528
t-Distributed Stochastic Neighbor Embedding (t-SNE) as a Tool for Visualizing the Encoding Capability of Magnetic Resonance Fingerprinting (MRF) Dictionaries1C.J. Gorter Center for High Field MRI, Radiology, Leiden University Medical Center, Leiden, Netherlands, 2Philips Research Hamburg, Hamburg, Germany, 3Division of Image Processing, Radiology, Leiden University Medical Center, Leiden, Netherlands, 4Intelligent Systems Department, Delft University of Technology, Delft, Netherlands
Synopsis
In Magnetic Resonance Fingerprinting (MRF), the quality of the parameter maps depends on the encoding capability of the variable flip angle train. In this work we show how the dimensionality reduction technique t-Distributed Stochastic Neighbor Embedding (t-SNE) can be used to obtain insight into the encoding capability of different MRF sequences by embedding high-dimensional MRF dictionaries into a lower-dimensional space and visualizing them as colormaps. Experiments on example dictionaries perform comparison between different sequences and assess the effect of B1+ variations on the encoding capability.
Introduction
In Magnetic Resonance Fingerprinting (MRF), time-domain signals are matched to a pre-calculated dictionary to find quantitative T1 and T2 values (and other MR-encoded parameters) for each voxel in the anatomy of interest1. The quality of the resulting parameter maps depends on the encoding capability of the underlying MRF sequence, and so determining the optimal sequence or flip angle train is very important. However, well-established measures of the encoding quality have not yet been well-defined2. MRF is studied in a wide number of applications, and currently many of these studies use the same encoding sequence, even though the optimal sequence may actually be different for each application. Thus, it would be extremely useful to easily obtain insight into the encoding capability of different flip angle trains. In this work we demonstrate how the dimensionality reduction technique t-Distributed Stochastic Neighbor Embedding (t-SNE)3 can be used to visualize the encoding capability of high-dimensional MRF dictionaries.Methods
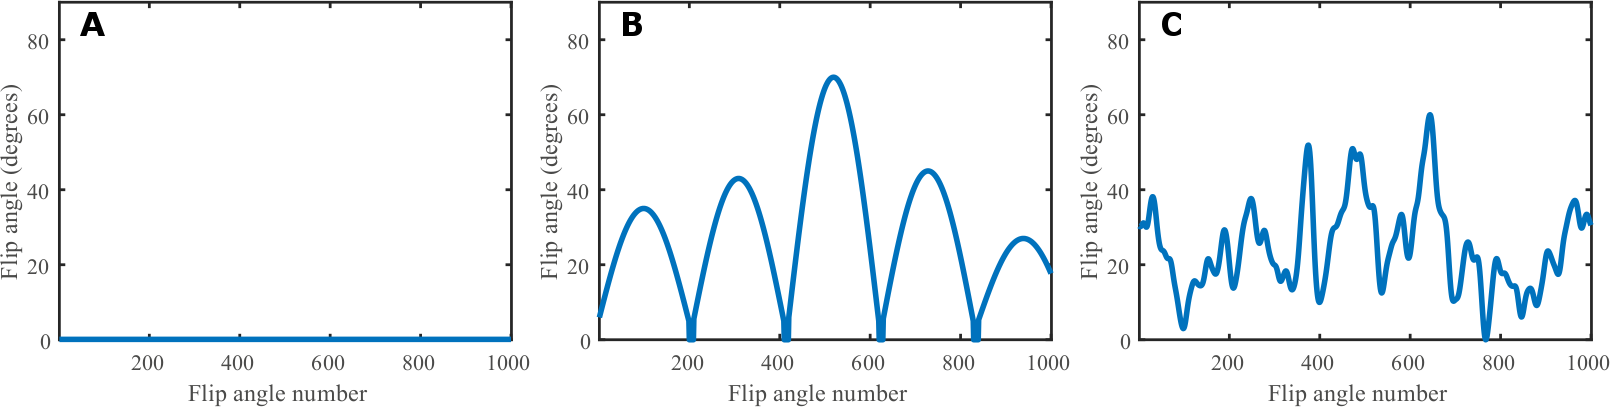
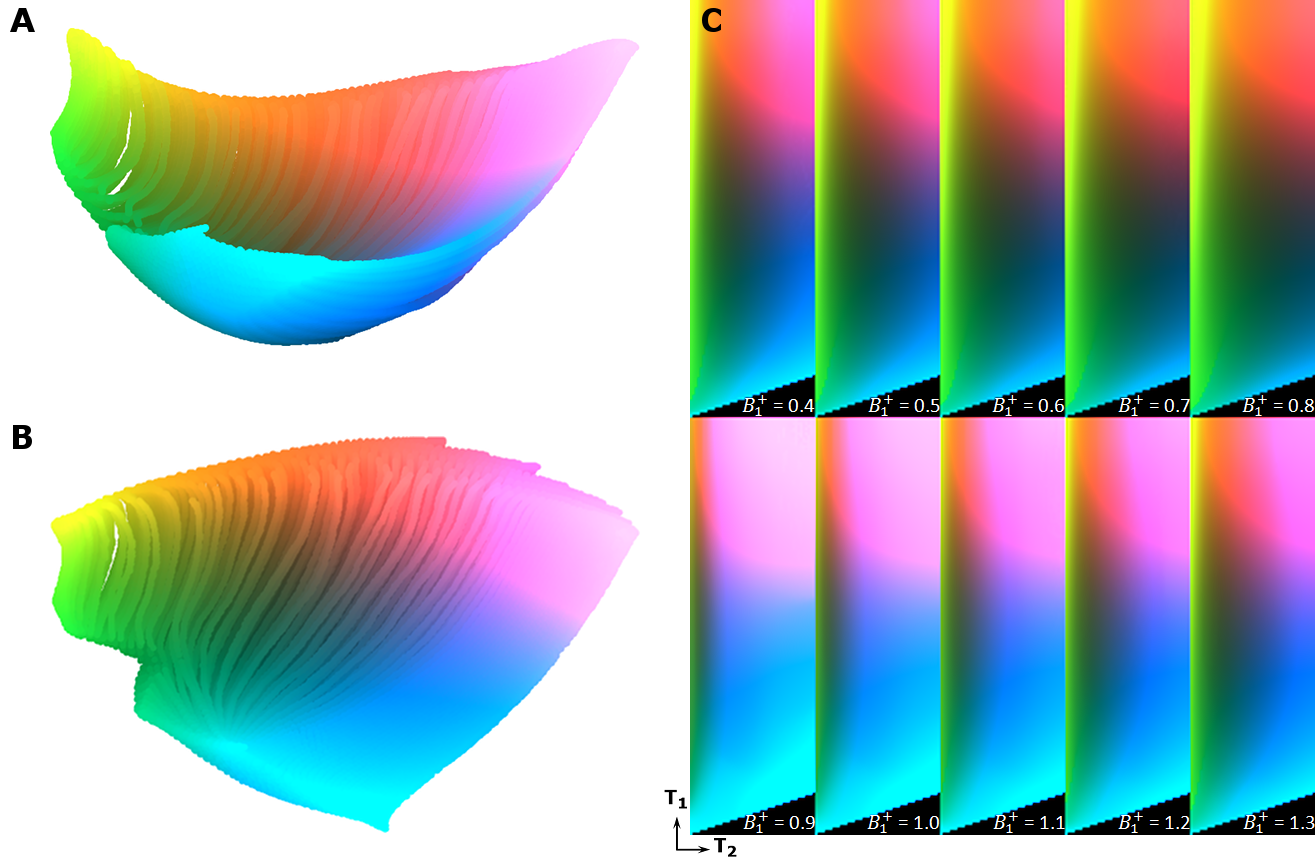
MRF dictionaries: Three different flip angle sequences were used to generate four MRF dictionaries. All sequences consist of 1000 flip angles and have a constant TR of 15 ms. Sequences shown in Figure 1 contain a constant pattern of 0.1° angles to reduce T2 encoding ability (dictionary DC), a smoothly varying pattern introduced by Jiang et al.4 (dictionary DJ) and a more jagged random pattern constructed by Sommer et al.2 (dictionary DS), which is known to have a lower encoding capability compared to Jiang’s sequence. All sequences were preceded by an inversion pulse. Additionally the sequence in Figure 1B was analyzed without an inversion pulse (dictionary DJ‒) to reduce the T1 encoding ability. The four dictionaries were created by Bloch simulations using the extended phase graph formalism. T1 values ranged from 20 to 5000 ms in steps of 30 ms, and T2 values ranged from 10 to 500 ms in steps of 10 ms. A dictionary for the sequence in Figure 1B (with inversion pulse) was also generated for B1+ variations ranging from 0.4 to 1.3 times the nominal values to mimic the impact of transmit RF inhomogeneity.
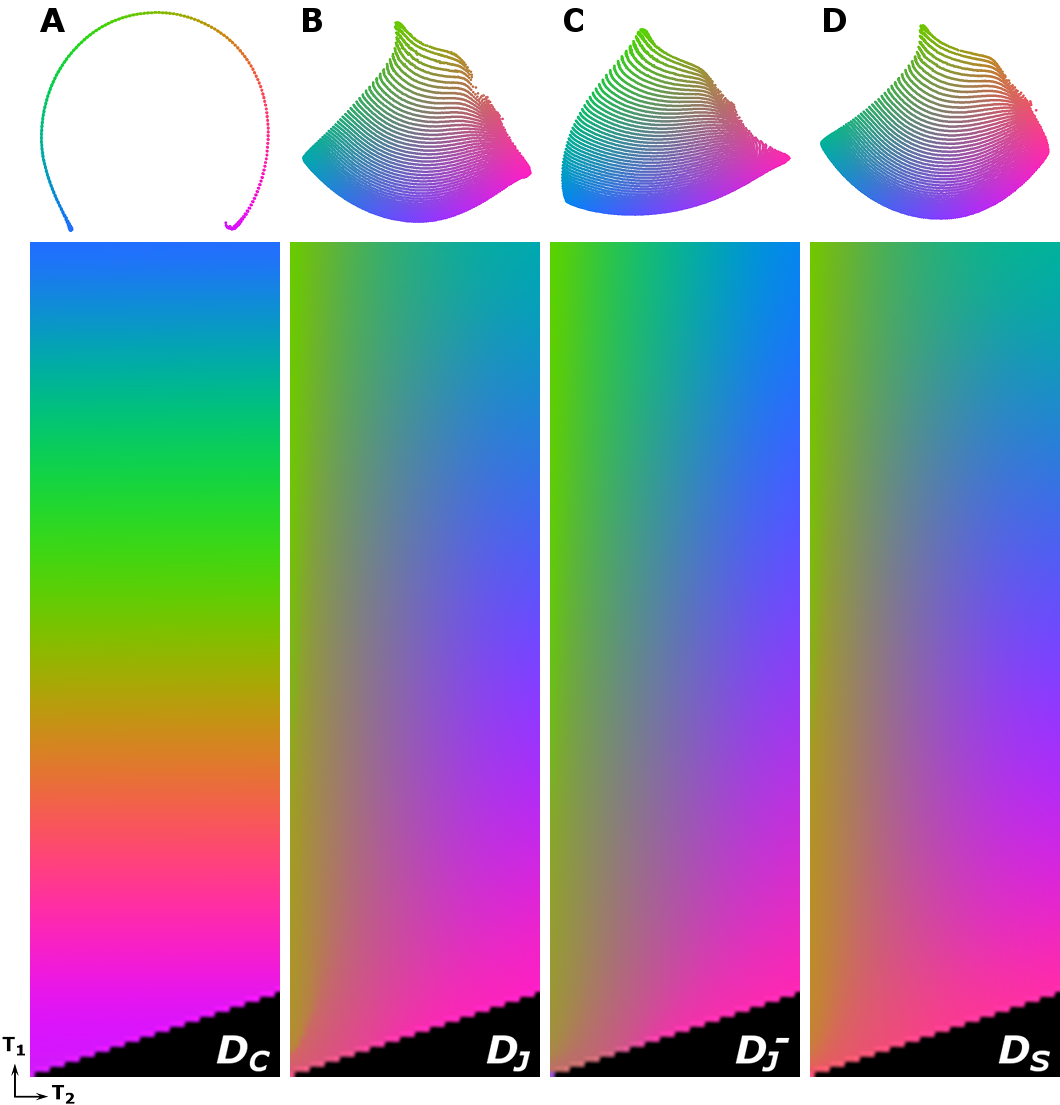
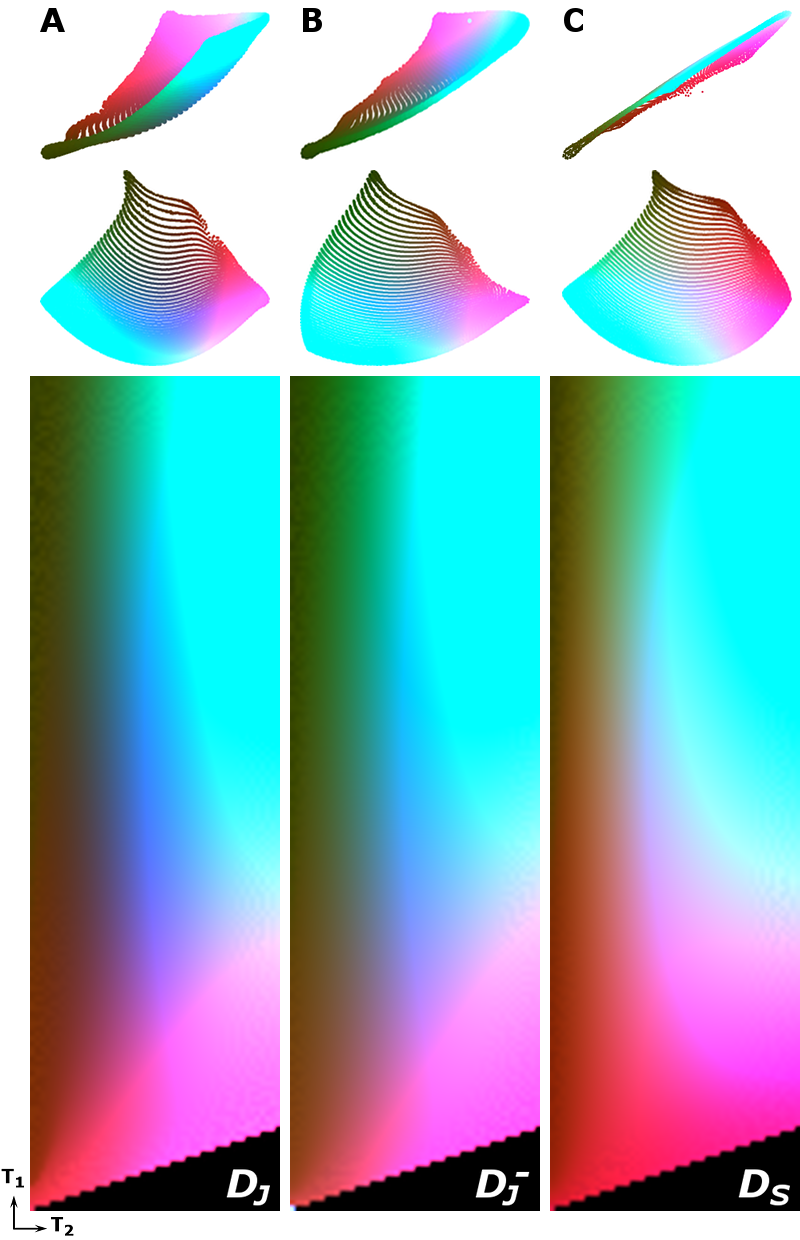
t-SNE: Interpreting each dictionary atom as a high-dimensional vector, the MRF dictionary was embedded into two- or three-dimensional space using the Barnes-Hut-SNE algorithm5. The maximum number of iterations was set to a very high value (105) to guarantee convergence. Each experiment was repeated several times to eliminate possible stochastic effects. Consequently, a color was assigned to each point of the low-dimensional embedding by mapping its coordinates into either a CIE L*a*b* color space (for the 3D case) or using a suitable 2D colormap6. Finally, a color-coded dictionary map was created by assigning the calculated color value to each (T1,T2) pair. All the embeddings were mapped to a common reference frame to ensure consistency of the color mapping.
Results
Figure 2 shows the 2D embedding and the corresponding color-coded dictionary maps of DC, DJ, DJ‒ and DS. Figure 3 shows the 3D embedding and the color-coded maps of DJ, DJ‒ and DS. Figure 4 shows the 3D embedding and its projection onto 2D of DJ including B1+ variations.Discussion
The constant low flip angle sequence does not have any T2 encoding capability, which is shown in the 2D color maps by a color variation of DC in only one direction. DJ encodes both T1 and T2 and therefore has color variation in two dimensions, determined by its two-dimensional manifold. Only small differences are observed, however, between DJ, DJ‒ and DS. To compare the encoding capability of these more complicated dictionaries, a 3D embedding is needed. The 3D analysis confirms improved encoding with an inversion pulse and indicated slightly worse performance of DS compared to DJ. The 2D projections of the 3D embeddings are very similar to the 2D embeddings in Figure 2, indicating stability of the embedding algorithm. For the three-dimensional dictionary, different B1+ values, in general, introduce a gradual color change, which indicates that the B1+-weighted signals are well-encoded and thus distinguishable. However, some T1/T2 combinations, such as very low T1 and/or T2, result in similar color for most B1+ levels, suggesting that values for tissues with these combinations are less affected by transmit inhomogeneities in the MRF matching process.Conclusion
A 3D embedding is able to visualize structural differences between different MRF dictionaries. The inversion pulse improves the encoding capability of the Jiang sequence, and, in general, B1+ effects introduce an extra encoding dimension. Although these insights are not new, the examples show that t-SNE can be used to compare, judge and obtain insight into the encoding capability of different MRF sequences. Further work is needed to investigate the potential of t-SNE in MRF sequence and study design.Acknowledgements
This project was funded by the European Research Council Advanced Grant 670629 NOMA MRI and partially by The Netherlands Technology Foundation (STW), as part of the STW Project 12721 (Genes in Space) under the Imaging Genetics (IMAGENE) Perspective programme.References
1. Ma D, Gulani V, Seiberlich N, et al. Magnetic resonance fingerprinting. Nature. 2013;495(7440):187–192.
2. Sommer K, Amthor T, Doneva M, et al. Towards predicting the encoding capability of MR fingerprinting sequences. Magnetic Resonance Imaging. 2017;41:7–14.
3. Van der Maaten L, Hinton G. Visualizing data using t-SNE. Journal of Machine Learning Research. 2008;9:2579–2605.
4. Jiang Y, Ma D, Seiberlich N, et al. MR fingerprinting using fast maging with steady state precession (FISP) with spiral readout. Magnetic Resonance in Medicine. 2015;74(6):1621–1631.
5. Van der Maaten L. Barnes-Hut-SNE. In Proceedings of the International Conference on Learning Representations, 2013.
6. Teuling AJ, Stöcklic R, Seneviratnea SI. Bivariate colour maps for visualizing climate data. International Journal of Climatology. 2011;31:1408–1412.
Figures