4526
Towards Continuous Dictionary Resolution in MR Fingerprinting using a Quadratic Inner Product Model1Radiology, Case Western Reserve University, Cleveland, OH, United States, 2Biomedical Engineering, Case Western Reserve University, Cleveland, OH, United States
Synopsis
Magnetic resonance fingerprinting is a framework for creating quantitative tissue property maps from a single acquisition. The accuracy and precision of these maps depend upon a precomputed dictionary of simulated signal evolutions, to which acquired signals are matched using the inner product to determine the tissue property values. We propose to approximate the inner product as a quadratic function of the tissue properties in a neighborhood around the correct match in order to reduce the effect of tissue property step size in the dictionary. Results from data acquired with different MRF sequences demonstrate the value of the proposed approach.
Introduction
Magnetic resonance fingerprinting (MRF)1 uses the inner product to match acquired signal evolutions with a precomputed dictionary to create quantitative tissue property maps. The range and step size of each tissue property in the dictionary is a determining factor of the accuracy and precision of the maps. While a large dictionary with fine step size is ideal, it may be prohibitively large for computations. Here we introduce a framework to approximate the inner product as a quadratic function of the tissue properties themselves, allowing the tissue property estimation to be performed in a continuous domain.Theory
The MRF dictionary is a large matrix of size mxn, where m is the number of time points in the sequence, and n represents the number of tissue property combinations. For a given sequence, we can represent each dictionary entry as a function of the tissue property vector $$$\theta$$$ by $$$d = d(\theta)$$$.
Assuming that a given voxel is represented by tissue $$$\theta_0$$$ , the acquired MRF signal evolution from this voxel can be written as
$$s = d(\theta_0) + \epsilon$$
with noise term $$$\epsilon$$$. The signal is matched to the dictionary by comparing the inner product values between $$$s$$$ and each dictionary entry to find the maximum in absolute value. The inner product is written as
$$f(\theta) = s^\ast d(\theta) = \left(d(\theta_0) + \epsilon \right)^\ast d(\theta) = d(\theta_0)^\ast d(\theta) + \epsilon^\ast d(\theta), (1)$$
where * denotes conjugate transpose. Note that in the case where $$$\theta$$$ is in a neighborhood of $$$\theta_0$$$, then a quadratic approximation of the inner product (i.e., $$$f(\theta) \approx ||d(\theta)||^2$$$) is appropriate. After applying a Taylor series expansion of $$$d$$$ in a neighborhood of $$$\theta_0$$$, we can write the inner product as a quadratic function of $$$\theta = (T_1, T_2)$$$. For example, in MRF-FISP2, the inner product is approximated as the quadratic
$$f(T_1,T_2) \approx p_{00} + p_{10}T_1 + p_{01}T_2 + p_{11}T_1 T_2 + p_{20}T_1^2 + p_{02}T_2^2, (2)$$
for coefficients $$$p_{ij}, 0\leq i+j \leq 2$$$. We can estimate a tissue property neighborhood which contains the true values by matching $$$s$$$ to a MRF dictionary with larger tissue property step sizes, i.e., a “coarse dictionary.” Using the corresponding inner product values associated with this neighborhood, we compute the coefficients as in equation (2) for MRF-FISP, and then find its critical point. It is straightforward to generalize this model to more than two tissue properties, as in the case of MRF-bSSFP1 or MRF with quadratic phase (qRF-MRF)3.
Methods
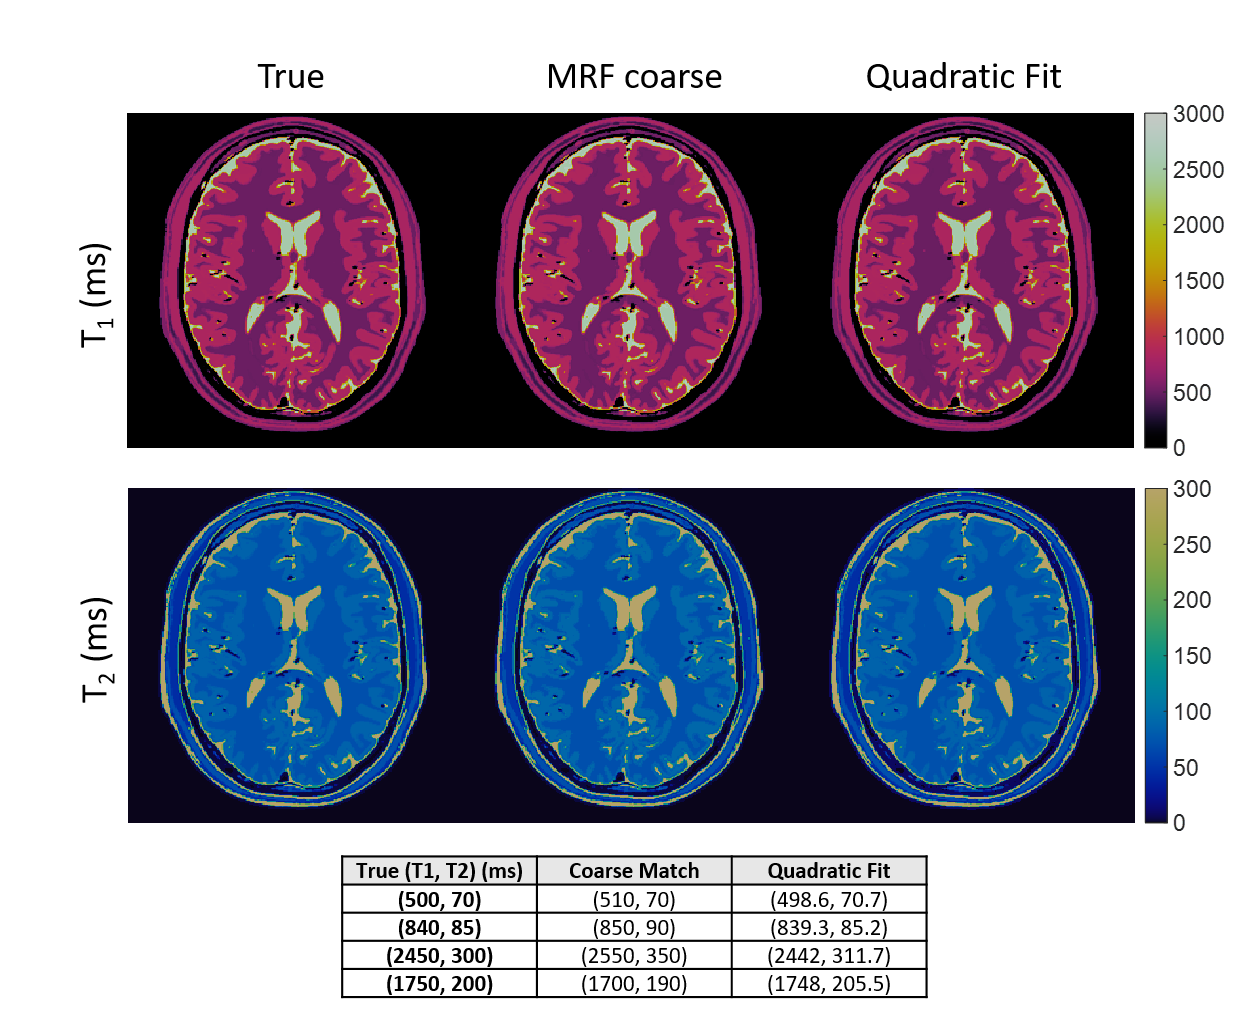
The quadratic inner product model was tested on a simulated brain phantom using MRF-FISP. A dictionary of size 3000x5970 was used to create simulated MRF signal evolutions and to generate the true values. The coarse dictionary had dimensions 3000x1510, formed by downsampling the larger dictionary tissue properties each by 2. At each pixel, a neighborhood of points was found by matching the signal evolution to the coarse dictionary, and then equation (2) was approximated and the critical point found. Three volunteers were consented and scanned under an IRB-approved study. They were a normal subject scanned with MRF-FISP, a brain tumor patient (adenocarcinoma metastasis) scanned with MRF-bSSFP, and a normal volunteer scanned with qRF-MRF4. The MRF-bSSFP benchmark dictionary contained 3307 T1, T2 combinations and 77 off-resonance values and the coarse dictionary contained 854 T1, T2 combinations and 39 off-resonance values. For qRF-MRF, only a coarse dictionary was used due to the fact that there are four tissue property dimensions. The dictionary contained 1590 T1, T2 combinations, 51 off-resonance values, and 26 T2* values. For both MRF-bSSFP and qRF-MRF, a modified version of equation (2) was used.
A one-shot spiral trajectory was used in each case and SVD compression5,6 was used for both the benchmark and coarse dictionaries for compression.
Results
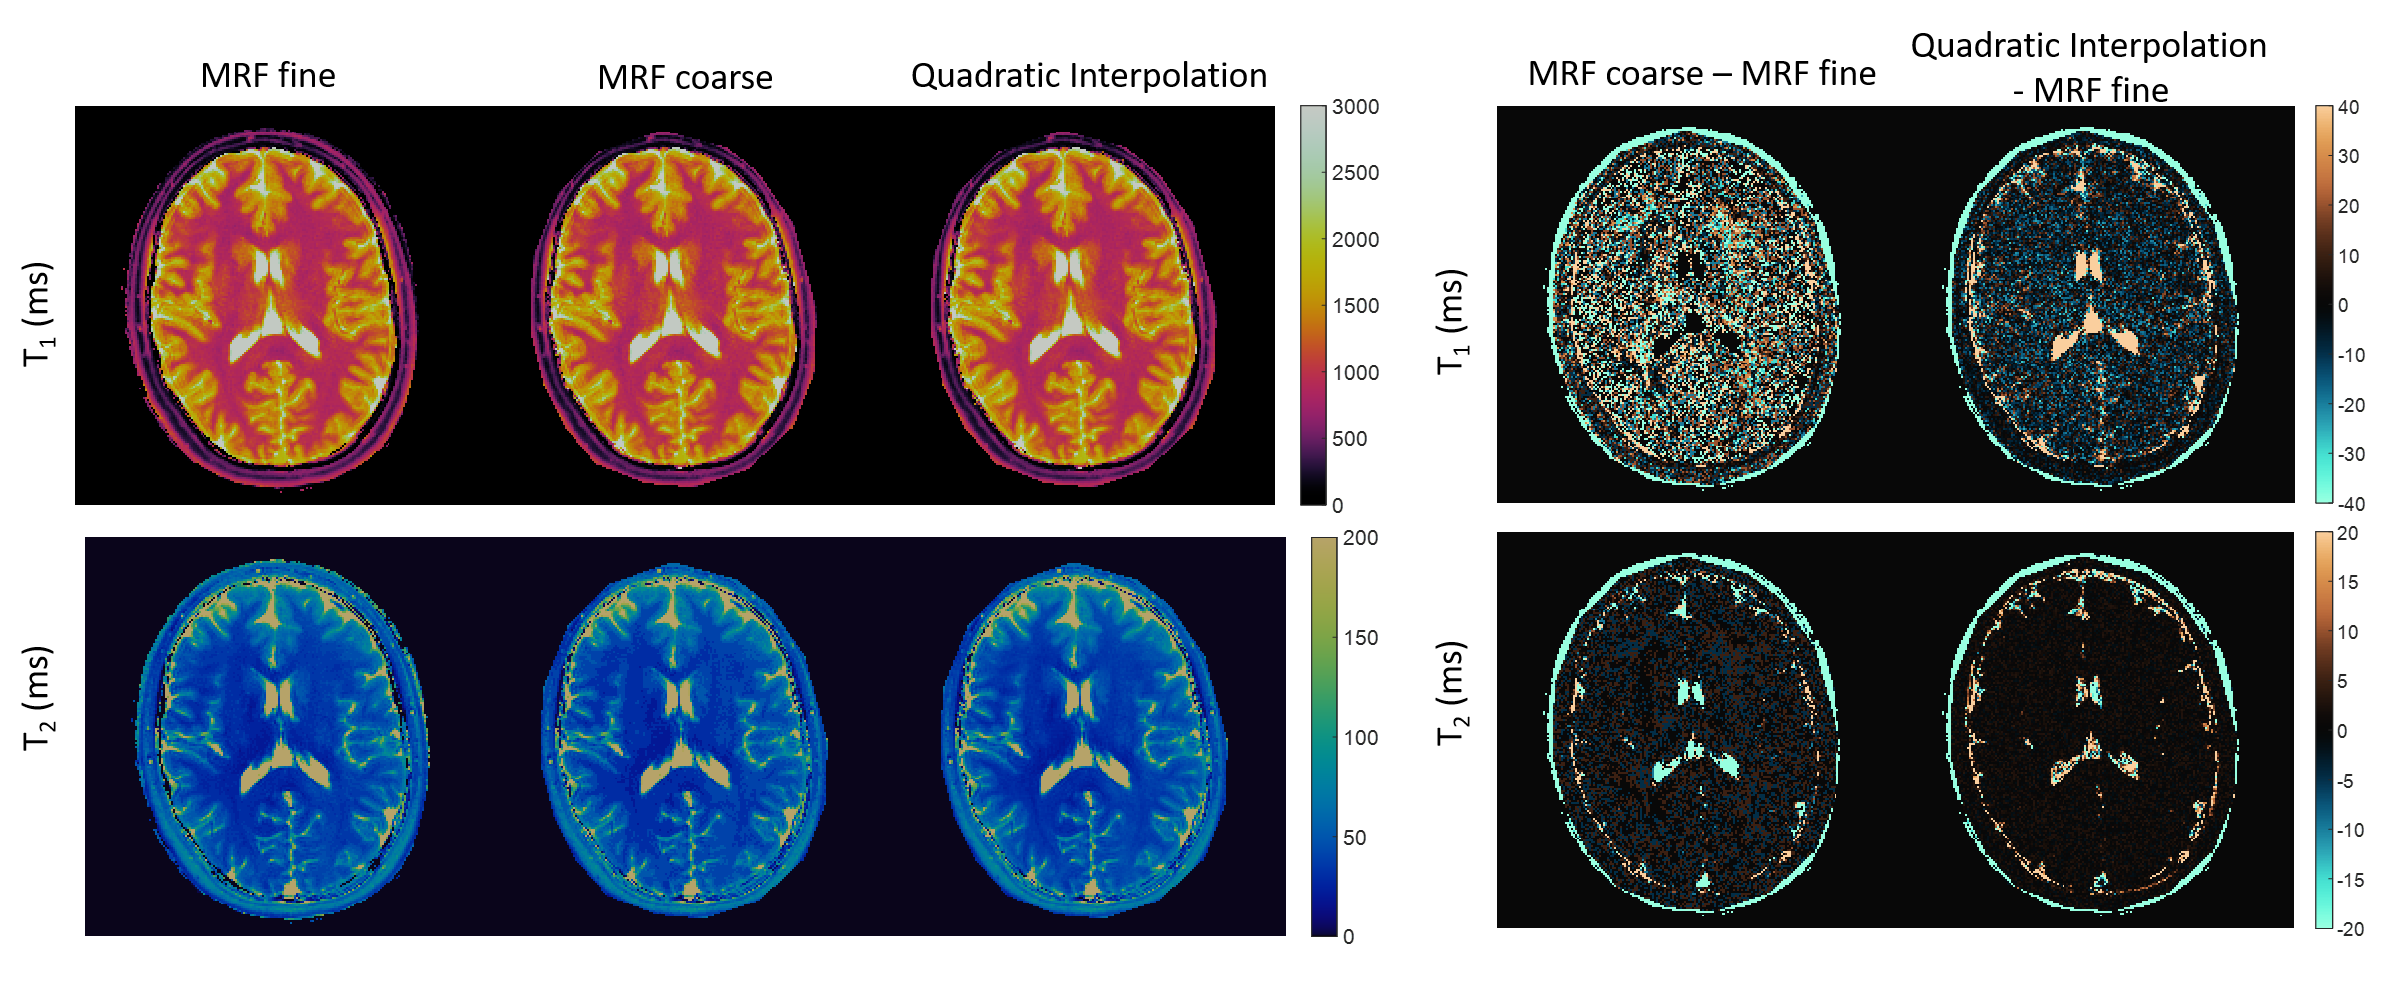
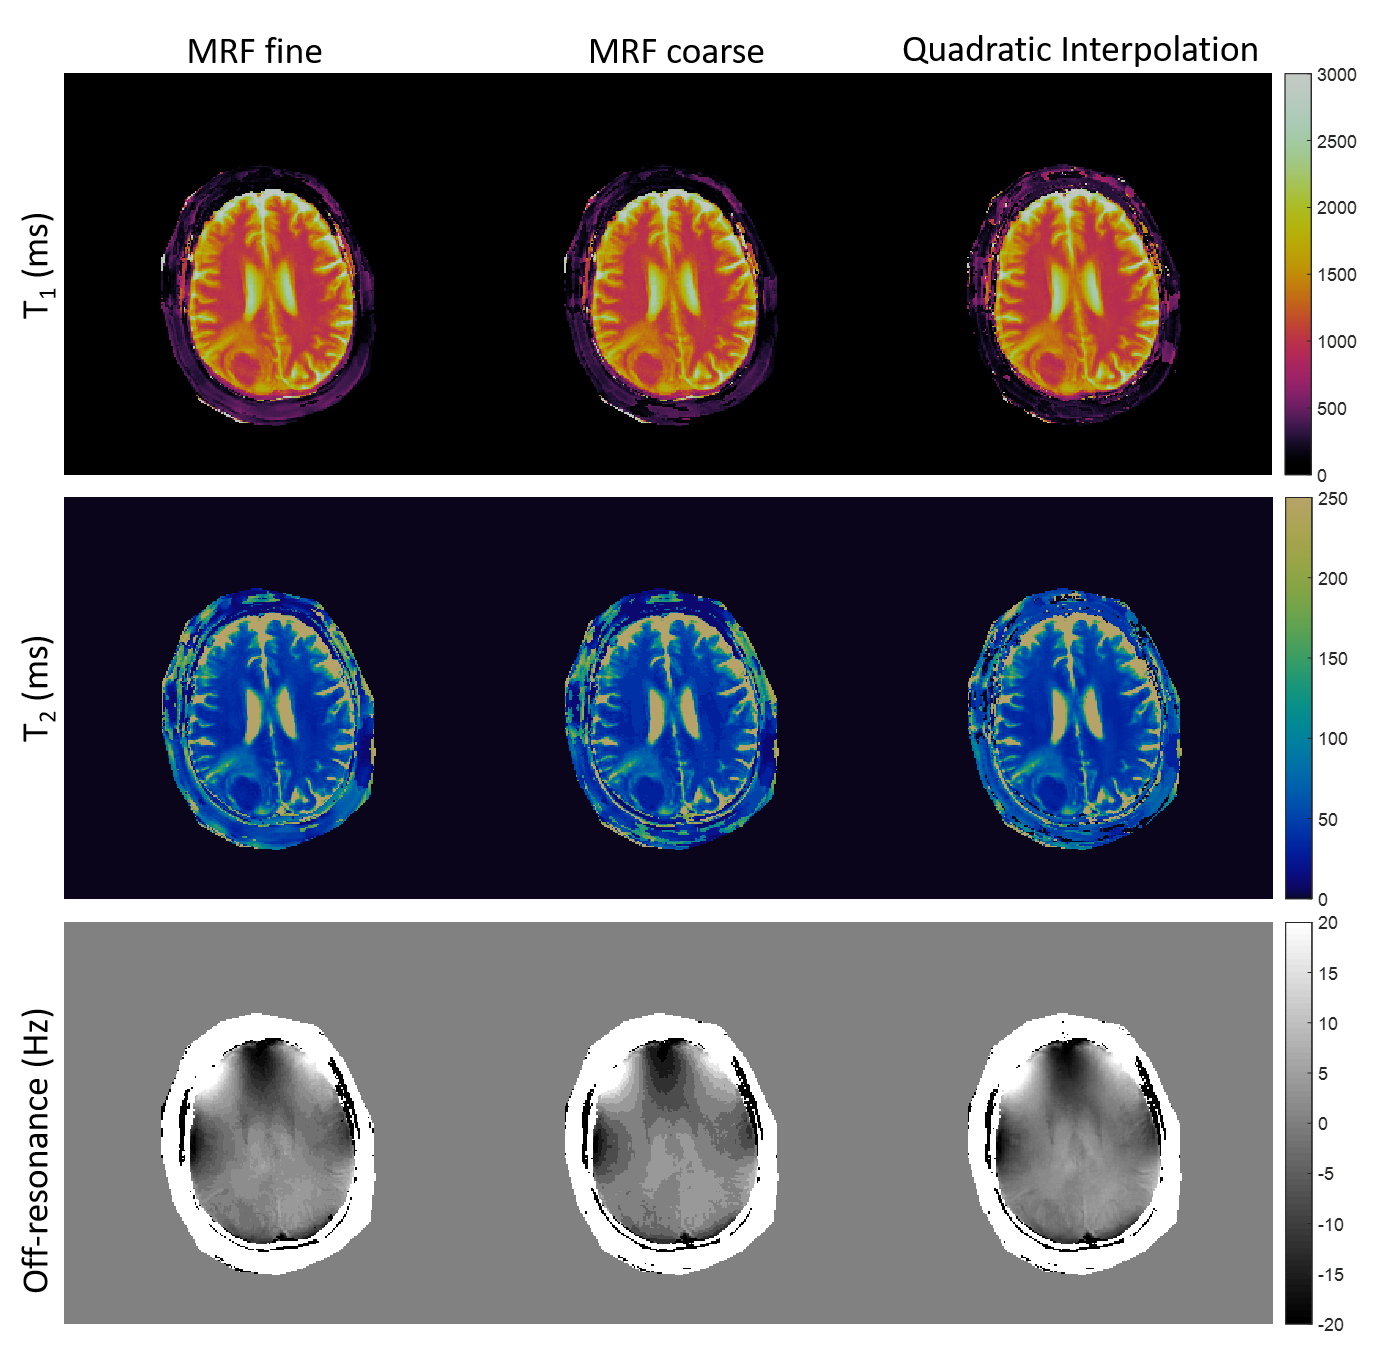
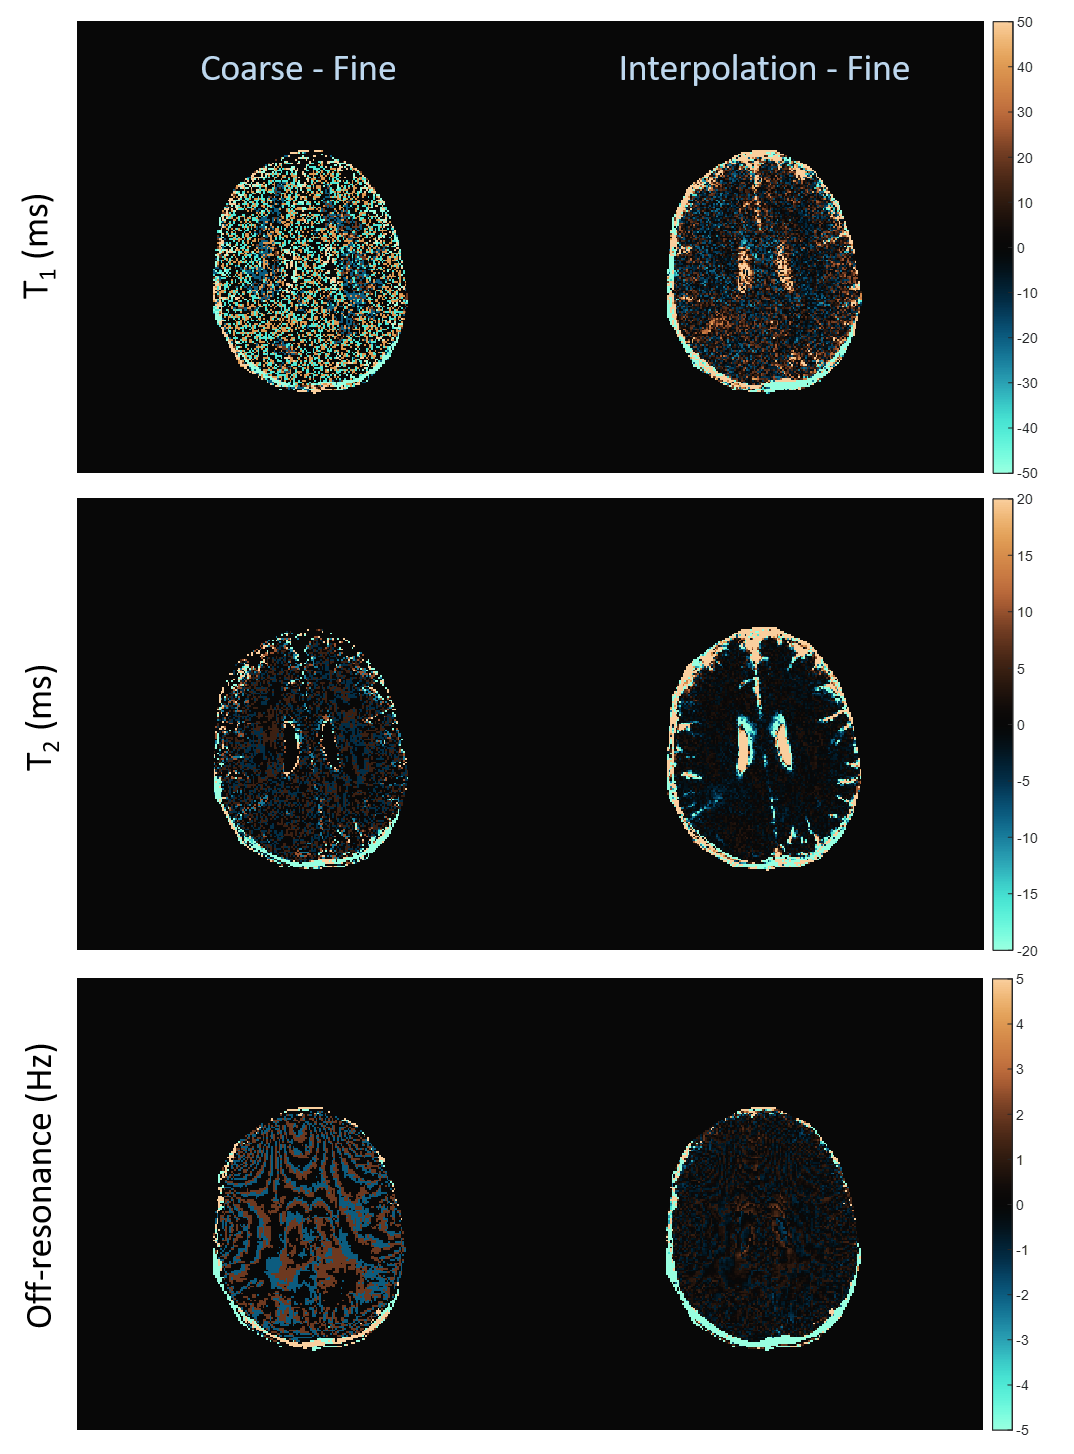
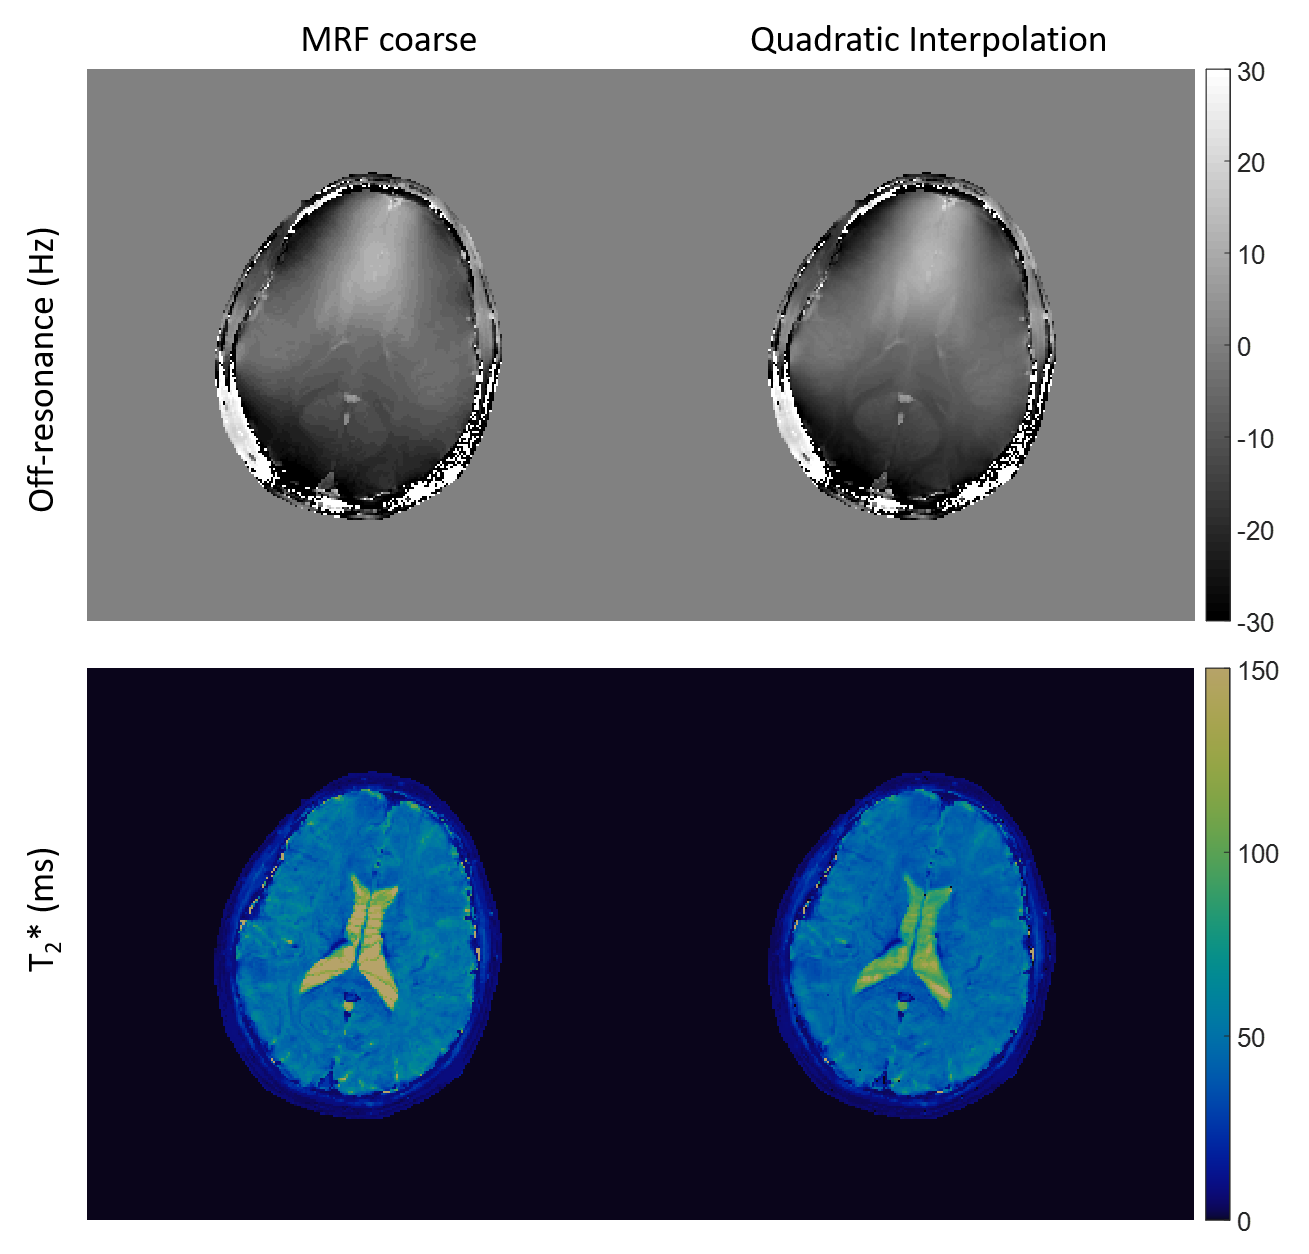
Results from the numerical phantom are in Figure 1, with four pixels highlighted. In cases where the true tissue properties were not present in the coarse dictionary, improved results were found through quadratic fitting. For the normal volunteer scanned with MRF-FISP, the same dictionary as used in the phantom was applied, using the fine dictionary of 5970 properties as the benchmark. Results using MRF-FISP are in Figure 2. For the brain tumor patient, tissue property maps and differences are in Figures 3 and 4, respectively. For qRF-MRF, off-resonance and T2* maps are in Figure 5.Discussion and Conclusion
This work demonstrates the feasibility of a quadratic approximation of inner product matching for MRF. Examples using three different sequence types are shown, highlighting the generality of the method. In most pixels, the quadratic fit provides a better approximation to the fine dictionary matching than the coarse, demonstrating the ability of the method to overcome the problem of step size in the MRF dictionary.Acknowledgements
The authors would like to acknowledge funding from Siemens and NIH grants 1R01EB016728-01A1 and 5R01EB017219-02.References
- Ma, D. et al. Magnetic resonance fingerprinting. Nature 495, 187–192 (2013).
- Jiang, Y., Ma, D., Seiberlich, N., Gulani, V. & Griswold, M. MR fingerprinting using fast imaging with steady state precession (FISP) with spiral readout. Magn. Reson. Med. 74, 1621–1631 (2015).
- Wang, C. Y. et al. Magnetic resonance fingerprinting with quadratic RF phase for measurement of T2 * simultaneously with δf, T1 , and T2. Magn. Reson. Med. 1–14 (2018). doi:10.1002/mrm.27543
- Wang, C. et al. Magnetic resonance fingerprinting with pure quadratic RF phase. Submitted as an abstract, 27th annual ISMRM, Montreal (2019).
- McGivney, D. et al. SVD compression for magnetic resonance fingerprinting in the time domain. IEEE Trans. Med. Imaging 33, 2311–2322 (2014).
- Yang, M. et al. Low rank approximation methods for MR fingerprinting with large scale dictionaries. Magn. Reson. Med. 79, 2392–2400 (2018).
Figures