4519
On the impact of slice profile and thickness definition across vendors in 2D bSSFP on SNR and T1-mapping in cardiac MRI1MR Clinical Science, Philips, Best, Netherlands, 2MR Clinical Science, Philips, Montréal, QC, Canada, 3MR Clinical Excellence, Philips, Best, Netherlands
Synopsis
The actual slice thickness and slice profile in 2D imaging are often not taken into account when comparing SNR from different platforms. It can also have an impact in quantitative imaging such as T1-mapping. Inspired by an earlier study, we compared two definitions of slice thickness in 2D bSSFP(the workhorse in CMR): full width at 50% (FW50) and full width at 70% of maximum (FW70). The FW70 pulse definition leads to 30% thicker slices, 9-30% more SNR and it is more vulnerable to partial volume effects. These effects needs to be taken into account when comparing scans from different platforms in multi-center trials.
Introduction
Signal-to-noise ratio is an important parameter in MRI as it relates to the required scan time and affects reliability of derived quantitative parameters such as T1. The signal S, the voxel volume and the square root of total scan time times scan efficiency are all proportional to the SNR of a generic pulse sequence. With S being dependent on sequence timing, flip angle, proton density and relaxation times. A usually ignored effect is the shape of the voxel. The use of short RF pulses can compromised this shape. A recent study on measuring slice profiles across multiple platforms (>120 1.5T systems from 4manufacturers) using the ACR phantom showed an increase in actual slice thickness in excess of 30% in some cases, which suggests an important impact on the measured SNR of these sequences . Accordingly and as an example, we reproduced the slice profiles for the two extreme cases from this study and used the corresponding RF pulses to explore the implications in clinical sequences like 2D bSSFP as this is a workhorse in cardiac MR imaging being used for cine, late enhancement, T1-mapping and perfusion.Methods
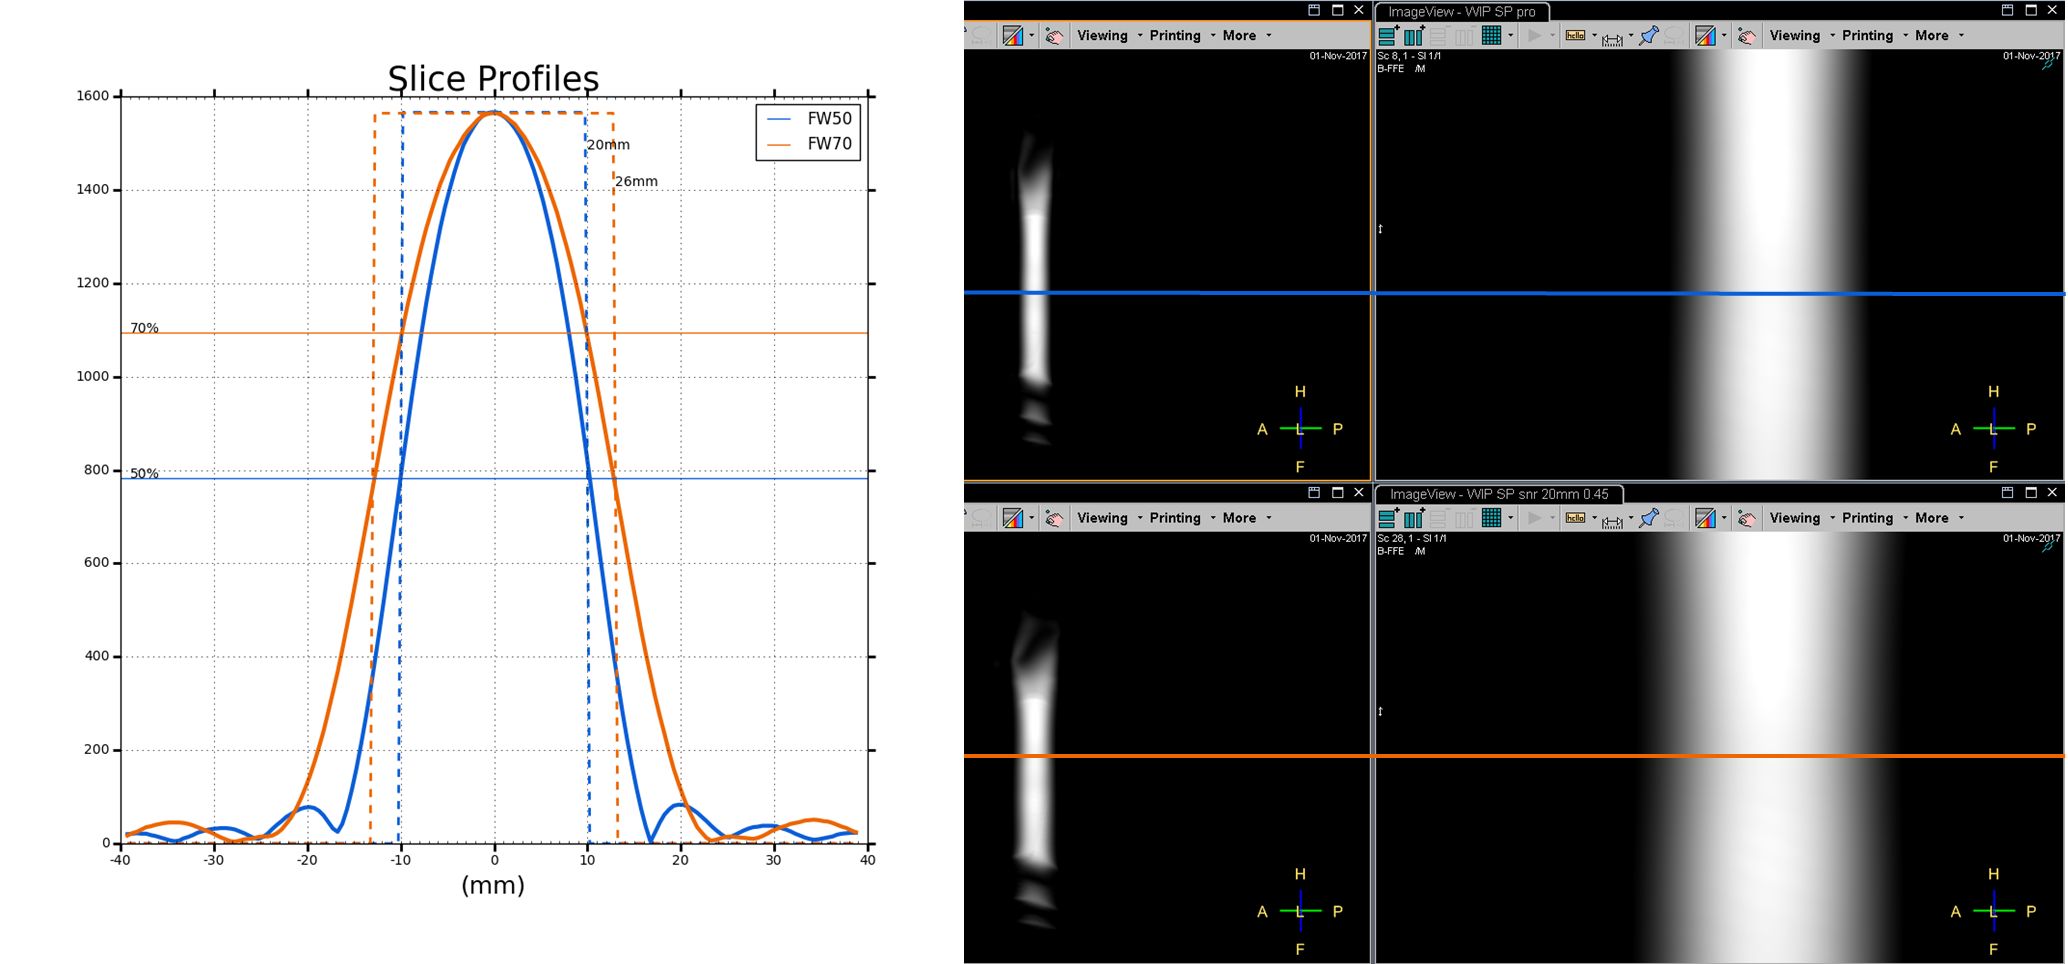
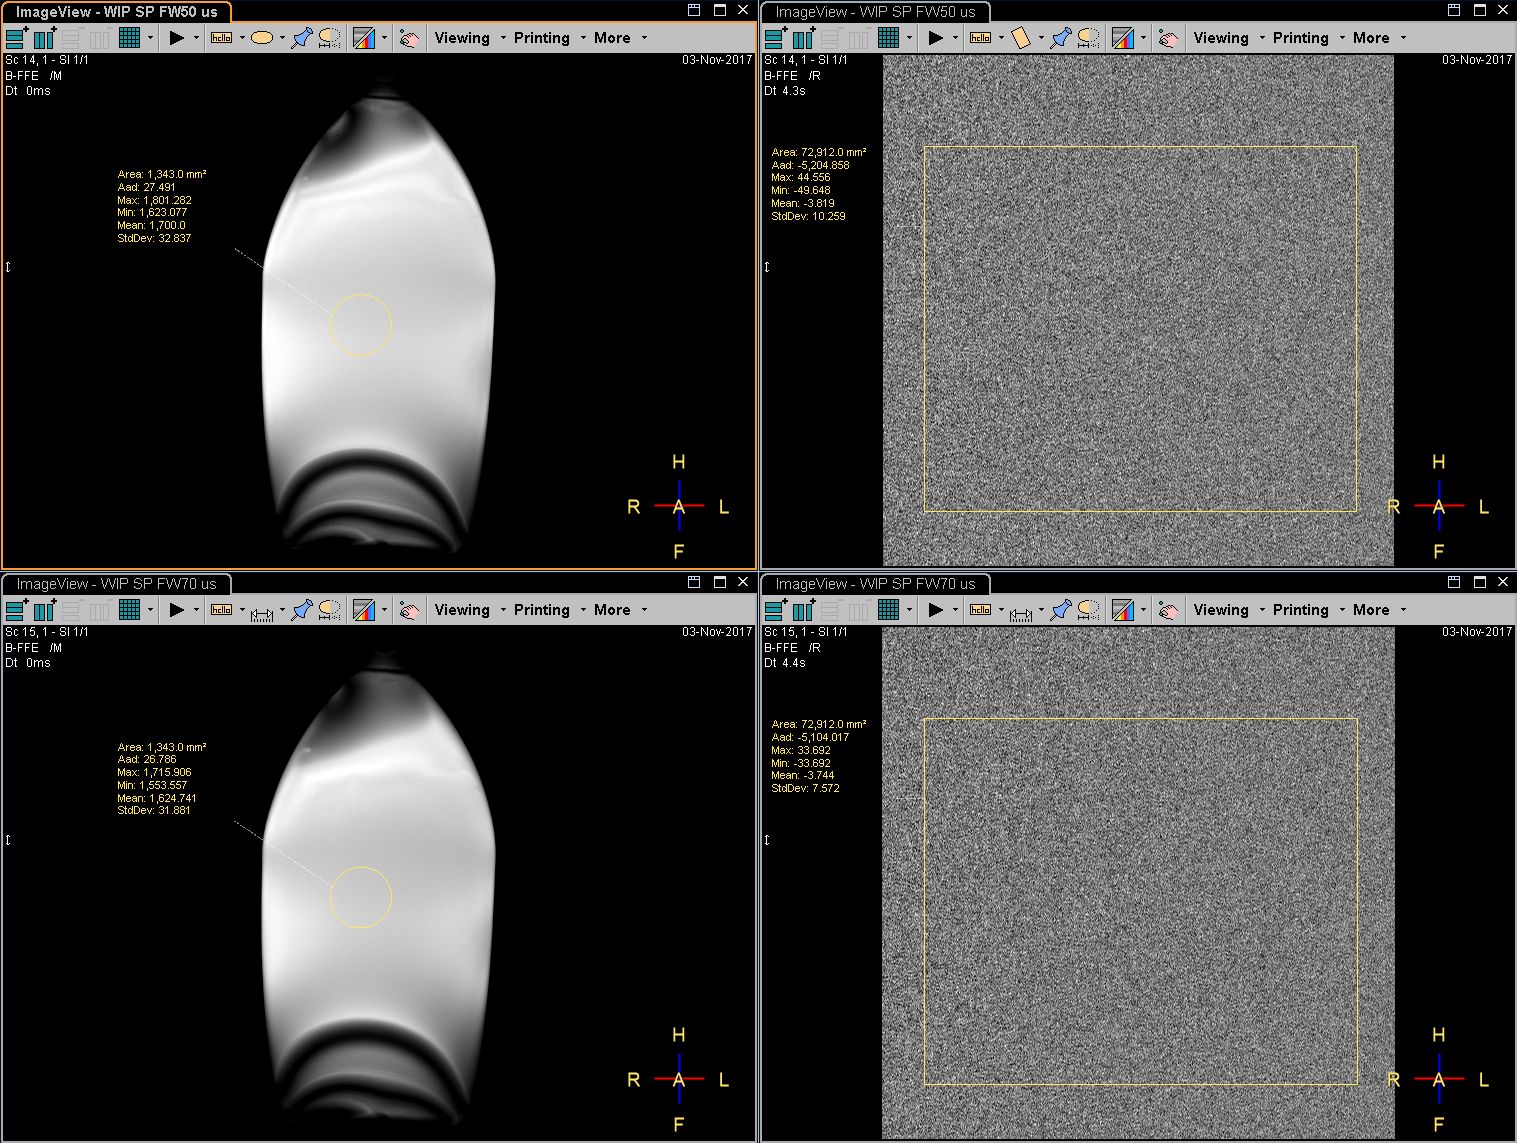
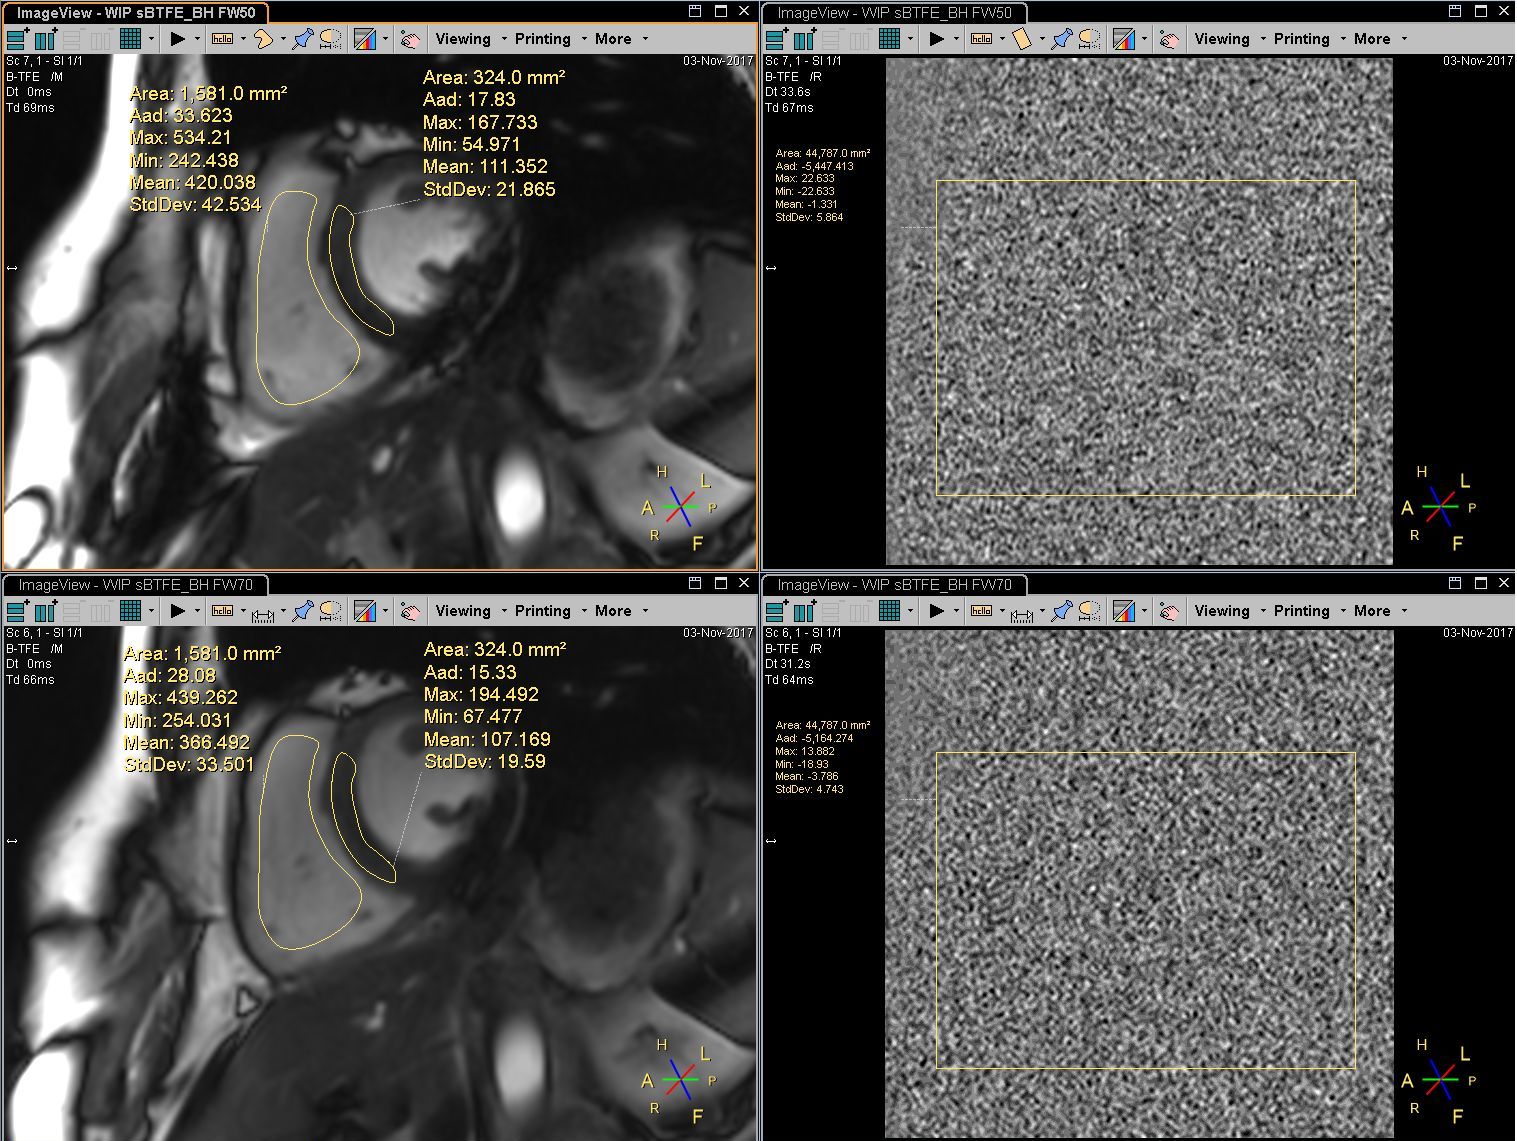
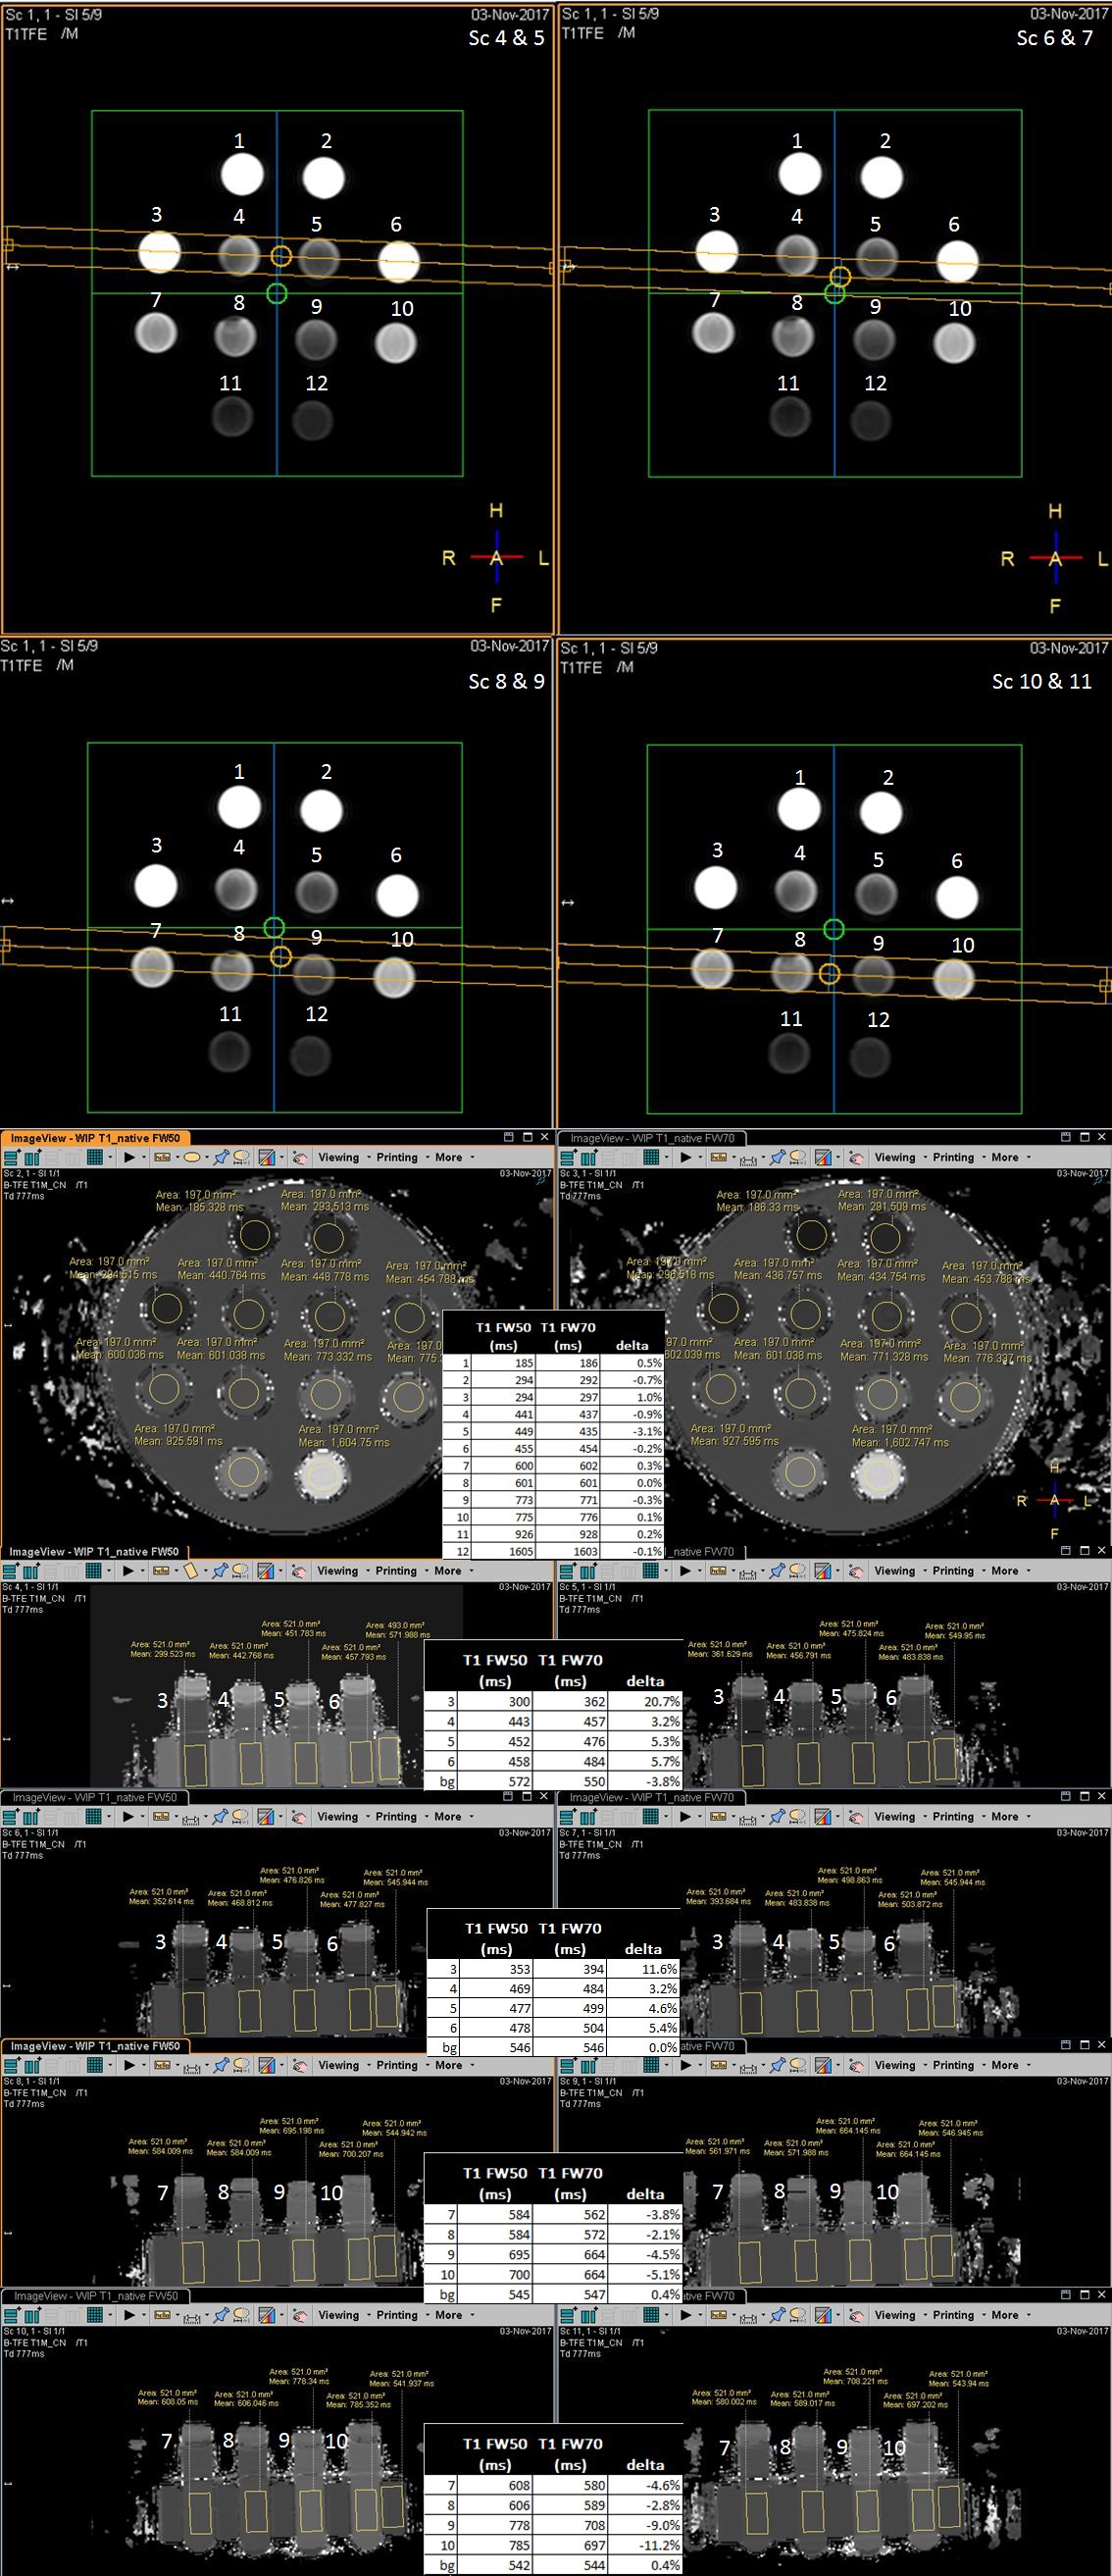
The most common definition of slice thickness is “full width at half maximum” in which the defined slice thickness corresponds to 50% of the maximum signal. Alternatively, in filter techniques the bandwidth is defined as 3dB of the maximum signal, corresponding to a slice thickness at 70% of the maximum signal. A previous study suggests that some vendors may define slice thickness according to the second method. Accordingly, we performed tests using a standard RF pulse respecting the first definition (FW50) and implemented a Gaussian pulse with σ=0.45 and time-bandwidth factor of 1.6 to mimic the alternative definition(FW70). We used a 3T Philips Ingenia system with standard dStream Head Coil for phantom experiments and anterior/posterior body coil combination for volunteer scanning in this study. To determine slice thickness we used the vendor supplied 5 liter bottle (T1/T2=200/100 ms) and for T1-mapping the Eurospin II phantom . For slice profile and SNR measurements, we used bSSFP with 20 mm slice thickness, 0.5x1.0 mm voxel size, TE/TR=3.0/6.0 ms and 45 degrees flip angle. For T1-mapping we used the consensus recommended 5s(3s)3s MOLLI sequence with bSSFP readout, TE/TR=1.0/2.2 ms and 20 degrees flip angle, in-vivo with 8 mm slice thickness but in phantom with 20 mm slice thickness allowing to use the T1-phantom as macroscopic representation of partial volume effects. As an example of clinical scanning we used a routinely used breath hold cine bSSFP with 8 mm slice thickness, TE/TR=1.48/2.9 ms and 45degrees flip angle. To assess the slice thickness and slice profile the readout gradient was aligned with the slice selection axis, using the scanner's research mode. SNR was determined according to the NEMA standard by acquiring a second dynamic scan with all gradients and RF pulses switched off.Results
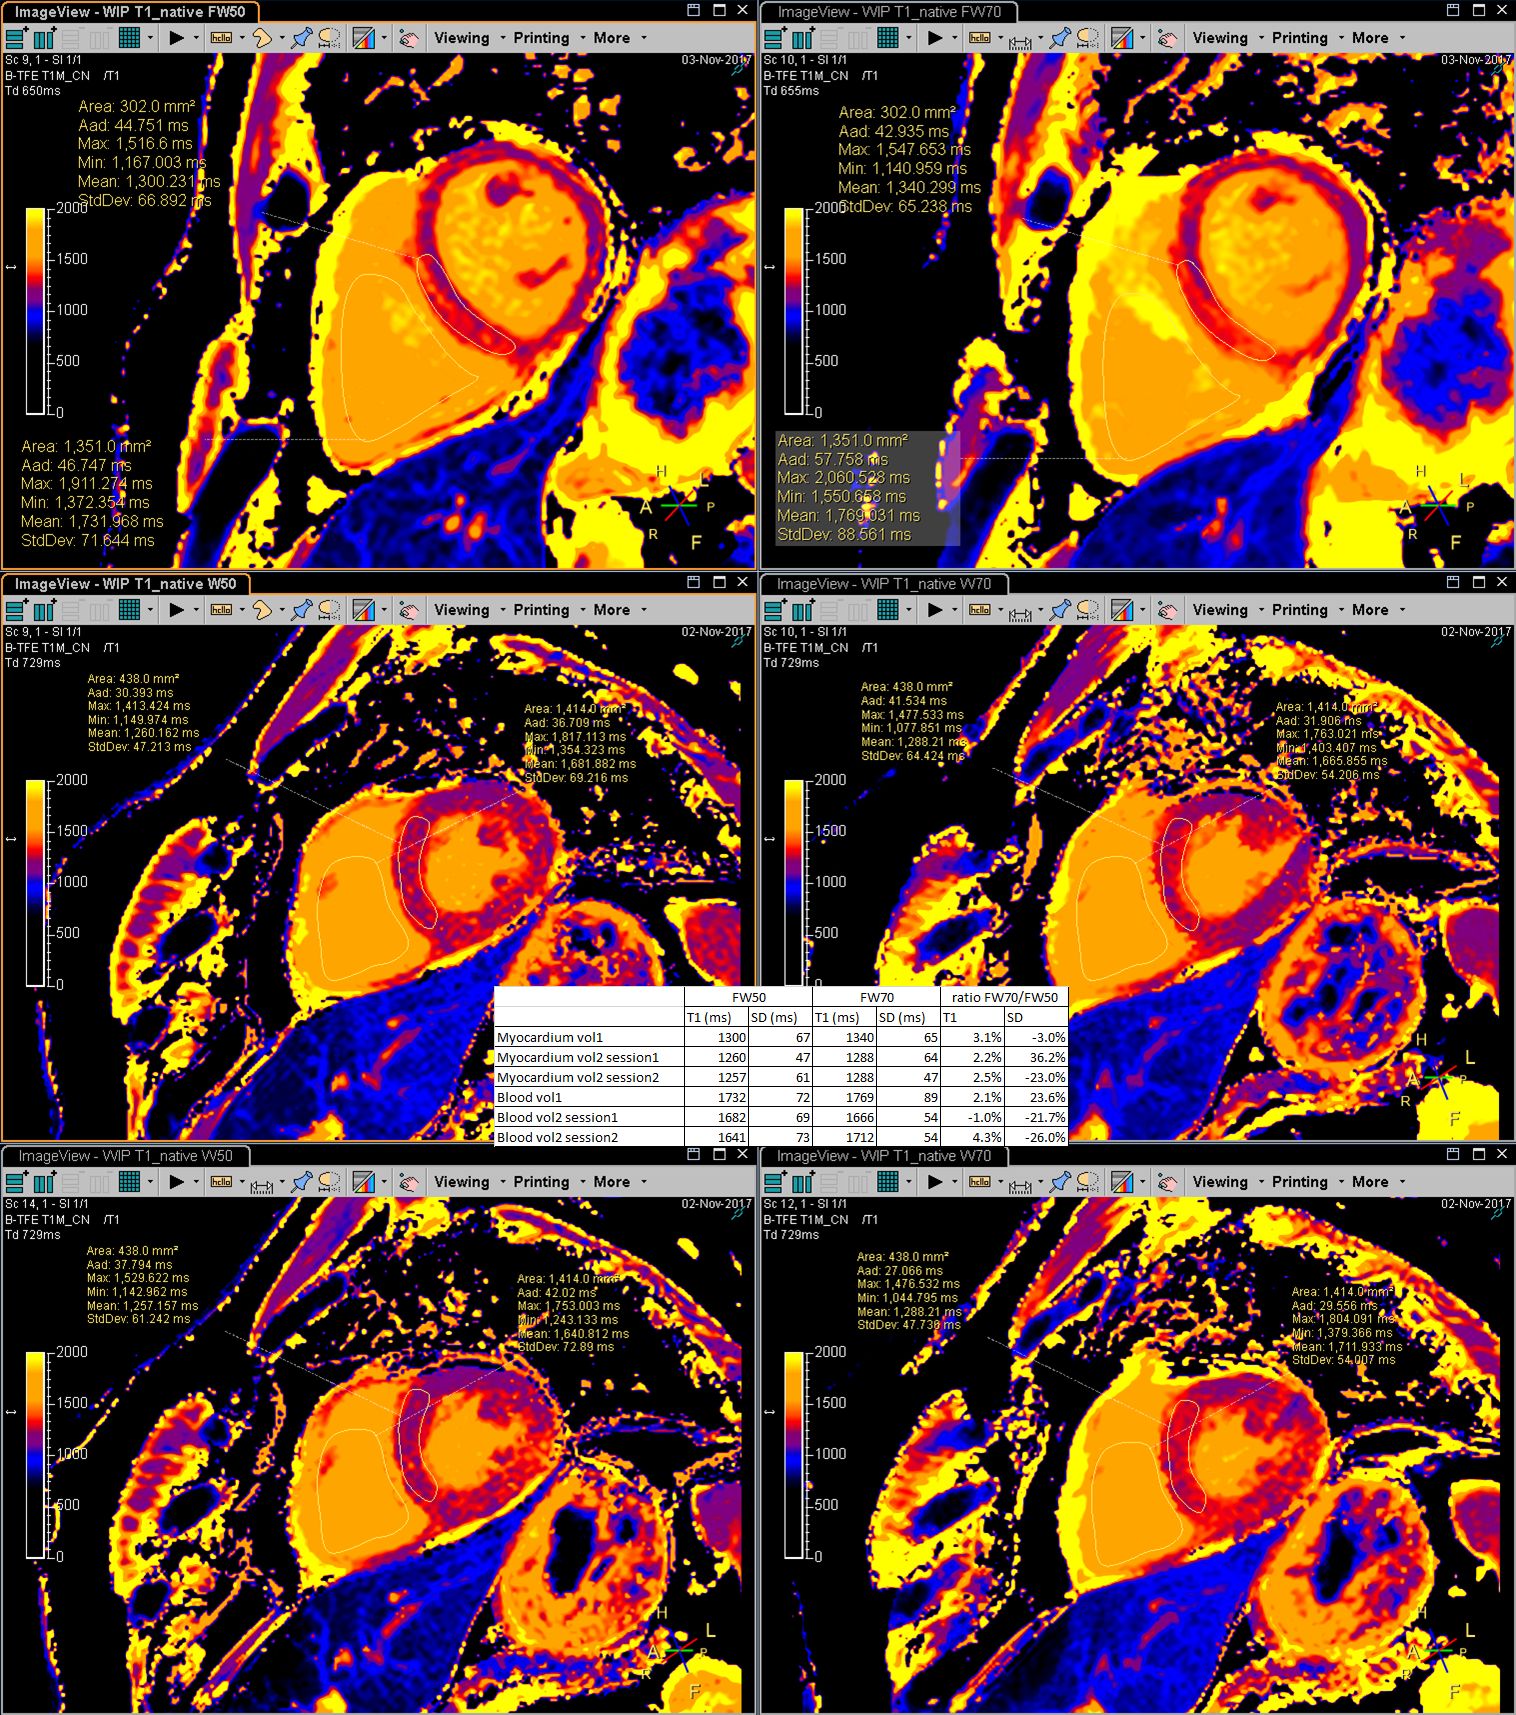
Measuring slice profiles in bSSFP confirmed correct implementation of both slice thickness definitions (fig 1). The FW70 pulse definition matched a 30% larger slice thickness according to the FW50 definition and the area under the curve was 25% larger. The phantom SNR measurement showed a 29% increase in SNR for the FW70 pulse definition (fig 2) while in the clinical cine scan the increase was 8% for blood and 19% for myocardium (fig 3). T1-mapping without partial volume resulted in almost identical T1-values for both pulses. However, in case of intentional partial volume, the T1-values differed up to 21% between both pulses (fig 4).Discussion
For sharp slice profiles, the difference between FW50 and FW70 definition is only marginal. But for Gaussian pulses, we demonstrated significant differences which are not as manifest as in-plane resolution. Poor slice profiles are often avoided because of interference with other slices in interleaved slice scans. However bSSFP requires short TR and thus slices to be acquired non-interleaved and thus can be a motivation to accept a poor slice profile. Our results show no differences in T1 in homogeneous tissue, but for focal lesions, partial volume effects between the lesion and healthy myocardium could affect the apparent size and contrast of the lesion.Conclusion
Our study confirms that an alternative slice thickness definition leads to an artificially increased SNR and affects partial volume effects in quantitative mapping techniques. The exact definition of slice thickness in 2D imaging is therefore important and deserves more attention when comparing scans from different platforms. Taking the differences in slice profile definition between vendors into account will lead to truly homogeneous protocols for multi-center trials.Acknowledgements
No acknowledgement found.References
1. Bernstein MA, King KF, Zhou ZJ. Handbook of MRI Pulse Sequences
2. Reeder SB, Herzka DA, McVeigh ER. Signal-to-Noise Ratio behavior of Steady-State Free Precession. MRM 52: 123-130 (2004)
3. NessAiver M. Measuring slice profiles across the industry with the ACR Phantom. ISMRM 2017: 4339
4. http://www.diagnosticsonar.com: Eurospin II Test System
5. Kellman P, Hansen MS. T1-mapping in the heart: accuracy and precision. JCMR 2014 16:26. http://www.nema.org: NEMA MS 1-2008 (R2014)
Figures