4518
Accuracy, repeatability, and reproducibility of longitudinal relaxation rate in twelve small-animal MR systems.1University of Manchester, Manchester, United Kingdom, 2Bioxydyn, Manchester, United Kingdom, 3Merck, West Point, PA, United States, 4Antaros, Mölndal, Sweden, 5Chalmers University of Technology, Gothenburg, Sweden, 6Sanofi-Aventis, Frankfurt-am-Main, Germany, 7Bayer, Berlin, Germany, 8GlaxoSmithKline, Stevenage, United Kingdom, 9Lund University, Lund, Sweden, 10Bruker, Ettlingen, Germany, 11Abbvie, North Chicago, IL, United States, 12University of Leeds, Leeds, United Kingdom, 13Radboud university medical center, Nijmegen, Netherlands
Synopsis
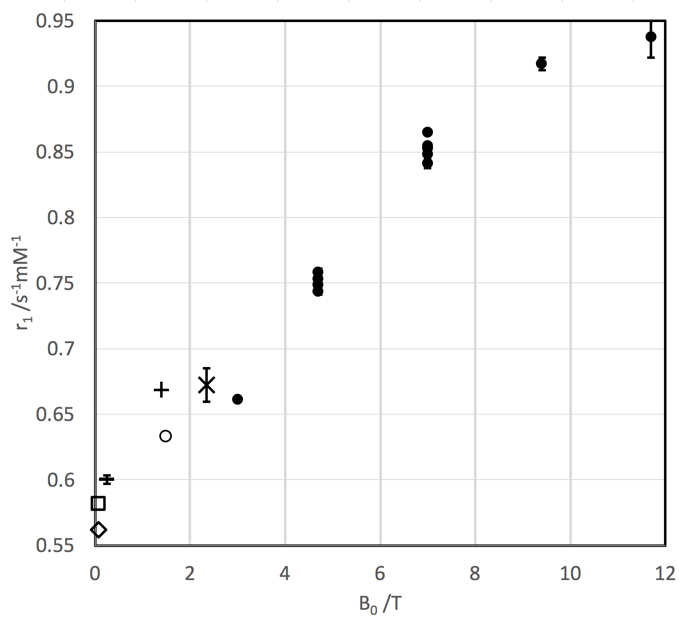
Many translational MR biomarkers derive from measurements of R1, but evidence for between-site reproducibility of R1 in small-animal MRI is lacking. Here R1 was measured by saturation-recovery in 2% agarose phantoms with five NiCl2 concentrations in 12 magnets at 5 field strengths in 11 centres on two different occasions within 1-13 days. R1 was analysed in three different regions of interest, giving 360 measurements in total. Root-mean-square repeatability and reproducibility coefficients of variation were calculated. Day-to-day repeatability was 2.3%. Between-centre reproducibility was 1.4%. Ni2+ relaxivity in 2% agarose was 0.66s-1mM-1 at 3T and 0.94s-1mM-1 at 11.7T.
INTRODUCTION
Lack of standardisation in preclinical imaging could invalidate findings from animal studies, or confound meta-analyses and translation. Many translational MR biomarkers derive from measurements of R1, but evidence for between-site reproducibility of R1 in small-animal MRI is lacking. This study was performed within a drug safety imaging biomarkers consortium (www.imi-tristan.eu) developing reliable preclinical MR assays which would give comparable results in different laboratories. The aim was to assess the repeatability and reproducibility of R1 in a realistic rodent MR protocol. Repeatability refers to the similarity between measurements over a short interval made using the same test object in the same equipment operated by the same investigator. Repeatability is particularly important when the same MR biomarker is measured on successive occasions in the same subject, e.g. before and after treatment. Repeatability depends on SNR and factors such as motion artefact, for which phantoms do not model in vivo studies. Reproducibility refers to the similarity between measurements made using test objects in different equipment operated by different investigators. Reproducibility is particularly important when an MR biomarker is measured once in each individual, for example in assessing adverse effects of drugs or making a treatment decision in personalised healthcare.METHODS
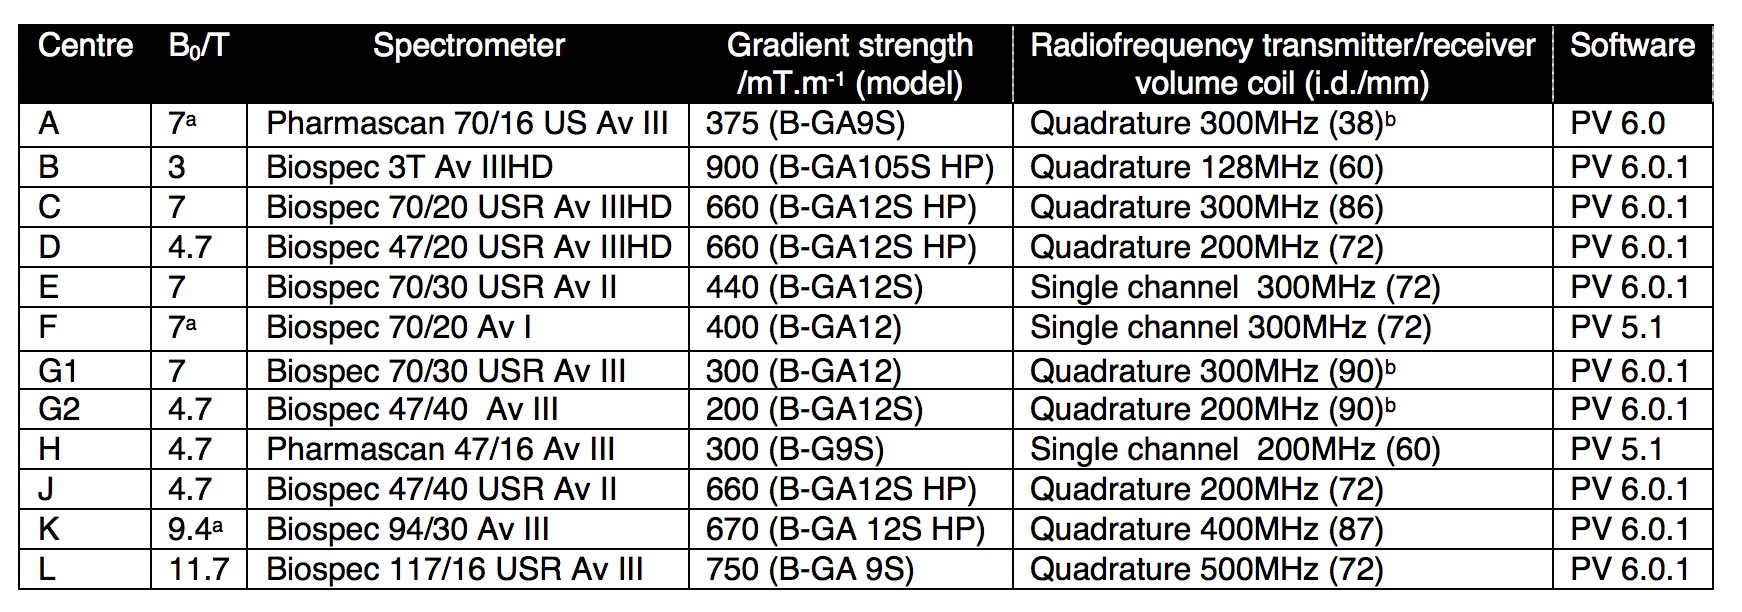
2% NiCl2 agarose phantoms (0.5,1,2,4,8mM) were prepared centrally. Eleven centres participated, with 12 Bruker Avance/ParaVision MR systems (Table 1). In order to simulate "real-world" reproducibility, no site training was performed, no quality control was imposed, nor were sites permitted to repeat measurements to eliminate apparent outliers. Region-of-Interest (RoI) definition and T1 calculation were performed locally. R1 was measured by saturation recovery using a standard RARE sequence (coronal, 58×58 mm field of view, 128×128 matrix, π/2 for 1.16 mm slice selection followed by π train RARE factor 8, effective echo time 30ms, echo spacing 7.5ms, TR 5500,2000,1200,750,500,300,200,100ms), no signal averaging, 5 dummy scans. The protocol was run in each centre twice, mean 2.7 days apart (range 1-13). Each centre conducted measurements independently and was blinded to findings from other centres until their own results had been submitted. At each centre, T1 values were obtained using a 2-parameter fit in ParaVision (Bruker) from 25 mm2 RoIs at three positions: isocentre; 10mm radially; 12-20 mm axially, denoted (X, Y, Z) = (0,0,0), (10,0,0), (0,0,12). The resulting T1 and SD of fit were submitted to the core lab where rms within-centre R1 repeatabilities and between-centre reproducibilities were calculated using absolute units (SD s-1), and coefficients of variation (CoV%). Post-hoc tests of significance were made for “effect of day” using Student’s t-test, and for “effect of RoI position” by analysis of variance. No correction for multiple comparisons was made but p<0.01 was considered significant. For each centre, weighted mean R1 values were calculated for each phantom, and used to obtain relaxivities by linear regression.RESULTS
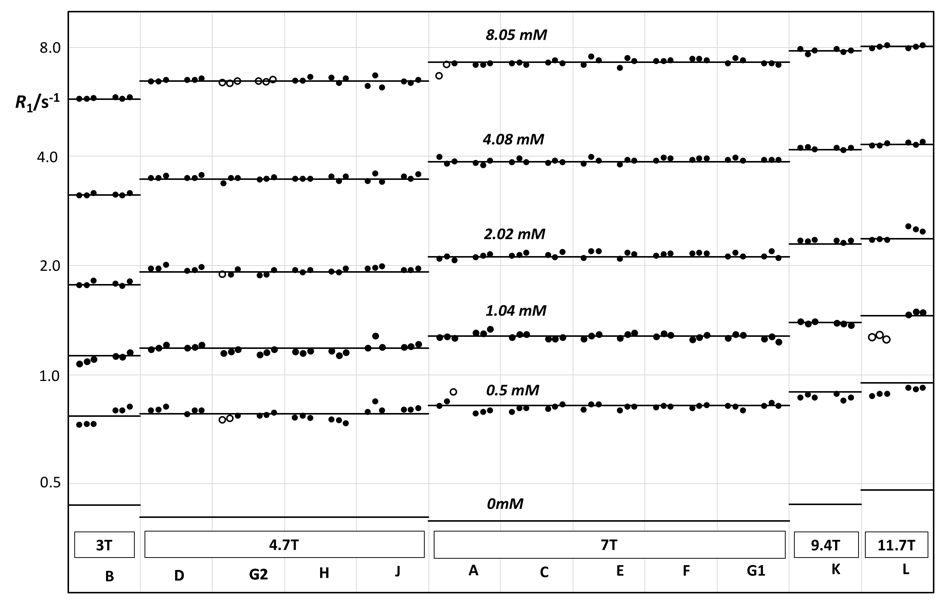
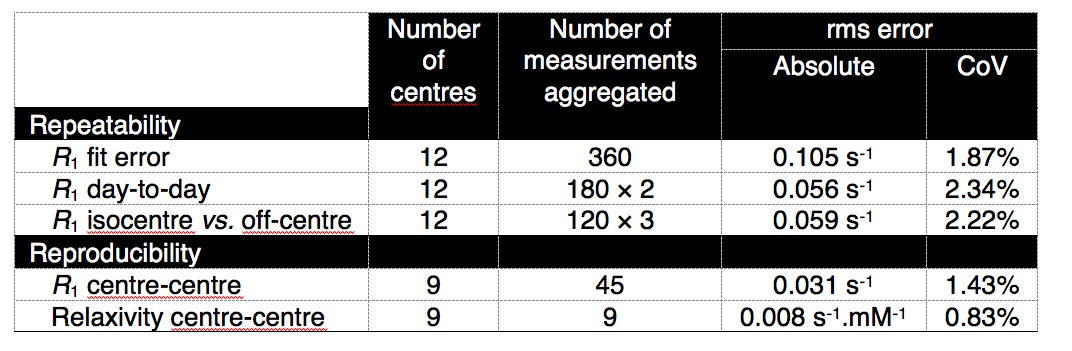
Figure 1 shows individual R1 data. Figure 2 shows field dependence of relaxivity. Table 2 shows repeatability and reproducibility.
Day-to-day repeatability ranged from 0.025 s-1 (centre D) to 0.097 s-1 (centre A): day-to-day repeatability CoV ranged from 0.76% (centre F) to 5.48% (centre L). Exploratory analysis provided no evidence that day-to-day repeatability was improved either if measurements were restricted to the isocentre, or if measurements with >1°C difference in temperature between day 1 and day 2 were excluded. No evidence was seen for field dependence of repeatability. For day-to-day repeatability, 2 centres (B, L) showed a statistically significant effect of day, and 4 centres (D, E, G2, K) showed a statistically significant effect of RoI position.
Between-centre reproducibility of R1 was measured for the 5 phantoms at both 4.7 T and 7 T. Least reproducible, on a CoV basis, was the 0.5mM phantom at 4.7 T (2.94%, N=4 centres) or, on an absolute units basis, the 8mM phantom at 7 T (0.066 s-1, N=5 centres).
A measure of the linearity of R1 as a biomarker over the range 0.8-8 s-1 was obtained from the relaxivity equation: the rms standard error of r1 was 0.68% (range 0.2%-1.7%, N=12 centres).
DISCUSSION
No phantom study can fully model the in vivo measurement. Nevertheless, a well-designed phantom study sets a lower limit on the error to be expected from measurements in living animals. We achieved R1 reproducibility (and repeatability) of <0.06 s-1 and <2.4%, with the limitation that only one vendor’s equipment and one pulse sequence were used. These small instrumentation-derived errors in R1 measurement mostly would not contribute biologically significant errors to R1-based MR biomarkers.Acknowledgements
Acknowledgements: The research leading to these results received funding from the Innovative Medicines Initiatives 2 Joint Undertaking under grant agreement No 116106 (IB4SD-TRISTAN). This Joint Undertaking receives support from the European Union’s Horizon 2020 research and innovation programme and EFPIA. This work was also supported by the CRUK and EPSRC Cancer Imaging Centre in Cambridge and Manchester funding to The University of Manchester (grant C8742/A18097). The MRI scanner at the University of Manchester is supported by the UK BBSRC (BB/F011350/1). Disclosures: CG, GS and SZ are employees of Bayer AG, a for-profit company providing MR contrast agents. PDH is an employee at Antaros Medical, a for-profit company providing MR biomarker services. SK and KS are employees of Bruker BioSpin MRI GmbH, a for-profit company which is the manufacturer of the MR systems used in the study. JCW receives compensation from Bioxydyn Ltd, a for-profit company providing MR biomarker services. Also disclosed at ISMRM British Chapter 2018-09-27.References
1.Captur G, Gatehouse P, Keenan KE, et al. A medical device-grade T1 and ECV phantom for global T1 mapping quality assurance - the T1 Mapping and ECV Standardization in cardiovascular magnetic resonance (T1MES) program. J Cardiovasc Magn Reson 2016;18:1–20.
2.Christoffersson JO, Olsson LE, Sjöberg S. Nickel-Doped Agarose Gel Phantoms in MR Imaging. Acta Radiol 1991;32:426–31.
3.Kraft KA, Fatouros PP, Clarke GD, Kishore PRS. An MRI phantom material for quantitative relaxometry. Magn Reson Med 1987;5:555–62.
4.Howe FA. Relaxation times in paramagnetically doped agarose gels as a function of temperature and ion concentration. Magn Reson Imaging 1988;6:263–70.
Figures