4513
Multiparametric evaluation of geometric distortions in stereotactic MR imaging at 1.5 and 3 Tesla with a plexiglass phantom: towards practical recommendations for clinical imaging protocols1Institut du Cerveau et de la Moelle épinière, ICM, Inserm U 1127, CNRS UMR 7225, Sorbonne Université, F-75013, Paris, France, 2Centre de Neuro-Imagerie de Recherche, CENIR, Paris, France, 3Department of Radiotherapy, Medical Physics Unit, AP-HP Pitié-Salpêtrière Hospital, Paris, France, 4Department of Neuroradiology, AP-HP Pitié-Salpêtrière Hospital, Paris, France, 5Department of Neurosurgery, AP-HP Pitié-Salpêtrière Hospital, Paris, France
Synopsis
Accurate MRI-based targeting is a critical issue for stereotactic surgery. Therefore, geometric distortions need to be evaluated for any pre-operative MR imaging protocol. In this study, we investigated MRI protocols used in Deep Brain Stimulation and Gamma Knife radiosurgery, and focused on the influence of 5 factors on the geometric distortions, at 1.5T and 3T, for 3D T1-weighted and 3D FLAIR images. We found that in order to minimize geometric distortions in stereotactic imaging operator training, careful centering in the MR scanner and systematic activation of constructor’s distortion correction filter are essentials.
Introduction
Stereotactic surgery is a well-established treatment approach for both Deep Brain Stimulation (DBS) and Gamma Knife (GK) radiosurgery. For these procedures, accurate MRI-based targeting is a critical issue with a need of producing distortion-free images. Thus, evaluation of geometric distortions in clinical MRI systems is crucial. Geometric distortions can be induced by the magnet itself, by a particular sequence or by the patient. These distortions depend on a number of factors, many of which have been studied in the literature [1]. Nevertheless, for stereotactic imaging protocols, some questions remained to be explored. The aim of our study was to analyze a group of sources of geometric distortion in order to propose guidelines for good MRI practices for pre-operative image acquisitions.
Material and methods
We focused on 3D images used for targeting at 1.5T and 3T (FSPGR on a 1.5T GE Optima ; MP2RAGE, FLAIR, and SPACE on a 3T Siemens SKYRA ), using a geometric phantom (GRID 3D, MODUS QA: rectilinear grid of 2002 points). For FSPGR, MP2RAGE, FLAIR and SPACE acquisitions, resolutions were 0.94 x 0.94 x 1.2 mm3, 1 x 1 x 1 mm3, 0.48 x 0.48 x 1 mm3, 0.94 x 0.94 x 1 mm3 respectively. We assessed the influence of five factors: 1) operator-induced distortions by studying inter- and intra-operator variations, 2) position of the magnet isocenter (laser position) with respect to the phantom, 3) distortion-correction filter available in the MR systems (and coupled effect of the laser positioning and correction filter), 4) frame-induced distortions, 5) susceptibility-based geometric distortions by acquiring pairs of images (inverting the phase-encoding direction).
An in-house Python-based module was implemented in 3D Slicer [2] for the automatic assessment of geometric distortions. All phantom images were preprocessed by cropping, denoising [3] and resampling to 0.5-mm3 voxels. Detection of the intersections was performed by normalized cross-correlation of the image with a 3D-cross kernel. Residual tilt was removed. The distortion field was computed as the differences between theoretical and measured points.
Results
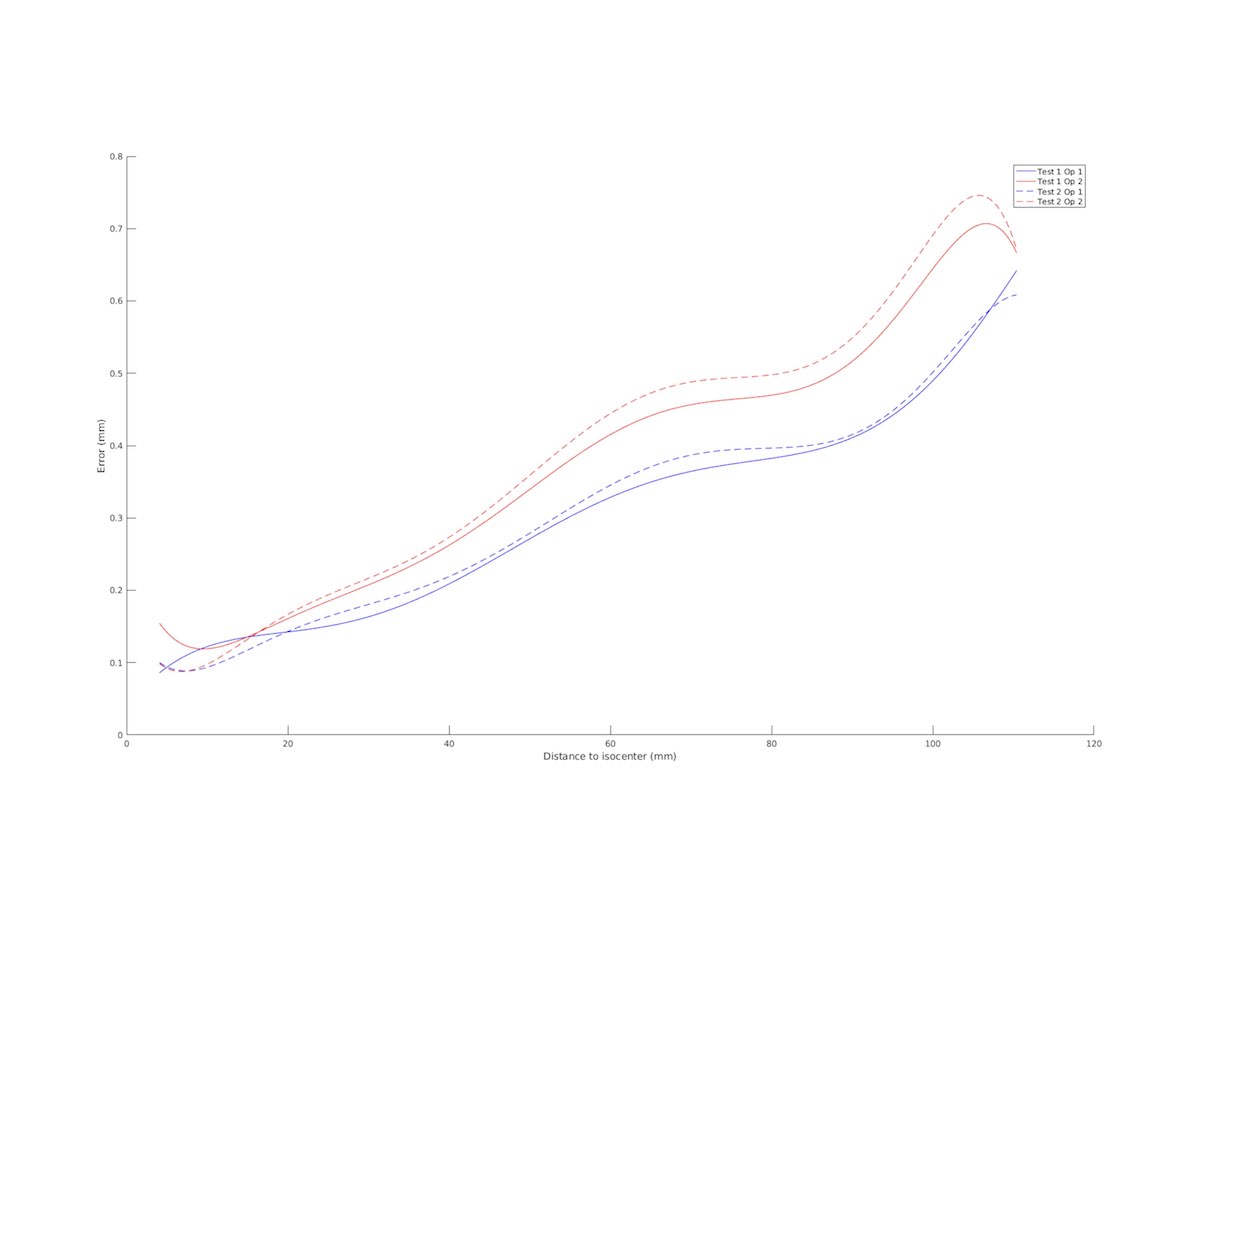
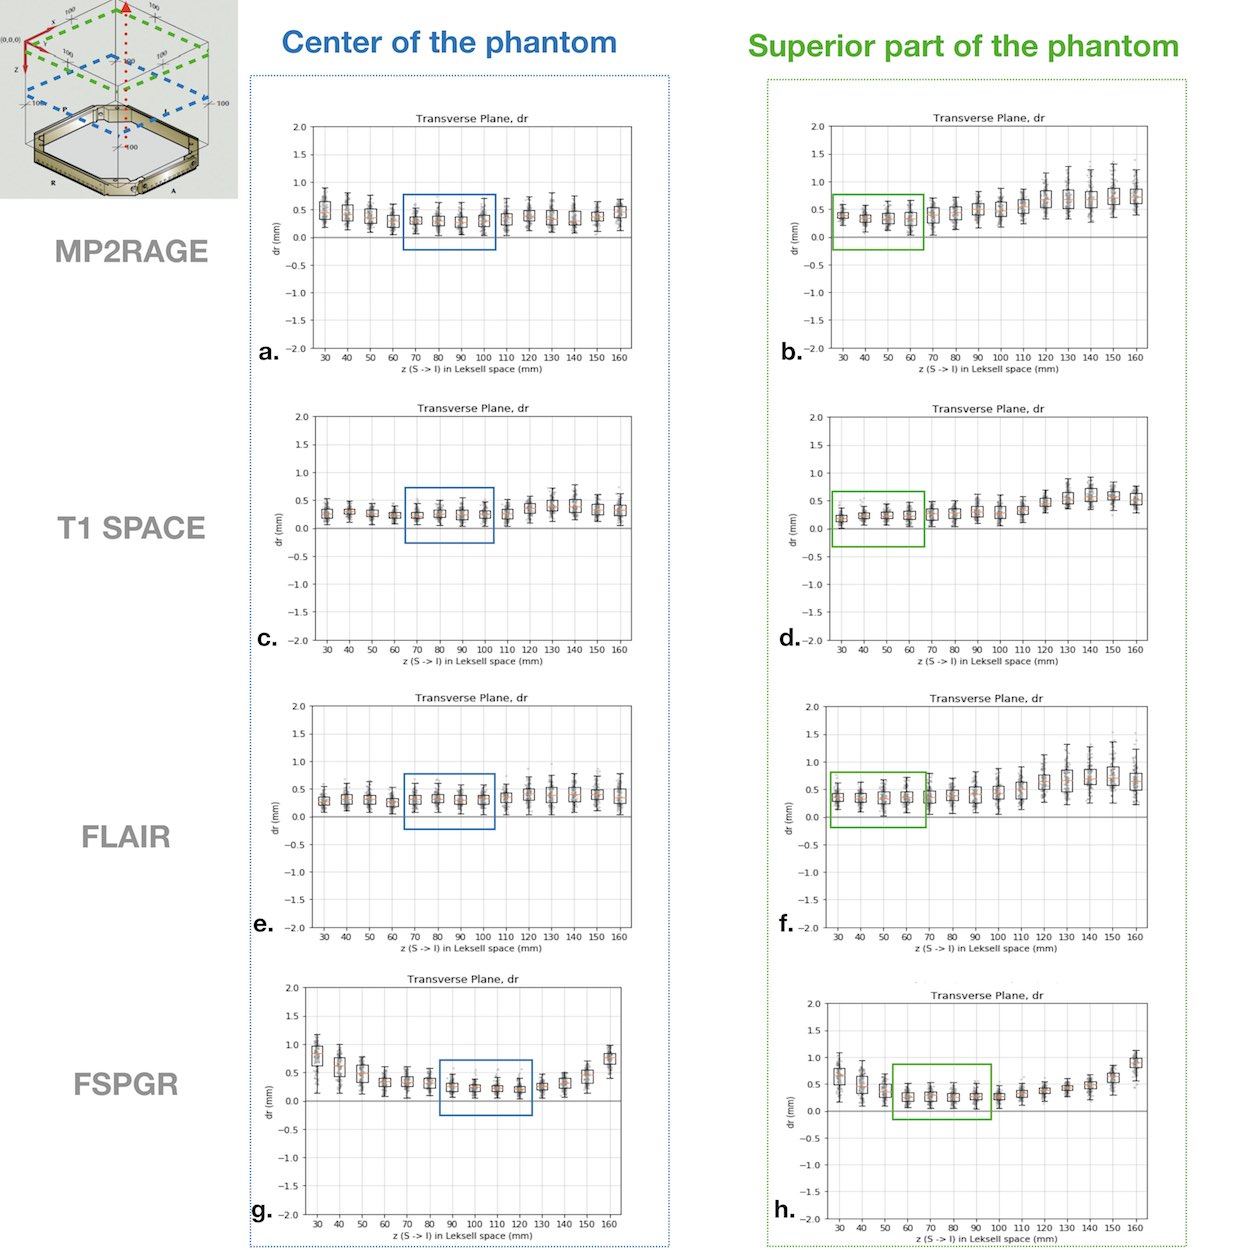
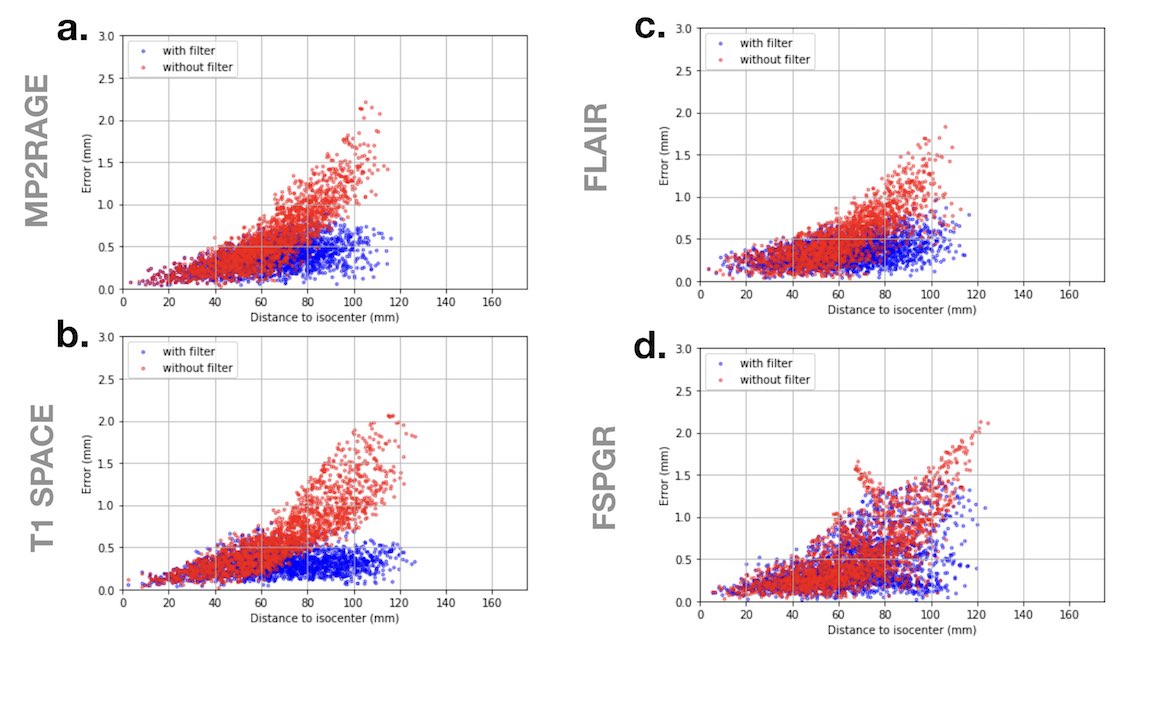
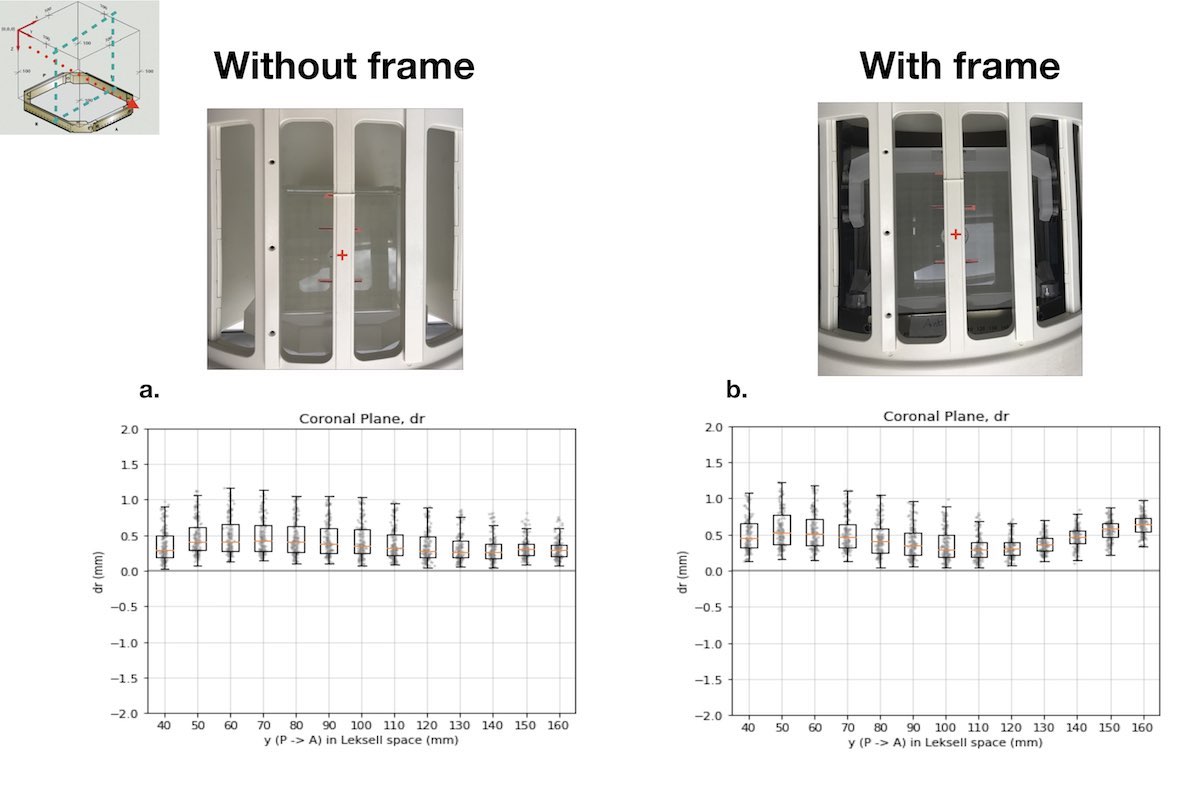
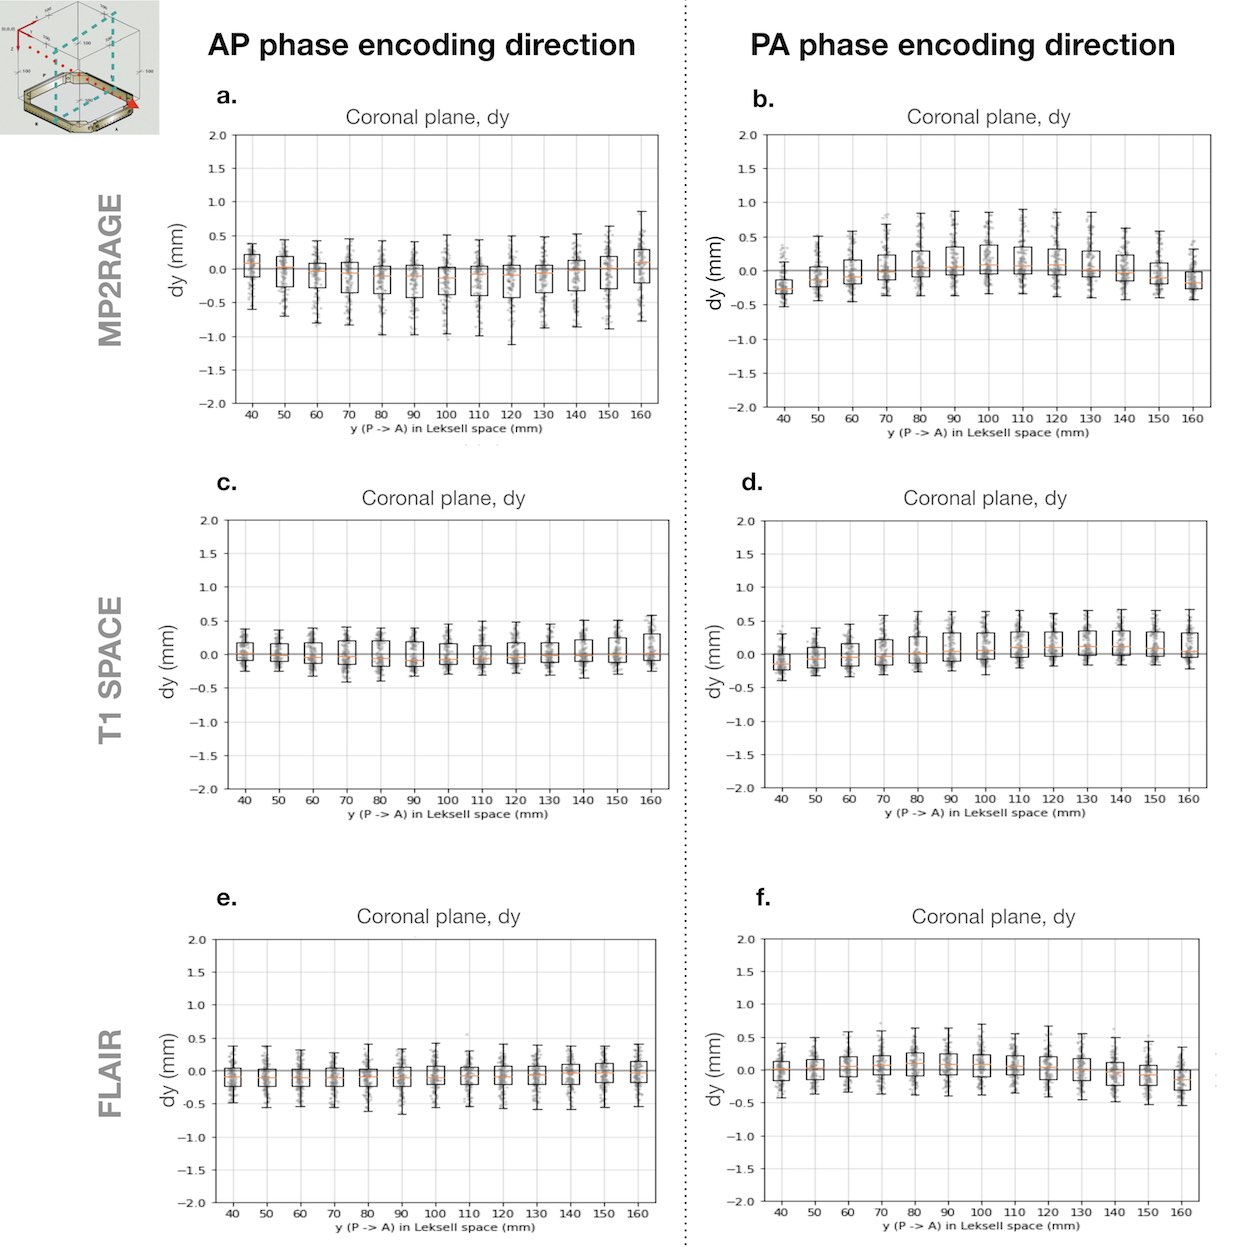
More than 95 % of the grid vertices were detected in all acquisitions.For inter- and intra-operator analysis the mean distortions of the two acquisitions were respectively 0.28 and 0.30 mm for the first operator, and 0.35 and 0.39 mm for the second one (Figure 1). Mean distortions in MP2RAGE, T1 SPACE, FLAIR and FSPGR acquisitions were respectively, 0.36, 0.30, 0.32 and 0.39 mm with laser positioning on the phantom center, while positioning on the superior part of the phantom yielded mean distortions of 0.45, 0.36, 0.44 and 0.42 mm respectively (Figure 2). Mean total distortions with and without distortion filter were 0.36 and 0.51 mm for MP2RAGE, 0.28 and 0.53 mm for T1 SPACE, 0.31 and 0.45 mm for FLAIR, and 0.32 and 0.42 mm for FSPGR (Figure 3). Coupled effect of the laser positioning and correction filter gave the following results: when the isocenter was on the center of the phantom, mean distortions without and with filter were 0.59 and 0.36 mm for MP2RAGE, 0.62 and 0.30 mm for T1 SPACE, and 0.52 and 0.32 mm for FLAIR, respectively. For the superior position of the isocenter, mean distortions were 1.06 and 0.45 mm for MP2RAGE, 0.77 and 0.36 mm for T1 SPACE, 0.98 and 0.44 mm for FLAIR, respectively. Mean distortions of acquisitions with and without frame on FSPGR sequences were 0.46 and 0.40 mm (Figure 4). Mean distortions for anterior-posterior (AP) and posterior-anterior (PA) frequency-encoded images were 0.37 and 0.35 mm for MP2RAGE, 0.30 and 0.34 mm for T1 SPACE, and 0.33 and 0.32 mm for FLAIR, respectively (Figure 5).Discussion
Our results show good inter- and intra-operator reproducibility on fitted distortions curves for well-trained operators. Moreover, we observed that laser positions influence the distortion values and constructor’s filters help to reduce the distortions. We also observed very similar average geometric distortions at 1.5T and 3T while aiming for the same laser positioning and activating the distortion-correction filter.Conclusion
In order to minimize geometric distortions in stereotactic imaging, simple recommendations should be followed: careful centering in the MR scanner with respect to the area under study and systematic activation of constructor’s distortion correction filter. Thus, it is important to carefully train the operators on the MRI practices for pre-operative acquisitions in stereotactic surgery. With respect to above recommendations, we suggest the possibility of low distortions and optimal stereotactic imaging using 3T MRI scanners.Acknowledgements
This study was partially supported by GE Healthcare.
The authors acknowledge the financial support provided by the Fondation pour la Recherche Médicale (FRM) (Project:DIC20161236441) and by the "Investissements d’avenir" ANR-10-IAIHU-06.
References
[1] Weygand et al. , International Journal of Radiation Oncology, 95.4 1304-1316, 2016
[2] Fedorov, Andriy et al. Magnetic resonance imaging, 30.9, 1323–1341, 2012
[3] Mirebeau, Jean-Marie et al. arXiv: 1503.00992., 2015
Figures