4512
Cross-vendor spiral gradient calibration using TOPPE and Pulseq1University of Michigan, Ann Arbor, MI, United States, 2Columbia University, New York, NY, United States
Synopsis
Spiral imaging is fast and SNR-efficient, but is relatively sensitive to gradient system imperfections. Unfortunately, these imperfections are generally not known, and can furthermore be expected to vary across different scanner vendor platforms. This complicates multi-site, multi-vendor studies that can benefit from rapid spiral imaging, e.g., those involving fMRI. Here we demonstrate that it is in fact possible to characterize and directly compare spiral gradient performance across two major vendors (GE and Siemens), using the TOPPE and Pulseq frameworks for rapid pulse sequence prototyping. Our observations indicate that B0 eddy currents are substantial on both vendor platforms, and underscore the need for measuring and correcting for B0 effects in spiral imaging.
INTRODUCTION
TOPPE [1,2] and Pulseq [3] are two recently-introduced frameworks for rapid pulse sequence prototyping on General Electric and Siemens scanners, respectively. Each of these frameworks defines its own vendor-independent file format that describes all details of an MR imaging experiment, and that is loaded (“interpreted”) and executed on the scanner by a universal binary driver. Importantly, TOPPE and Pulseq file formats can be converted from one to the other, which should make it possible to – for the first time – fully harmonize pulse sequences across vendors. This should have important implications for, e.g., multi-site and multi-vendor resting-state functional MRI (fMRI) studies. However, even if the pulse sequences can be harmonized there may still be system-related factors (e.g., gradient system performance) that can impact the quality of functional connectivity maps.
Here we leverage TOPPE and Pulseq to assess the quality of a spiral-in readout on two scanners at different institutions: a GE Discovery MR750 3T scanner and a Siemens 3T Prisma. Spiral-in readouts are well-suited for fast BOLD fMRI imaging but can produce blurring or other artifacts if gradient imperfections are not accounted for. Unfortunately, such imperfections are generally not known, and can furthermore vary depending on a vendor’s eddy current pre-compensation method. In this study, we perform “pencil-beam” measurements [4] to measure the spiral readout k-space trajectory as well as the temporally varying (but spatially invariant) B0 eddy currents on two different vendor platforms. To our knowledge, this is the first time that the gradient performance on scanners from different vendors is directly compared in this way.
METHODS
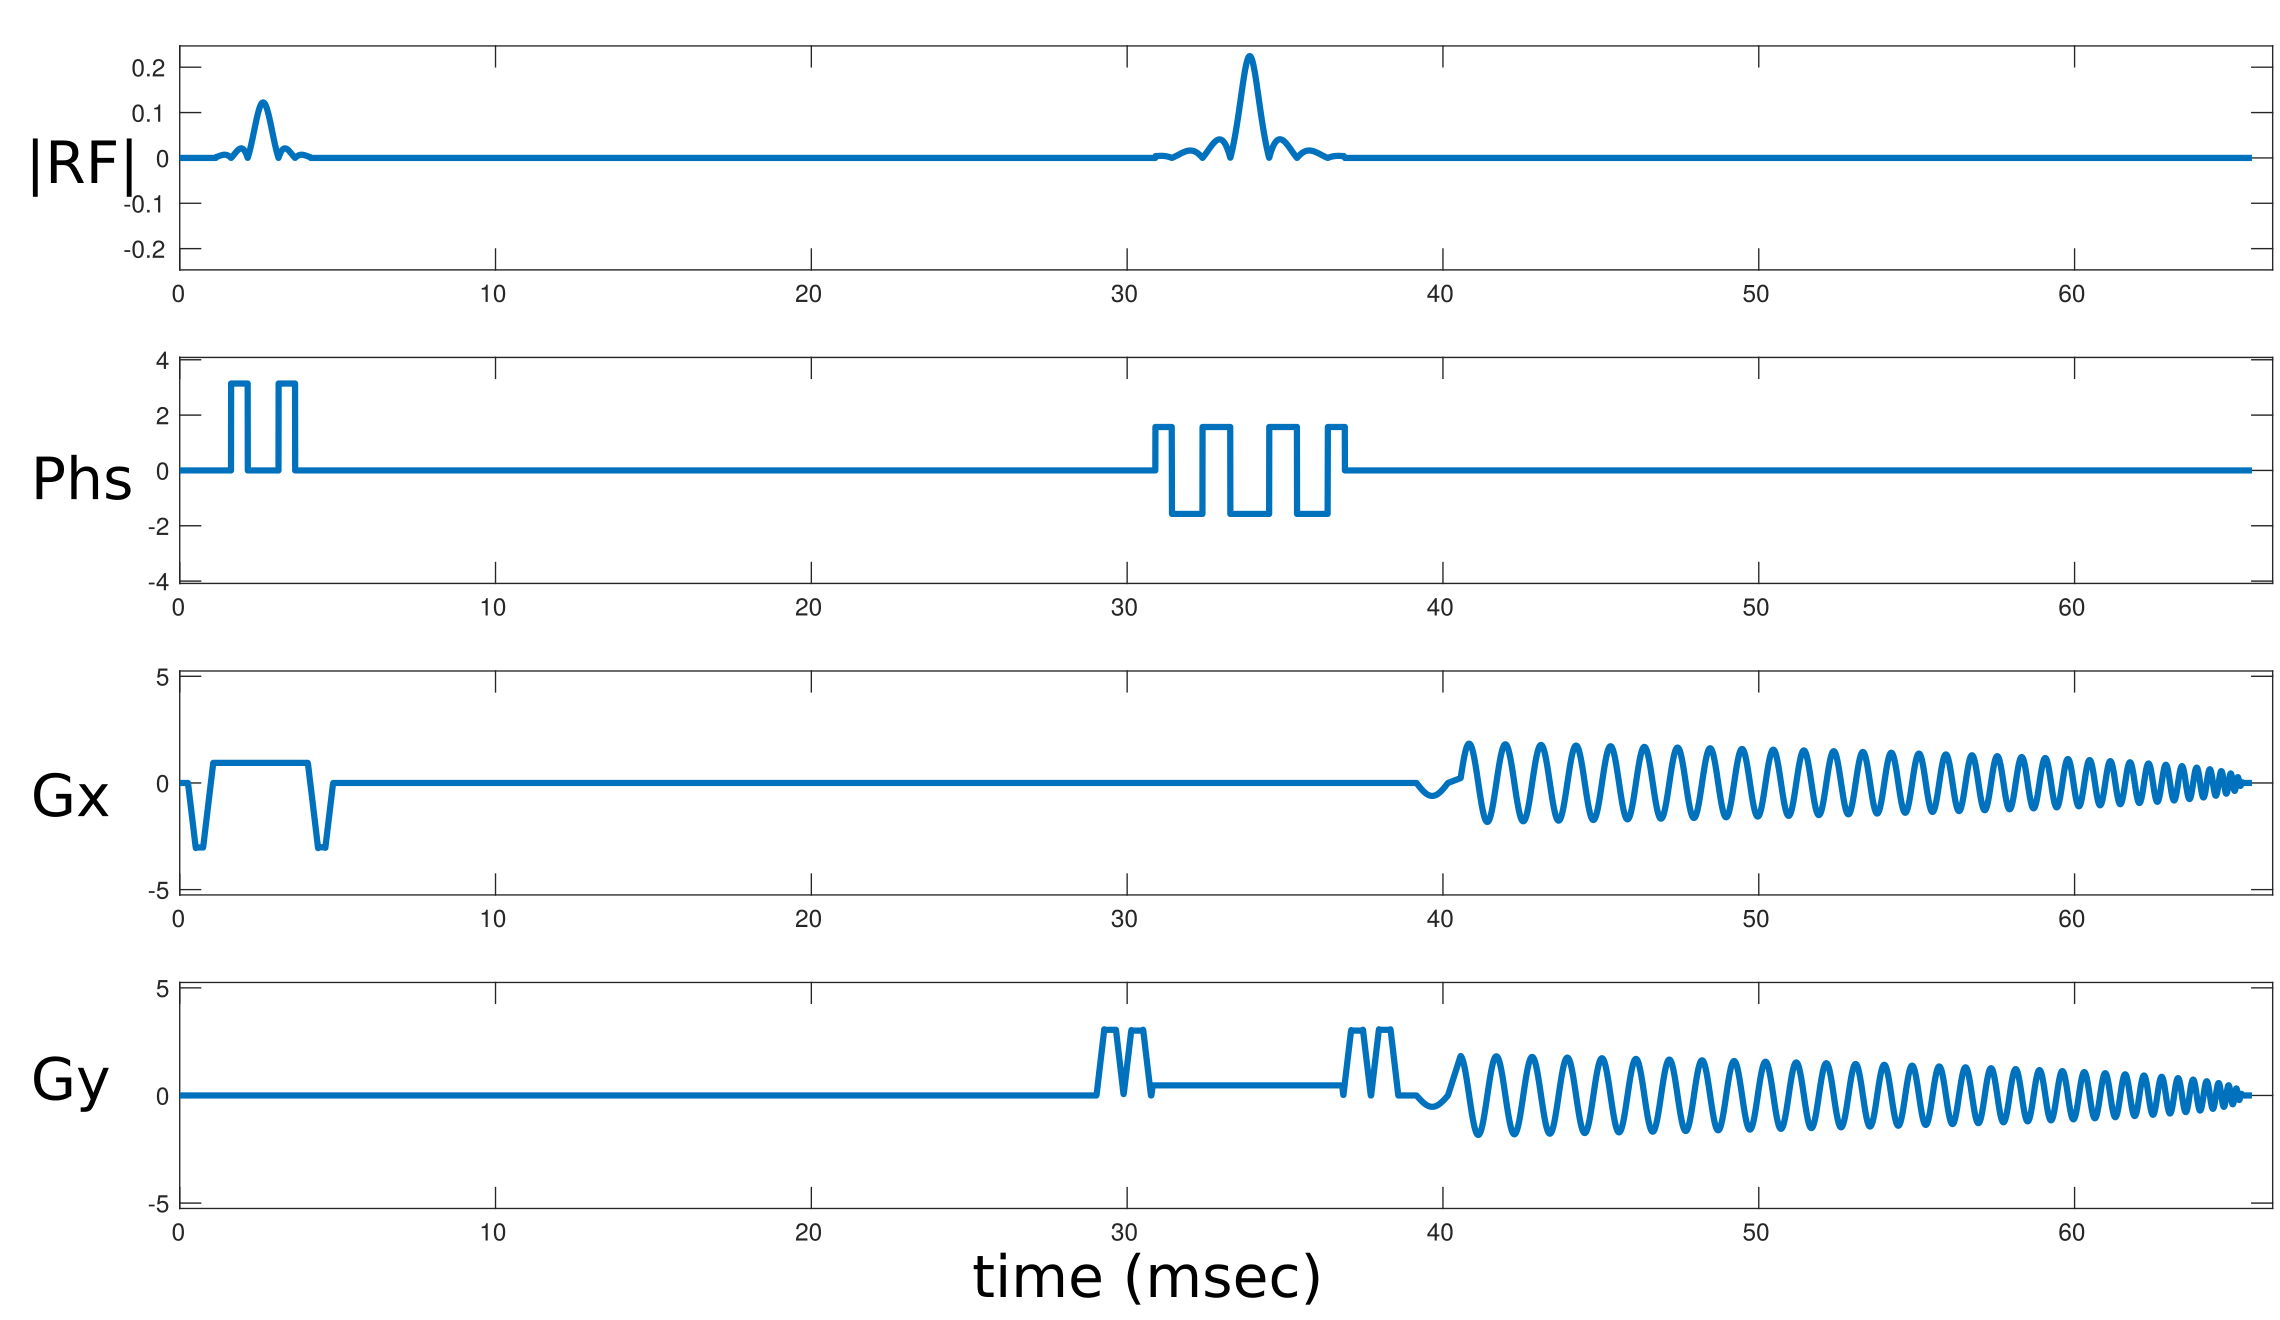
Figure 1 shows the pencil-beam sequence consisting of a 90o vertical slice excitation followed by a (perpendicular) slice-selective 180o refocusing pulse and the 26 ms spiral-in gradient waveform we wanted to measure. The resulting square beam had a width of 5 mm, suitable for measuring k-space values up to about 2 cycles/cm. Pencil-beams were excited sequentially at the corners of a 4 cm wide square in a uniform Agar ball (FBIRN) phantom at both sites. For each pencil-beam FID, we subtracted the phase from a separate reference acquisition without any gradients (to correct for off-resonance and other sources of phase). We discarded the first 8 ms of each FID due to low SNR. Combining the resulting FID signals produced measured k-space trajectory (kx and ky) and B0 offset. We did not smooth the resulting kx, ky, and B0 waveforms; however, we did offset them by a constant value so that each waveform ended at zero. We designed the pencil-beam sequence using the TOPPE Matlab toolbox [3], then converted it to a Pulseq file using the Matlab script ‘ge2seq.m’, also available in the TOPPE Matlab toolbox.RESULTS
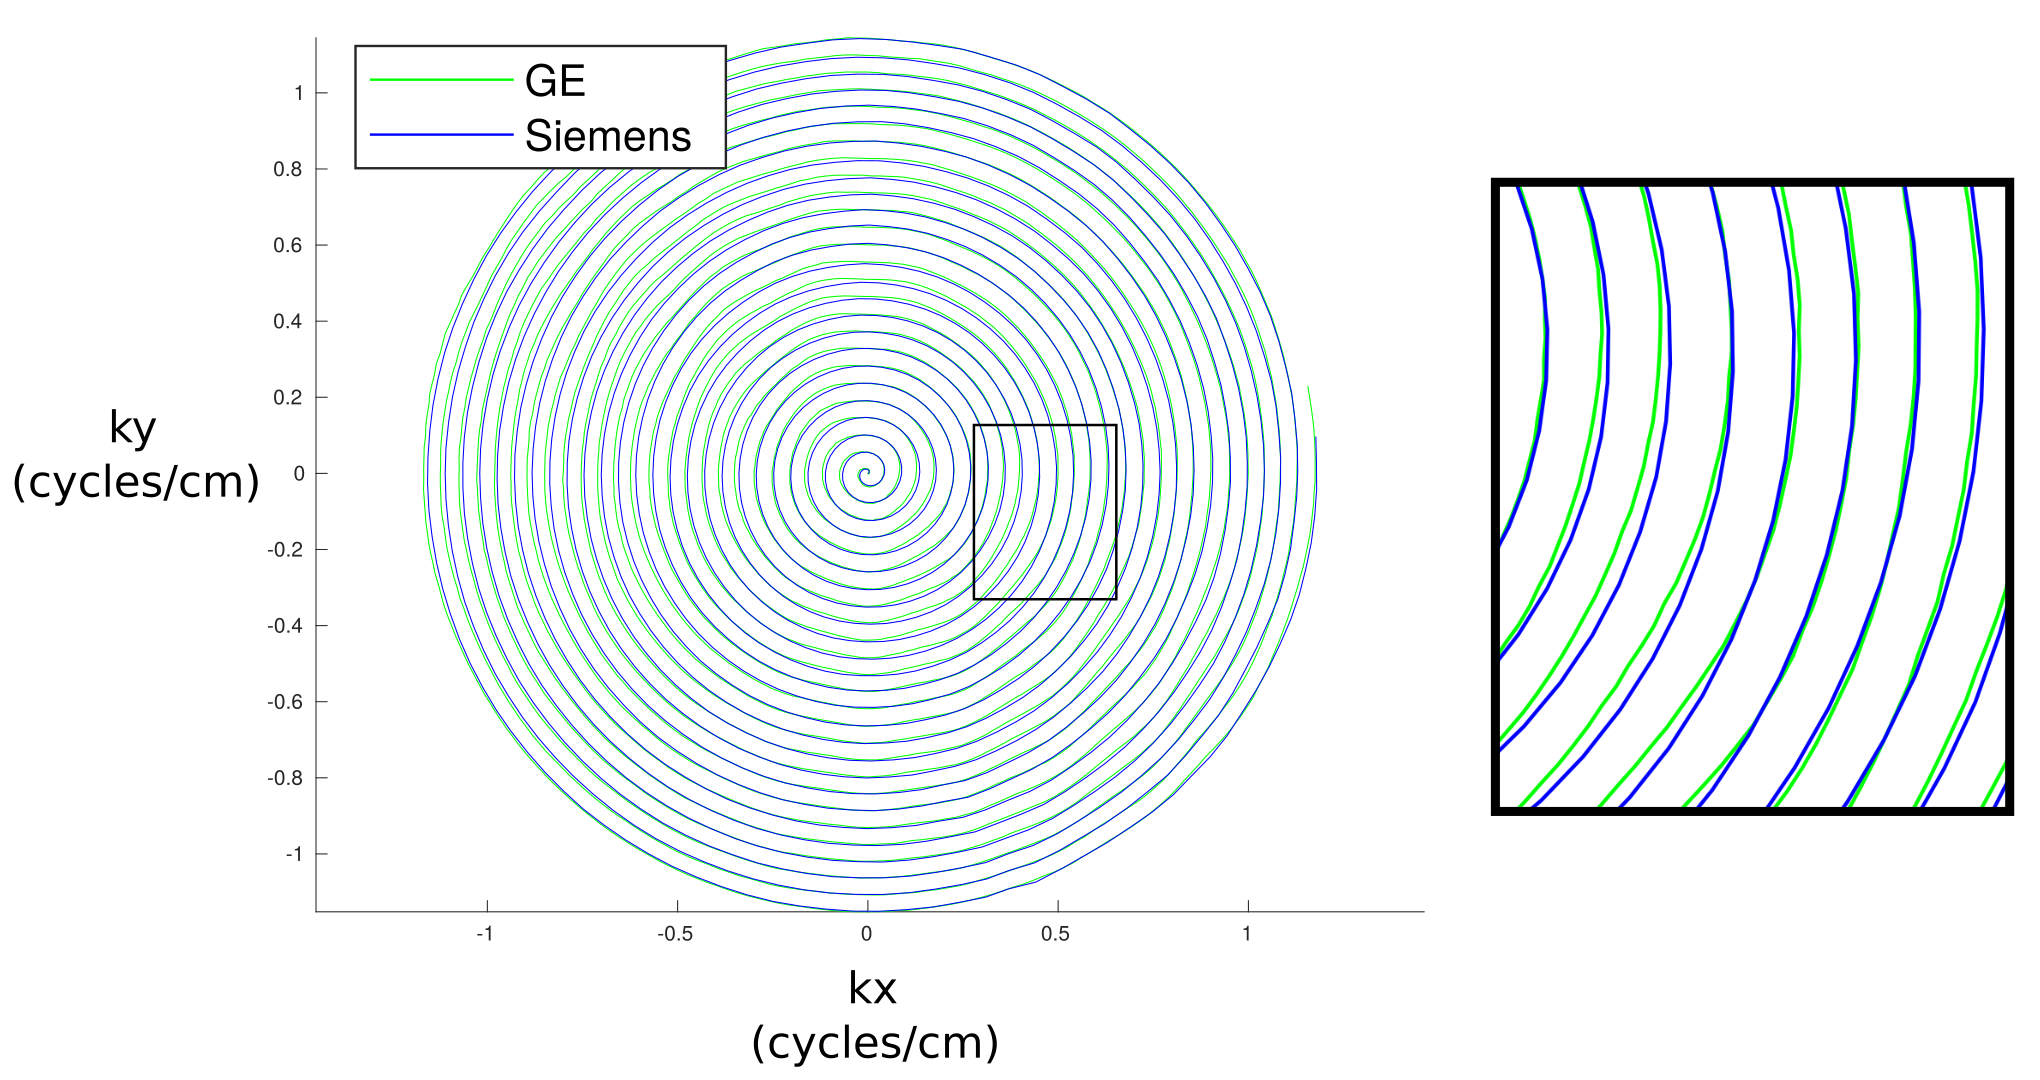
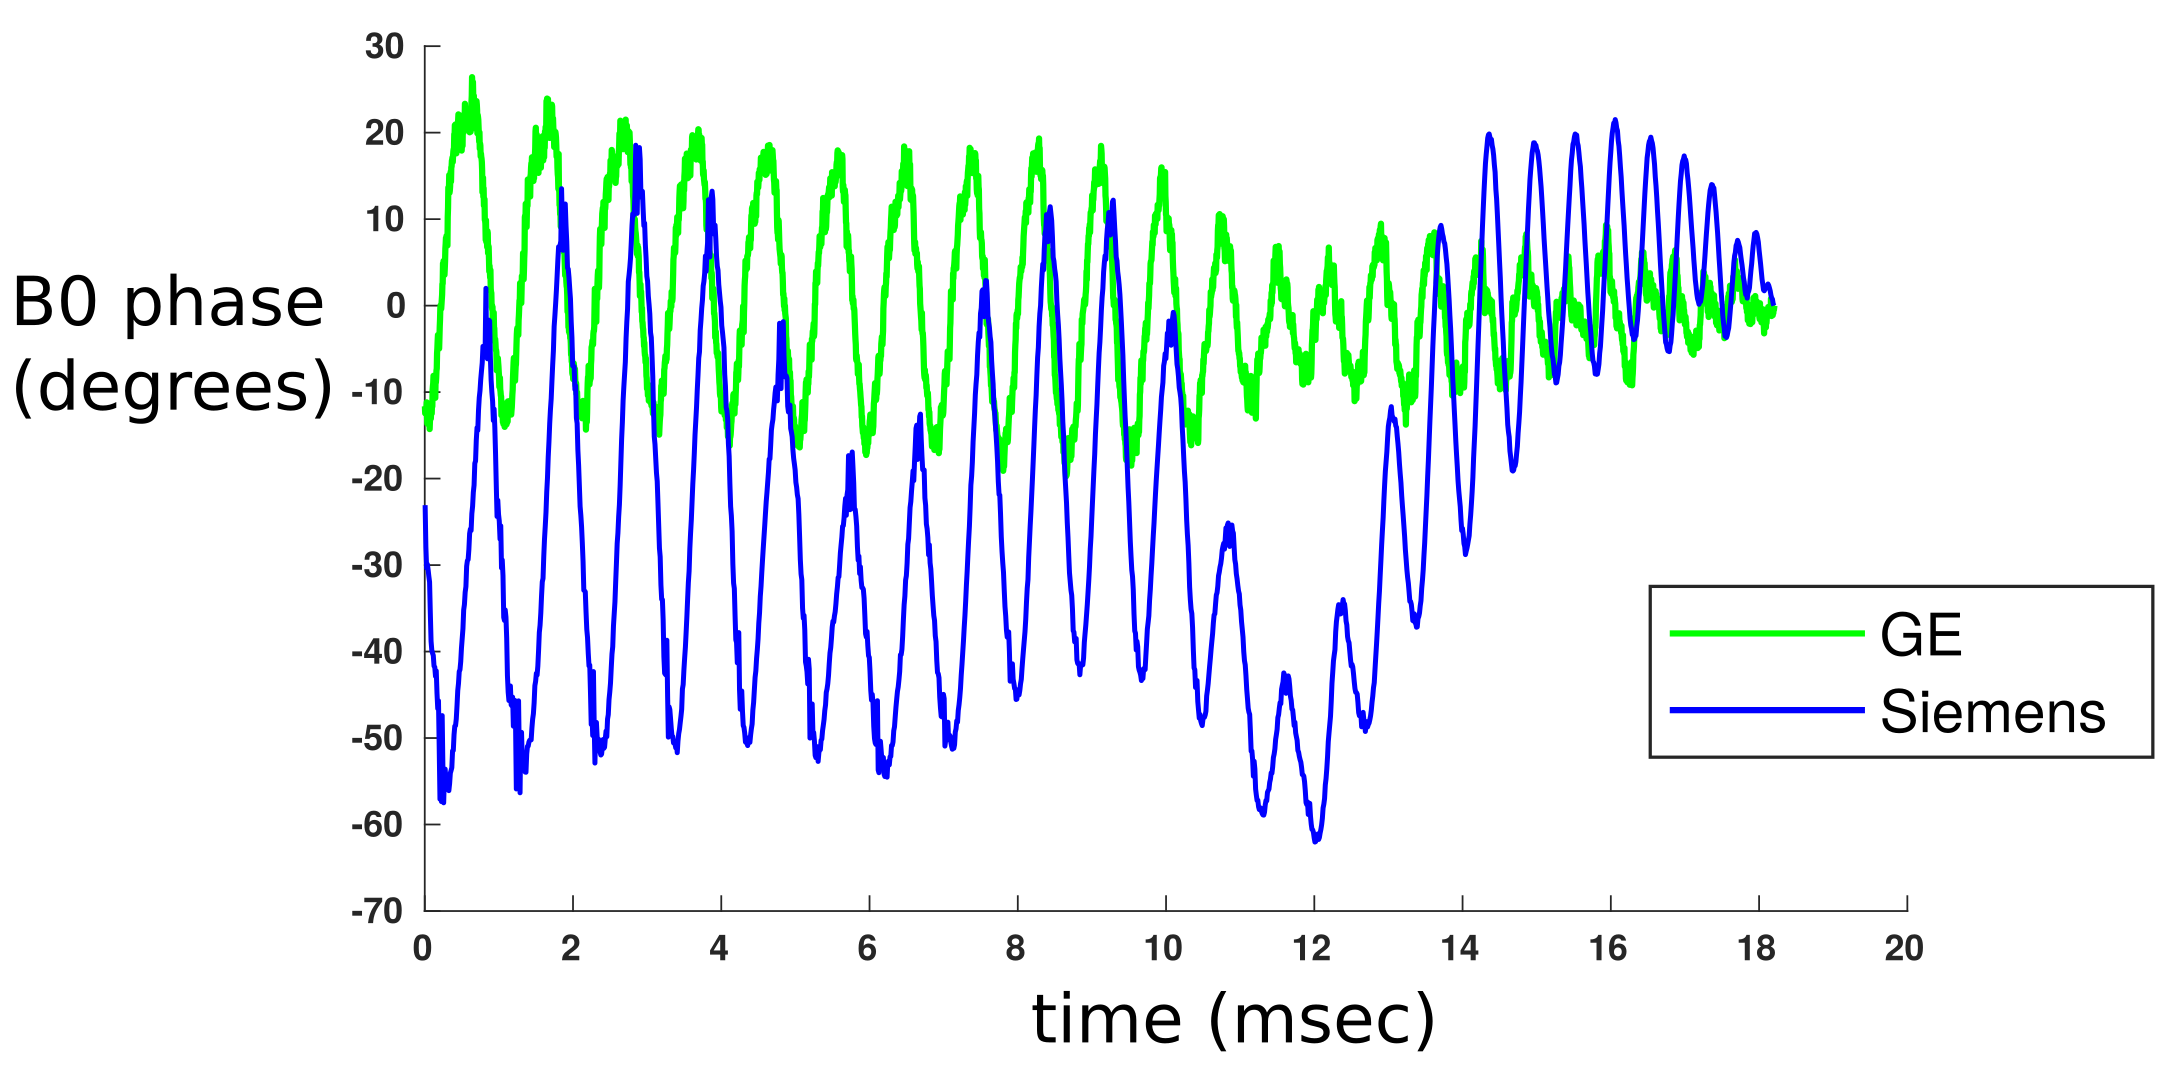
Figure 2 shows k-space trajectory mapping results. The trajectories produced by the two scanners are in close agreement, however subtle differences are apparent (see zoomed-in region). Figure 3 shows the measured B0 eddy current waveforms on both scanners, this time showing marked differences between the two. Of note is that the B0 waveforms do not simply “follow” the amplitude of the applied gradients (which would lead to approximately linear phase and hence a shift in image space) but also exhibit modulations on a time scale much slower than the spiral turn rate.CONCLUSION
The TOPPE/Pulseq framework enables direct comparison of gradient performance – and potentially other system factors such as RF non-linearity – across two major vendor platforms. Our measurements indicate that both vendor platforms tested here (GE, Siemens) produce significant B0 eddy currents during playback of a spiral-in readout trajectory that are not simply scaled versions of the gradients, and that they produce slightly – but potentially significantly – different k-space trajectories. These measurements underscore the need for measuring and correcting for B0 eddy currents in spiral imaging.Acknowledgements
This work was supported by NIH grant R01EB023618-02S1.References
[1] Nielsen JF, Noll DC. TOPPE: A framework for rapid prototyping of MR pulse sequences. Magn Reson Med 2018; 79(6):3128-3134.
[2] https://toppemri.github.io/
[3] Layton KJ, Kroboth S, Jia F, Littin S, Yu H, Leupold J, Nielsen JF, Stöcker T, Zaitsev M. Pulseq: A rapid and hardware-independent pulse sequence prototyping framework. Magn Reson Med 2017; 77:1544–1552.
[4] Duyn JH, Yang Y, Frank JA, van der Veen JW. Simple correction method for k‐space trajectory deviations in MRI. J Mag Res 1998;132:150–153.
Figures