4510
Correction for Geometric Distortion in Bipolar Gradient Echo Images from $$$B_0$$$ Field Variations1High Field Magnetic Resonance Center, Department of Biomedical Imaging and Image-Guided Therapy, Medical University of Vienna, Vienna, Austria
Synopsis
In bipolar multi-echo gradient echo imaging, signal is acquired during positive and negative readout gradients, giving an efficiency advantage over monopolar imaging in which no signal is acquired during “fly-back”/rewind periods. This increased acquisition efficiency allows higher resolution, shorter echo spacing or increased SNR. In bipolar acquisitions, however, $$$B_0$$$-related distortion along the readout axis occurs in opposite directions for odd and even echoes, leading to blurring when images from echoes are combined. We show that a simple unwarping scheme, based on $$$B_0$$$ field maps derived from the multi-echo data themselves, is effective in correcting this effect in multi-echo SWI.
Purpose
To remove $$$B_0$$$-related distortion in the readout direction in bipolar multi-echo gradient echo imaging.Introduction
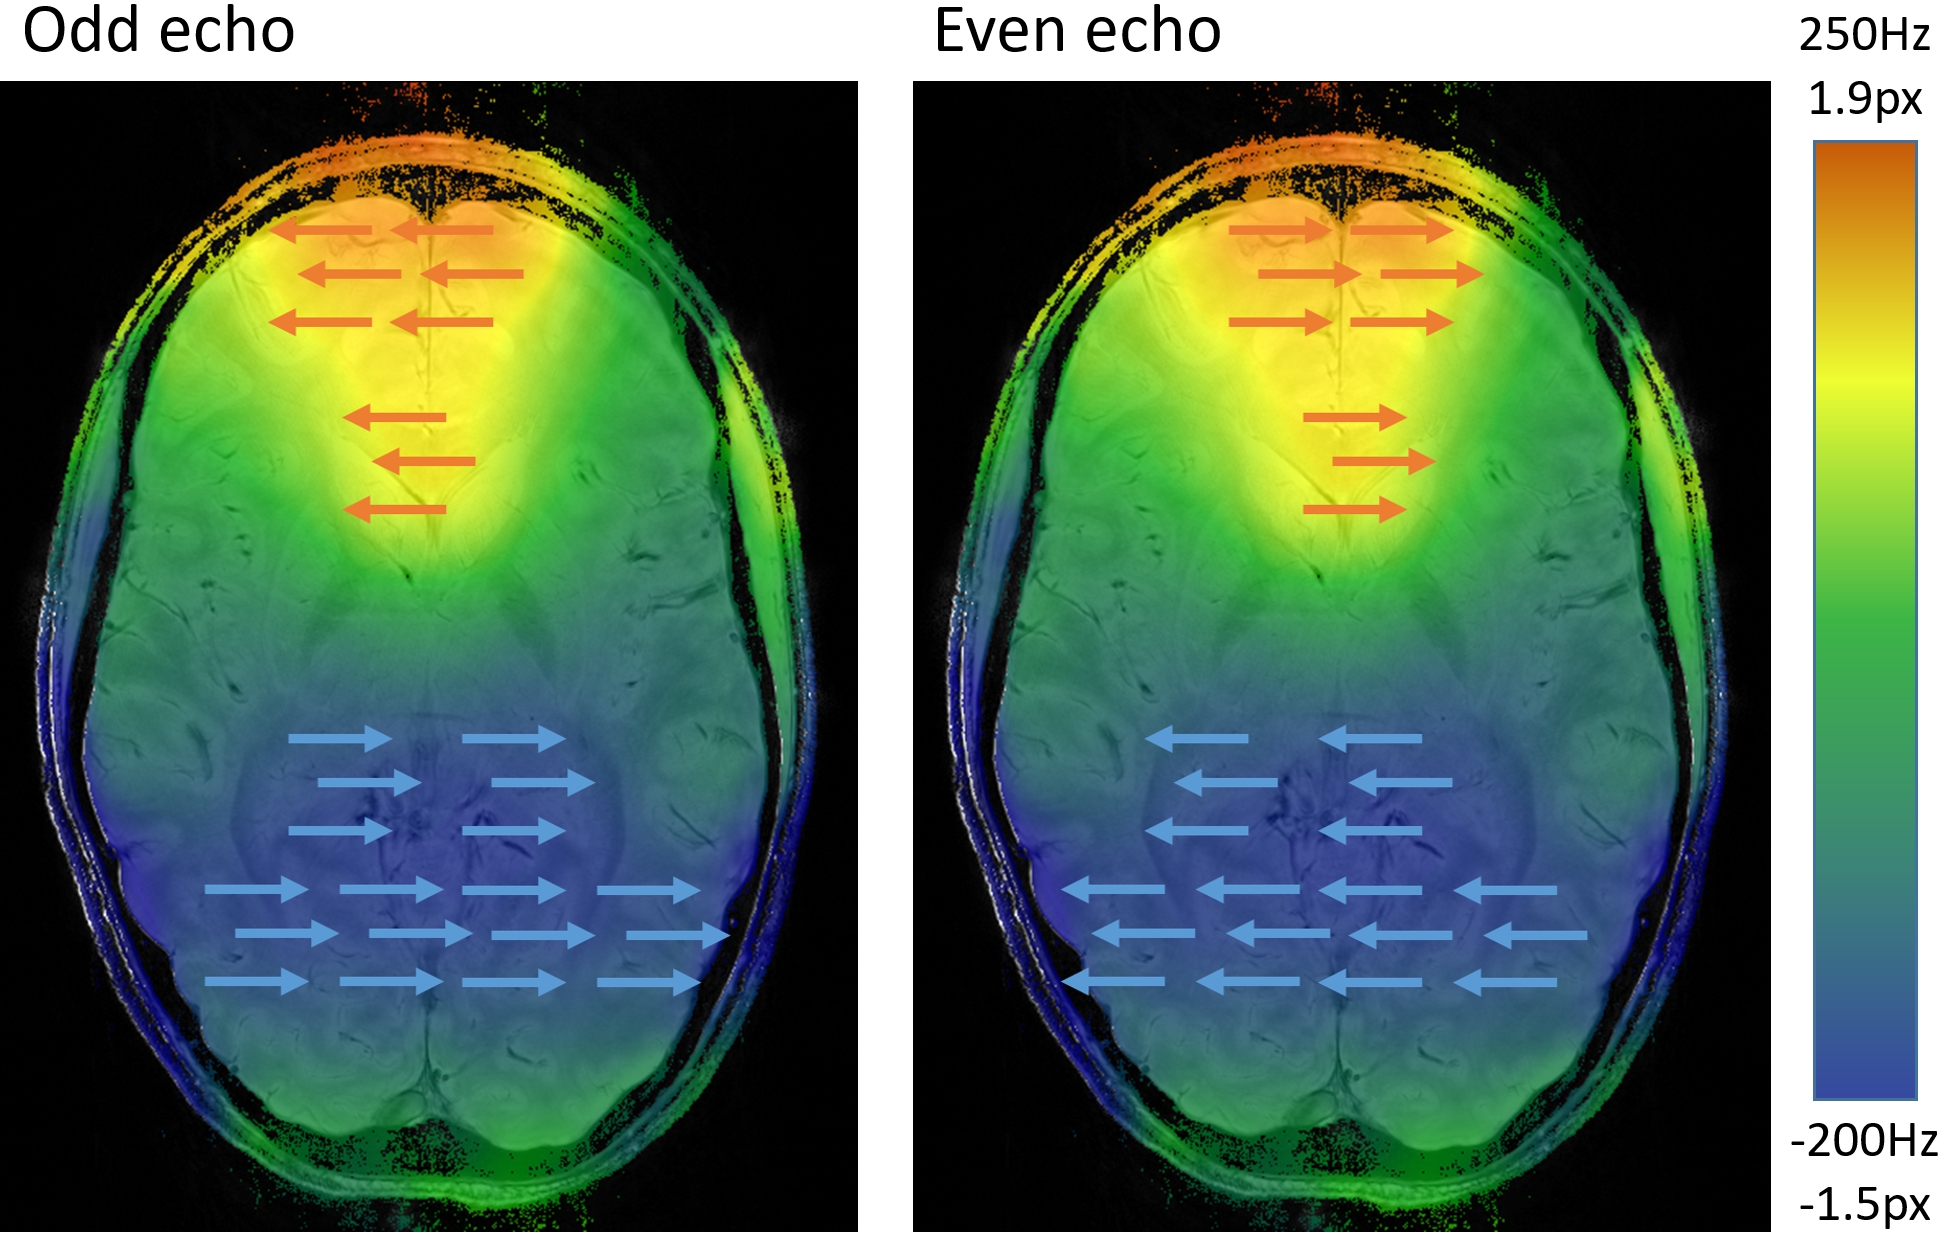
Bipolar acquisitions are more efficient than monopolar ones and achieve higher SNR1. They are increasingly popular in structural brain imaging1,2. There are different geometric distortions for the opposite readout polarities of the different echoes, however. Especially with low receiver-bandwidth, geometric distortion in the readout direction needs to be considered as it can reach several voxels in regions with non-compensated $$$B_0$$$ field (Fig. 1), leading to misalignments and blurring in applications such as Susceptibility Weighted Imaging (SWI3). Jutras et al. have proposed deformable image registration before the combination of multiple echoes1. We show that a full correction can be achieved by calculating the $$$\Delta B_0$$$ field and reversing the effects of distortion.Theory
The $$$\Delta B_0$$$-induced geometric distortion in gradient echo acquisitions in the readout direction has the same origin as the geometric distortion in echo planar imaging4 (which is primarily in the phase-encode direction). To correct distortions in the ‘odd’ images (i.e. those with echo numbers 1,3,5, etc), a $$$\Delta B_0$$$ fieldmap in the same (distorted) space as the odd images, $$$\Delta B_{0,\text{odd}}$$$, is required. It can be converted into a voxel shift map $$$\text{VSM}_\text{odd}$$$ which describes the shift between the voxels and their correct location:
$$\text{VSM}_{\text{odd}}=\frac{\Delta B_{0,\text{odd}}}{\text{RBW}_\text{RO}}$$
with $$$\text{RBW}_\text{RO}$$$ being the receiver bandwidth in the readout direction. As the even echoes were acquired with negative readout polarity, $$$\text{VSM}_\text{even}$$$ is calculated as
$$\text{VSM}_\text{even}=-\frac{\Delta B_{0,\text{even}}}{\text{RBW}_\text{RO}}$$
$$$\Delta B_{0,\text{odd}}$$$ can be obtained by unwrapping and scaling the phase difference between the first and third echo.
$$\Delta B_{0,\text{odd}}=\frac{\text{unwrap}(\varphi_3-\varphi_1)}{\text{TE}_3-\text{TE}_1}$$
$$$\Delta B_{0,\text{even}}$$$ can either be calculated from the phase difference between the second and fourth echo or by warping $$$\Delta B_{0,\text{odd}}$$$ into the space of the distorted even images by applying $$$2\cdot\text{VSM}_\text{odd}$$$ to $$$\Delta B_{0,\text{odd}}$$$. The VSM gives the correct positions for the voxels and requires a final 1D interpolation to obtain a regridded volume in cartesian space.
Methods
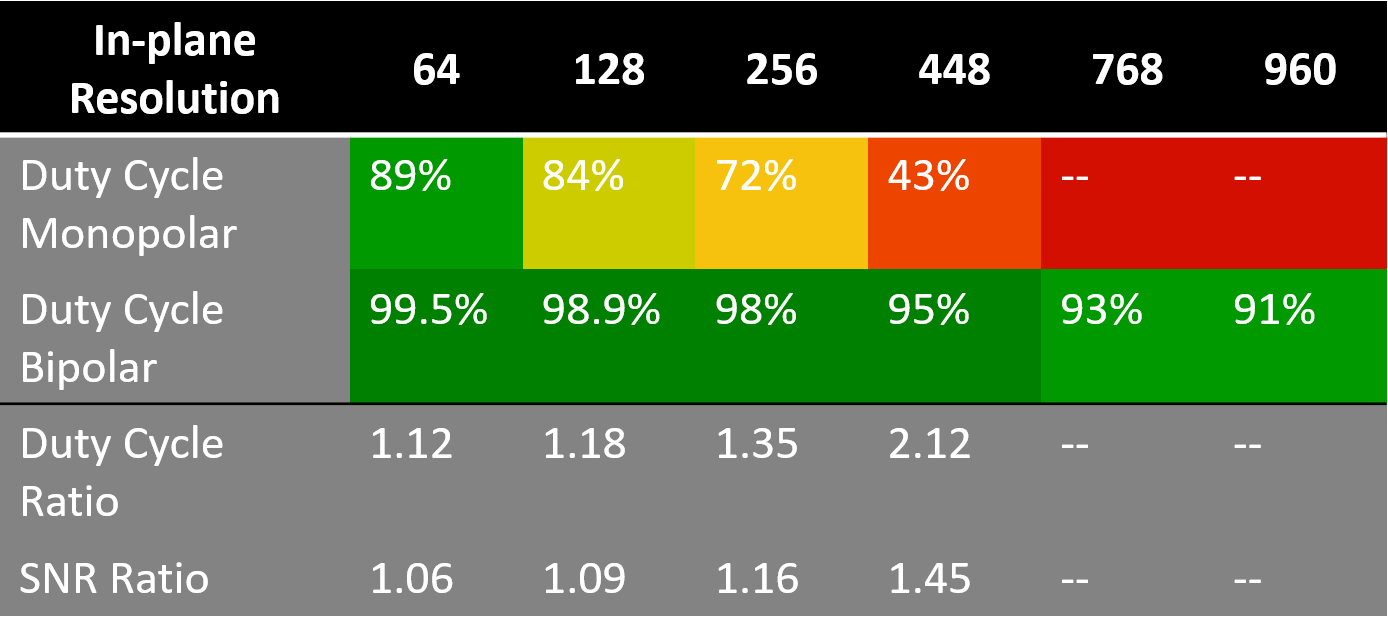
A simulation of the duty cycle of monopolar and bipolar sequences was performed, which was calculated as the ratio between the data acquisition period and total measurement duration (details in caption of Fig. 2).
The data for the SNR comparison and SWI was acquired from a healthy volunteer with a 7T MR whole body Siemens MAGNETOM scanner with a 32-channel Nova Medical head coil and automated shimming.
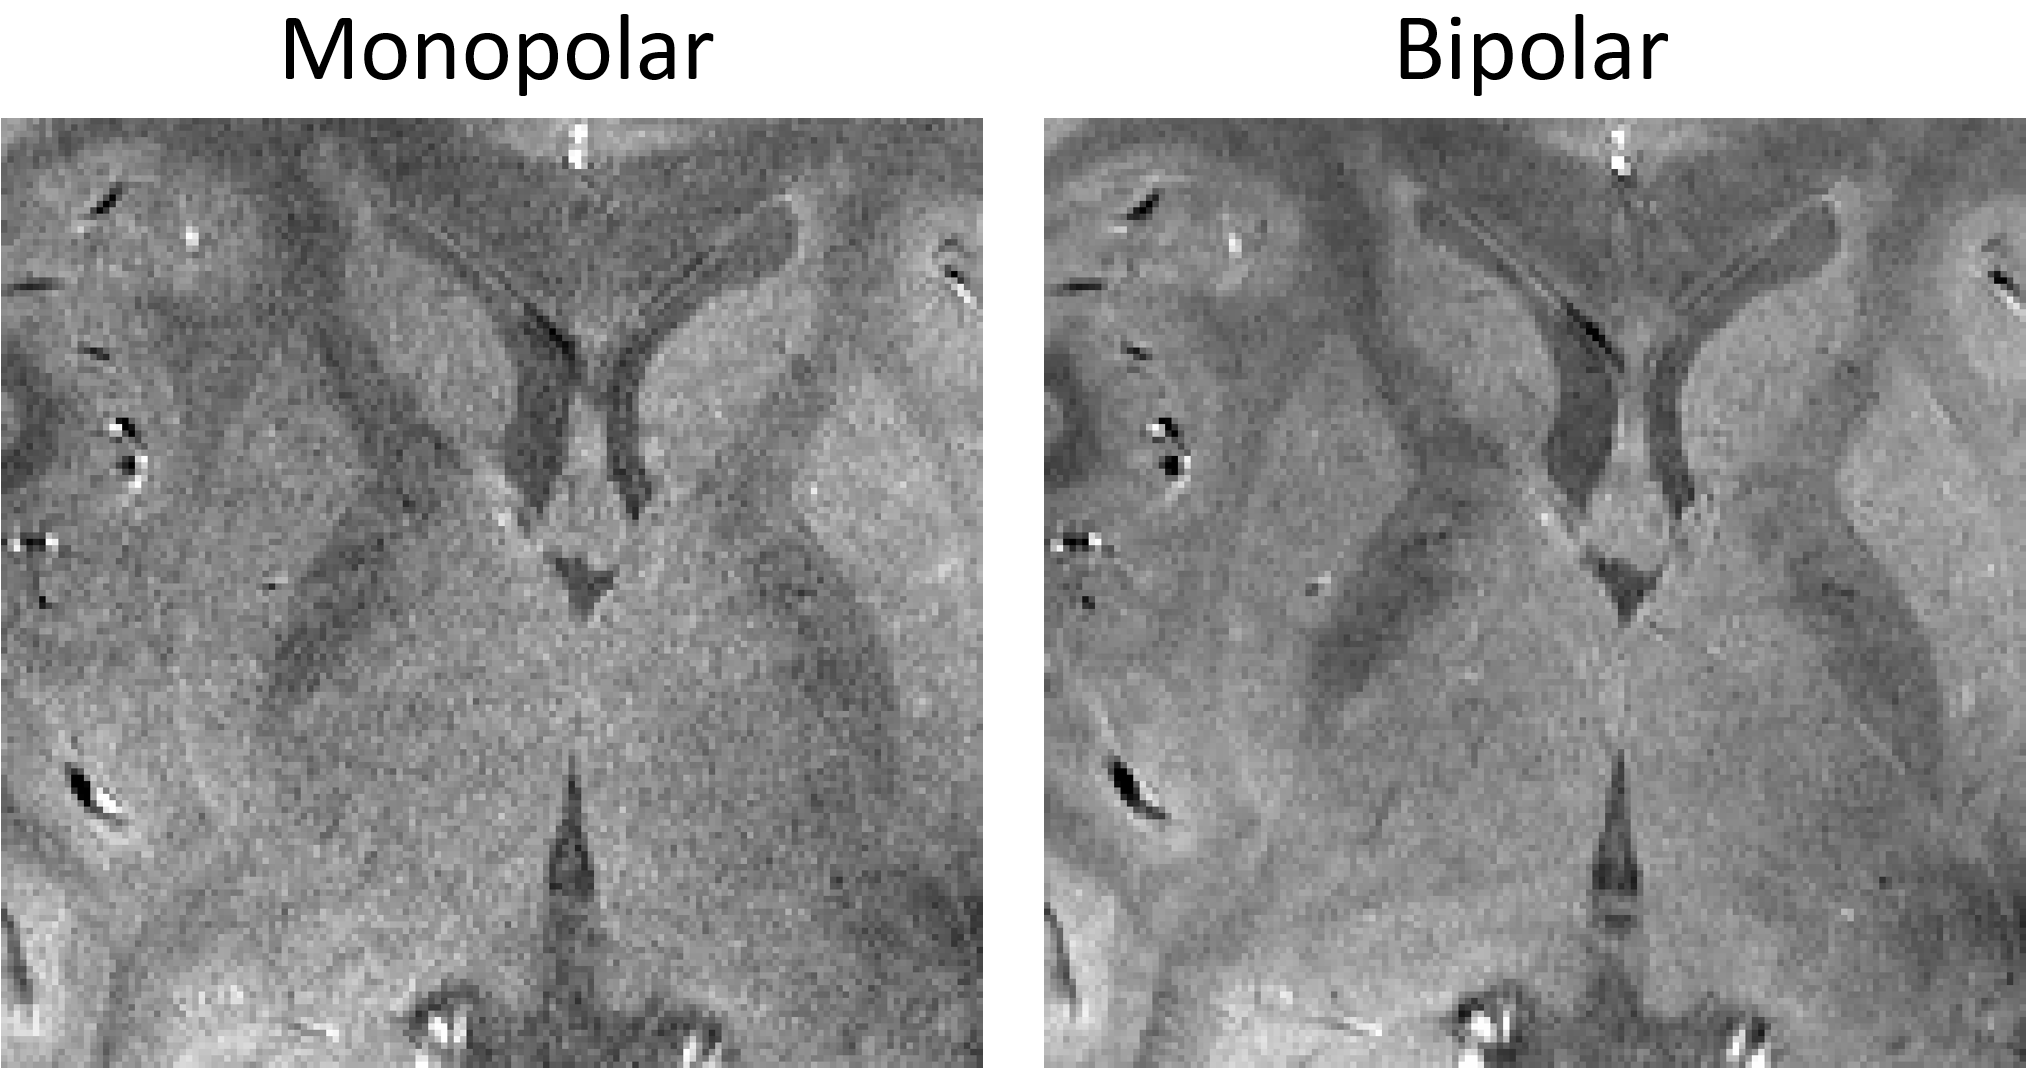
For the SNR comparison, a monopolar and a bipolar sequence were acquired in which the lowest possible receiver bandwidth was used for each sequence, with otherwise identical parameters (see Fig. 3 for details).
SWI was performed on a 3D bipolar multi-echo dataset, with a matrix size of 704x704x112 TE/TR=[8,16,24]/31ms, in-plane resolution=0.3mm, slice thickness=1.2mm, receiver bandwidth=132 Hertz/pixel, GRAPPA factor=2, slice and phase partial Fourier factors of 6/8, TA=11min 56s.
Phase images were combined using ASPIRE5 and the phase difference unwrapped with “best path”6. $$$\text{VSM}_\text{even}$$$ was created by applying $$$2\cdot\text{VSM}_\text{odd}$$$ to $$$\Delta B_{0_\text{odd}}$$$. Linear interpolation was used for regridding, and the distortion correction was applied to combined magnitude and phase data. The calculation steps are presented in a github repository7.
Results
Fig. 2 illustrates the higher efficiency of bipolar acquisitions over a range of scan parameters. The higher SNR of bipolar images is illustrated in Fig. 3.
In the SWI dataset, the maximum size of the displacement in the volume was -2.7 and +2.3 voxels (-0.8 and +0.7 mm) (Fig. 1), with the misalignment between odd and even echoes being twice those values.
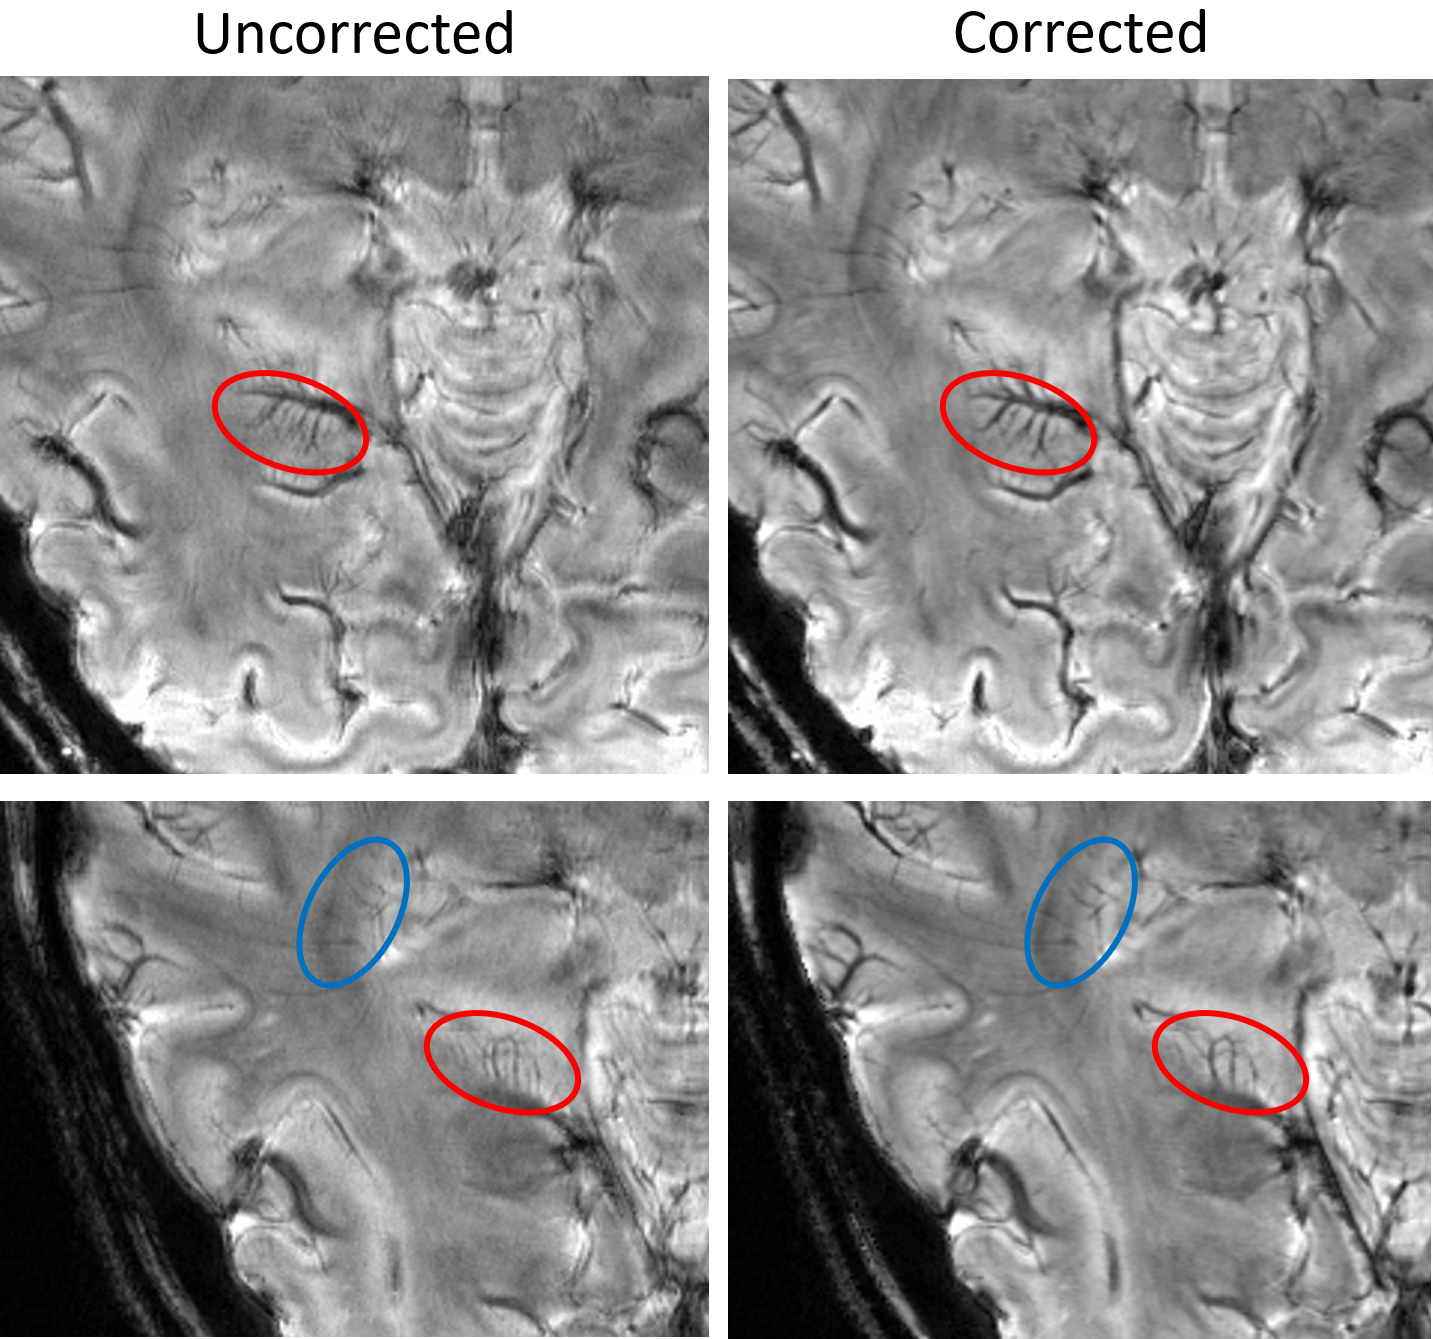
Fig. 4 shows SWI generated from the uncorrected and $$$B_0$$$-corrected data sets. On the left, the veins in the uncorrected images appear doubled or heavily blurred. The veins in the distortion-corrected images on the right are clearly visible.
Discussion
Our simulation and imaging comparison illustrate the SNR advantage of bipolar over monopolar acquisitions, particularly at high resolution. In the bipolar measurements in this study (with a readout bandwidth of 132 Hertz/pixel), the distortion (which affects odd and even echo images in opposite directions) led to misalignment of about 6 pixels, or 2 mm. This was fully corrected using $$$\Delta B_0$$$ maps calculated from the multi-echo data themselves, removing the doubling of fine vessels in multi-echo SWI. Field maps from the proposed method could also be used to remove distortion in other structural scans in a neuroimaging protocol, improving the correspondence between SWI, T1 and T2-weighted images and the stereotactic space used e.g. in gamma knife and other radiotherapy and surgical applications in which geometric accuracy is critical.Acknowledgements
This study was supported by funds of the Austrian Science Foundation FWF, Project Number 31452.References
1. Jutras J, Wachowicz K, Gilbert G, et al. SNR Efficiency of Combined Bipolar Gradient Echoes: Comparison of Three-Dimensional LASH, MPRAGE, and Multiparameter Mapping with VFA-FLASH and MP2RAGE. Magn Reson Med 2016; 77(6):2186-2202
2. Li J, Chang S, Liu T, et al. Phase-corrected bipolar gradients in multi-echo gradient-echo sequences for quantitative susceptibility mapping. MAGMA 2015; 25(4):347-355
3. Haacke EM, Xu Y, Cheng YC, Reichenbach JR. Susceptibility weighted imaging (SWI). Magn Reson Med 2004; 52(3):612-618
4. Jezzard P, Balaban RS. Correction for geometric distortion in echo planar images from B0 field variations. 1995;34(1):65-73
5. Eckstein K, Dymerska B, Bachrata B et al. Computationally Efficient Combination of Multi-channel Phase Data From Multi-echo Acquisitions (ASPIRE). Magn Reson Med 2018; 79(6):2996-3006
6. Abdul‐Rahman HS, Gdeisat MA, Burton DR, et al. Fast and robust three‐dimensional best path phase unwrapping algorithm. Appl. Opt. 2007; 46(26): 6623–6635
7. Eckstein K, Bipolar Distortion Correction, (2018), GitHub repository; https://github.com/korbinian90/Bipolar-Distortion-Correction
Figures