4502
Retrospective transmission field (B1+) and sensitivity profile (B1-) correction for transceive surface RF coils: an empirical solution for RARE1Berlin Ultrahigh Field Facility (B.U.F.F), Max Delbrück Center for Molecular Medicine, Berlin, Germany, 2MRI.tools GmbH, Berlin, Germany, 3Experimental and Clinical Research Center, a joint cooperation between the Charité Medical Faculty and the Max Delbrück Center for Molecular Medicine in the Helmholtz Association, Berlin, Germany
Synopsis
Improving the low signal-to-noise ratio (SNR) inherent to emerging MRI methods such as fluorine MRI is challenging. To enhance sensitivity, SNR-efficient pulse sequences such as RARE and cryogenically-cooled surface RF coils (CRP) are used. Transceive surface RF coils show variation in the excitation field (B1+), impairing quantification. To compensate, previous studies have used an analytical signal intensity equation to perform a retrospective B1+-correction. However, this is unfeasible for RARE due to the absence of such an equation. To overcome this challenge, we propose and validate a numerical method using experimental data acquired with a volume resonator (reference) and a 1H-CRP.
Introduction
Fluorine (19F) MRI techniques support quantification but are limited by their inherently low signal-to-noise ratio1 (SNR). To boost SNR, it is conceptually appealing to use SNR-efficient pulse sequences such as RARE2-4 in combination with state-of-the-art cryogenically-cooled RF coils5 (CRP). However, 19F-CRPs are only available as transceive surface RF coils, which have a strong intrinsic spatial gradient in the excitation field (B1+). As a result, both coil sensitivity and excitation flip angle (FA) are spatially dependent, severely hampering quantification. B1+ mapping in combination with an analytical description of the signal intensity (SI) dependency on the FA permits a retrospective B1+ correction6, compensating the effects of these FA variations on the SI. While this approach has been successfully applied to gradient echo techniques like FLASH, it is not feasible for RARE due to its more complex train of spin-echoes and stimulated echoes with error propagation7 for which no analytical SI equation exists. To address this shortcoming, we developed an alternative approach based on estimating the relationship between SI, FA and T1 empirically. In this proof-of-concept study, data was acquired with a volume resonator (reference) and a 1H-CRP to evaluate the feasibility of the proposed B1 correction approach in test phantoms and ex vivo mouse brains. This method may be valuable not only for X-nuclei MR in which absolute SI is highly relevant, but also in conventional 1H-MRI when accurate FAs are needed for well-defined T1-contrasts and quantitative T1-measurements.Methods
Experiments were performed on a 9.4T animal MR scanner (Bruker BioSpin, Ettlingen, Germany).
B1-mapping. A B1+ map of the 1H-CRP was computed on a uniform phantom using the double flip angle method9-10. The approximation SI α B1+/max(B1+) · B1-/max(B1-) at low FAs was used to calculate the corresponding B1- map.
RARE signal intensity modelling. Aqueous solutions of gadolinium were used to prepare 12 NMR tubes with T1 relaxation times ranging between 670 and 2850ms. RARE scans were acquired with a 1H volume RF coil8 (TR=1000ms, ETL=8, BW=50kHz, centric encoding with flipback) and 12 reference powers to vary the FA between 35°-110°. The SI resulting from each FA-T1-combination was obtained by averaging over ROIs in each NMR tube. A 6th order polynomial was fitted to the experimental data to estimate SI=f(FA,T1).
Image acquisition and T1-mapping. The proposed approach was evaluated on a uniform phantom with two water-Gd-mixtures (15ml tube containing mixture-1 and two NMR tube inserts containing mixture-2) and a paraformaldehyde-fixed mouse head. RARE images were acquired (same parameters as above) using the volume resonator (reference) and the 1H-CRP. T1 maps were calculated using RARE (13 TRs from 100-18000ms).
Correction method. A B1+-correction factor was calculated as the modelled RARE SI for perfect 90° excitation divided by the modelled RARE SI for the actual excitation FA. SI correction involved applying this B1+-correction factor and dividing by the B1- map.
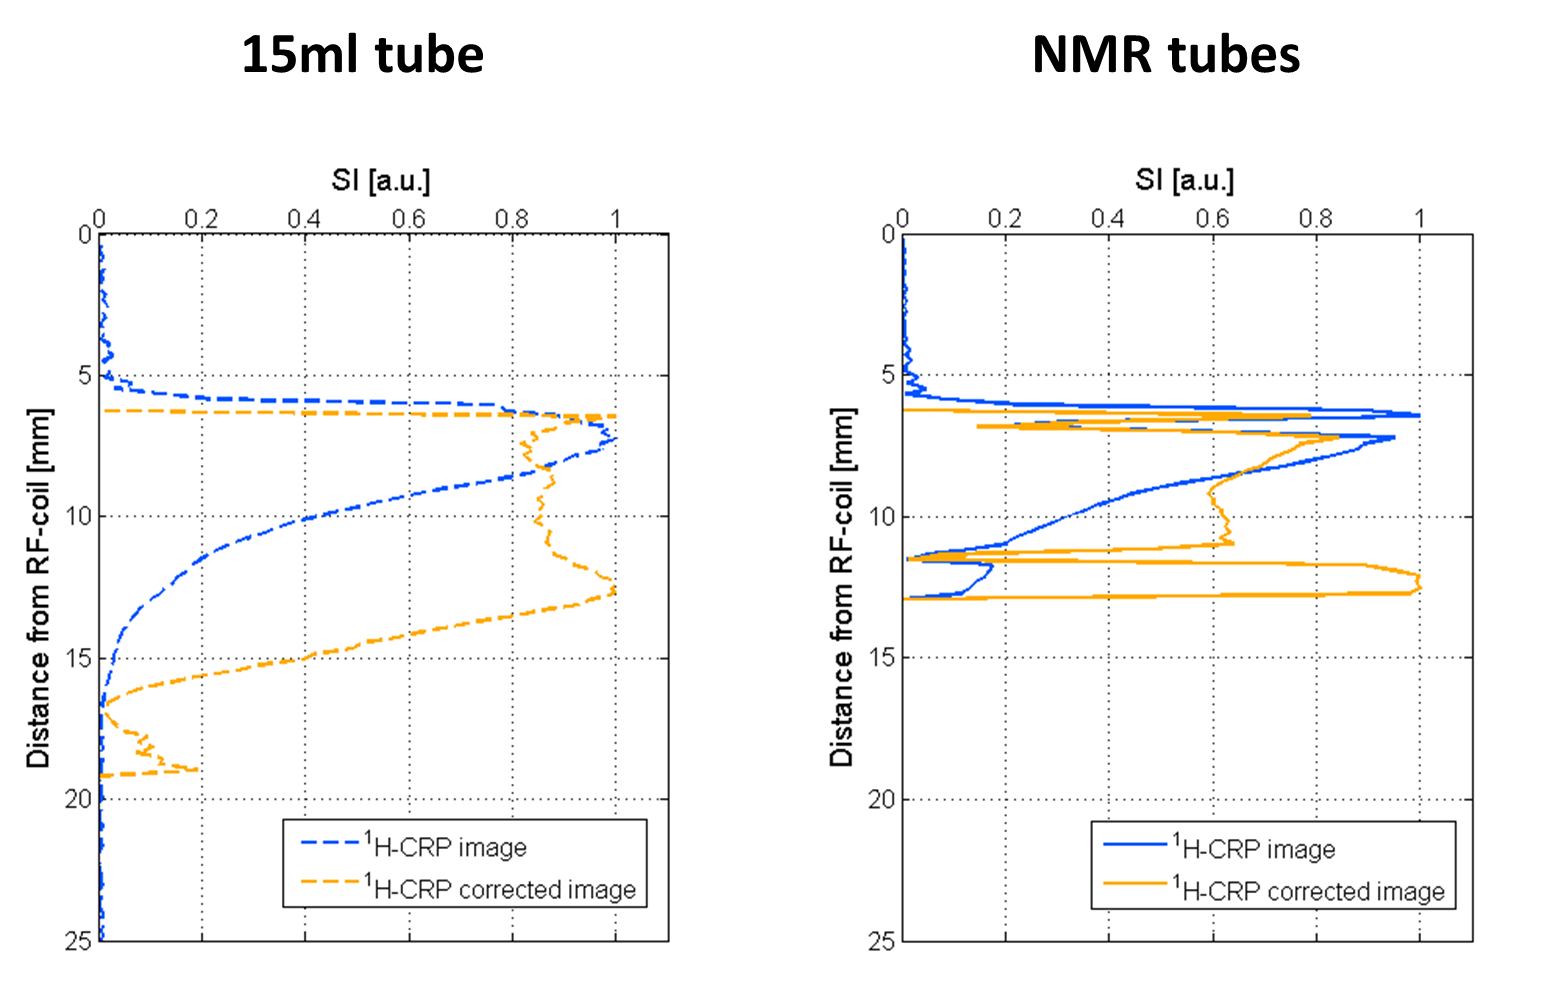
Evaluation. We compared the SI in the corrected CRP-image with that of the volume coil, along a line perpendicular to the RF coil surface.
Results
The RARE SI dependency on FA and T1, as modelled with a polynomial fit to the experimental data, is illustrated as a surface plot in Fig.1. Good correspondence between the fit and the measured data points can be observed (RMSE=2.5170, R2 = 0.9952). After B1- correction, the strong spatial SI gradient in the CRP-image was removed, yielding a rather homogeneous SI up to a depth of approximately 13.5mm, both for the uniform phantom (Fig.2) and the mouse brain (Fig.4). Plots of the normalized vertical SI profiles demonstrate the impressive increase in image homogeneity (Fig.3, Fig.5). While a meaningful SI quantification was unfeasible in the original image, the B1-corrected RARE image permitted quantitation up to 13.5mm from the RF coil, sufficient to cover the entire mouse brain.Conclusions
Here we developed a new method for B1 correction when using RARE in combination with TX/RX-surface RF coils, such as state-of-the-art cryogenically-cooled probes. This proof-of-concept study demonstrates the feasibility of this B1 correction approach, which is fundamentally limited by SNR constraints at larger distances from the RF coil. The proposed retrospective B1 correction method for RARE may be valuable for conventional 1H-MRI when accurate FAs are needed to achieve well-defined T1-contrasts and quantitative T1 measurements. This method is also highly relevant for quantitative MR of X-nuclei where absolute SI is limiting, as shown by the example of quantification of fluorine-labelled cells in neuroinflammation using a 19F-CRP.Acknowledgements
This work was supported by the Deutsche Forschungsgemeinschaft to S.W. (DFG WA2804) and A.P. (DFG PO1869).References
1. Waiczies, S, et al. Tracking methods for dendritic cells. 19F Magnetic resonance imaging, chapter 9, pp. 243-281.
2. Hennig, J, et al. RARE imaging: a fast imaging method for clinical MR. Magn Reson Med, 1986; 3: 823-833.
3. Mastropietro, A., et al. Optimization of rapid acquisition with relaxation enhancement (RARE) pulse sequence parameters for 19F-MRI studies. J. Magn. Reson. Imaging 2014; 40(1):162-170.
4. Faber, C., Schmidt, F. Chapter 1: Pulse sequence considerations and schemes. Fluorine Magnetic Resonance Imaging (2017).
5. Waiczies, S, et al. Enhanced fluorine-19 MRI sensitivity using a cryogenic radiofrequency probe: technical developments and ex vivo demonstration in a mouse model of neuroinflammation. Sci Rep 2017; 7: 9808.
6. Vernikouskaya, I, et al. In vivo 19F MRI quantification using B1+/B1- correction. ISMRM 25th Annual Meeting & Exhibition, 2016.
7. Meara S J P, et al. Evolution of the longitudinal magnetization for pulse sequences using a fast spin-echo readout: application to fluid-attenuated inversion-recovery and double inversion-recovery sequences. Magn Reson Med, 2005; 54: 241-245.
8. Waiczies, H, et al. Visualizing brain inflammation with a shingled-leg radio-frequency head probe for 19F/1H. Sci Rep., 2013; 3: 1280.
9. Akoka, S, et al. Radiofrequency map of an NMR coil by imaging. Magn Reson Imaging, 1993; 11:437-441.
10. Insko, EK, et al. Mapping of the radiofrequency field. J Magn Reson, 1993; A103:82-85.
Figures