4501
Optimal Flip Angle Range for B1+ Mapping at 3T with Slice Profile Correction Using a Dual Angle EPI Sequence1Oxford Centre for Clinical Magnetic Resonance Research, Division of Cardiovascular Medicine, Radcliffe Department of Medicine, University of Oxford, Oxford, United Kingdom, 2Perspectum Diagnostics, Oxford, United Kingdom
Synopsis
Mapping B1+ inhomogeneity, using commonly available pulse sequences, is essential for widespread, accurate determination of T1 using variable flip angle methods. We investigated the accuracy of B1+ mapping with different flip angles (FA) using the double angle method with a 2D multi-slice GRE-EPI sequence. At lower FAs, we found that B1+ accuracy is affected by SNR, whereas the extent of B1+ inhomogeneities imposes an upper limit on the FAs that can be employed. For a B1+ inhomogeneity of ±40% and a SNR of 29 at 30°, the optimal FA pairs were found to lie between 43°/86° and 74°/148°.
Introduction
Transmit radio-frequency (RF) field (B1+) inhomogeneities play a crucial role in quantitative imaging at 3T. Mapping 3D T1 values requires accurate knowledge of the flip angles (FAs) when using a 3D variable flip angle spoiled gradient recalled echo (SPGR) pulse sequence. Although several B1+ mapping methods have been proposed1-5, none are widely available as standard product sequences on Siemens scanners. We investigated the feasibility of applying a GRE-EPI readout for 2D multi-slice B1+ mapping using the double angle method (DAM)6, which can be routinely employed clinically. To optimise this sequence for accurate B1+ mapping, we studied the influence of slice profile effects and the choice of FAs.Methods
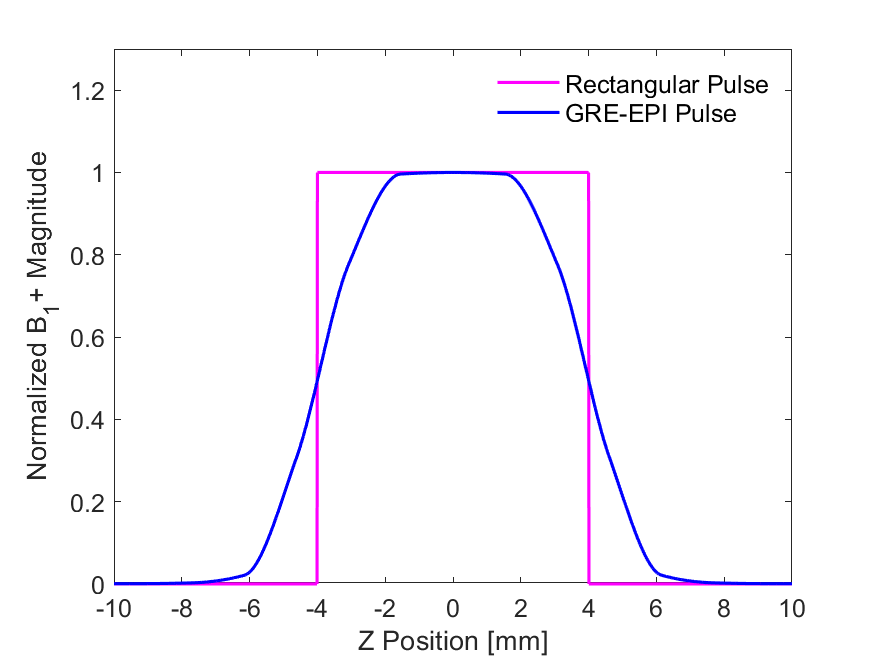
Monte Carlo simulations, using 10000 iterations, were performed to determine the signal from an ideal rectangular pulse in the frequency domain and the GRE-EPI RF pulse (Figure 1). These signals were corrupted with zero mean additive complex Gaussian noise, with a signal-to-noise-ratio (SNR) of 29 at a nominal FA of 30°. This SNR value was estimated from in vivo abdominal scans acquired with the same GRE-EPI sequence. The DAM was used to estimate the apparent FA, with the B1+ bias (correction factor) calculated as the ratio between the estimated and nominal FA. Slice profile effects were corrected by generating a look up table of the apparent FA as a function of the nominal FA7.
The recommended range of nominal FA pairs varies with the range of B1+ variations. As a guide, we characterized the B1+ mapping fidelities’ dependence on the FA pair when the B1+ field is homogenous, or has uniformly distributed variations of ±20% and ±40%.
Phantom images were acquired on a 3T MAGNETOM Prisma MRI scanner (Siemens Healthineers, Erlangen, Germany) with a GRE-EPI 2D multi-slice acquisition. For this excitation pulse, the scale factor between the slice centre FA and the nominal console FA7 was determined to be 1.105. Imaging parameters were: FOV=450*366mm2, matrix=128*104 with 15 slices, each of 8mm thickness and 2mm spacing between slices; TR/TE=15s/12ms and nominal FA pairs of 30°/60° and 60°/120°, corresponding to slice-centre FAs of 33°/66° and 66°/132°. A 3D VIBE SPGR Dixon mapped the 3D T1 values. Imaging parameters were: FOV=450*366mm2, matrix=320*260 with 16 slices of 3 mm thickness; TR/TE=4.1/1.23 ms, with FAs of 3°,6°,9°,12°,15°. Gold standard T1 measurement used a spin echo inversion recovery experiment with TR/TE= 10s/12ms, 8 TI values from 25 to 2000ms, matrix= 256*256, FOV=300*300mm2 and slice thickness of 5mm.
Results and Discussion
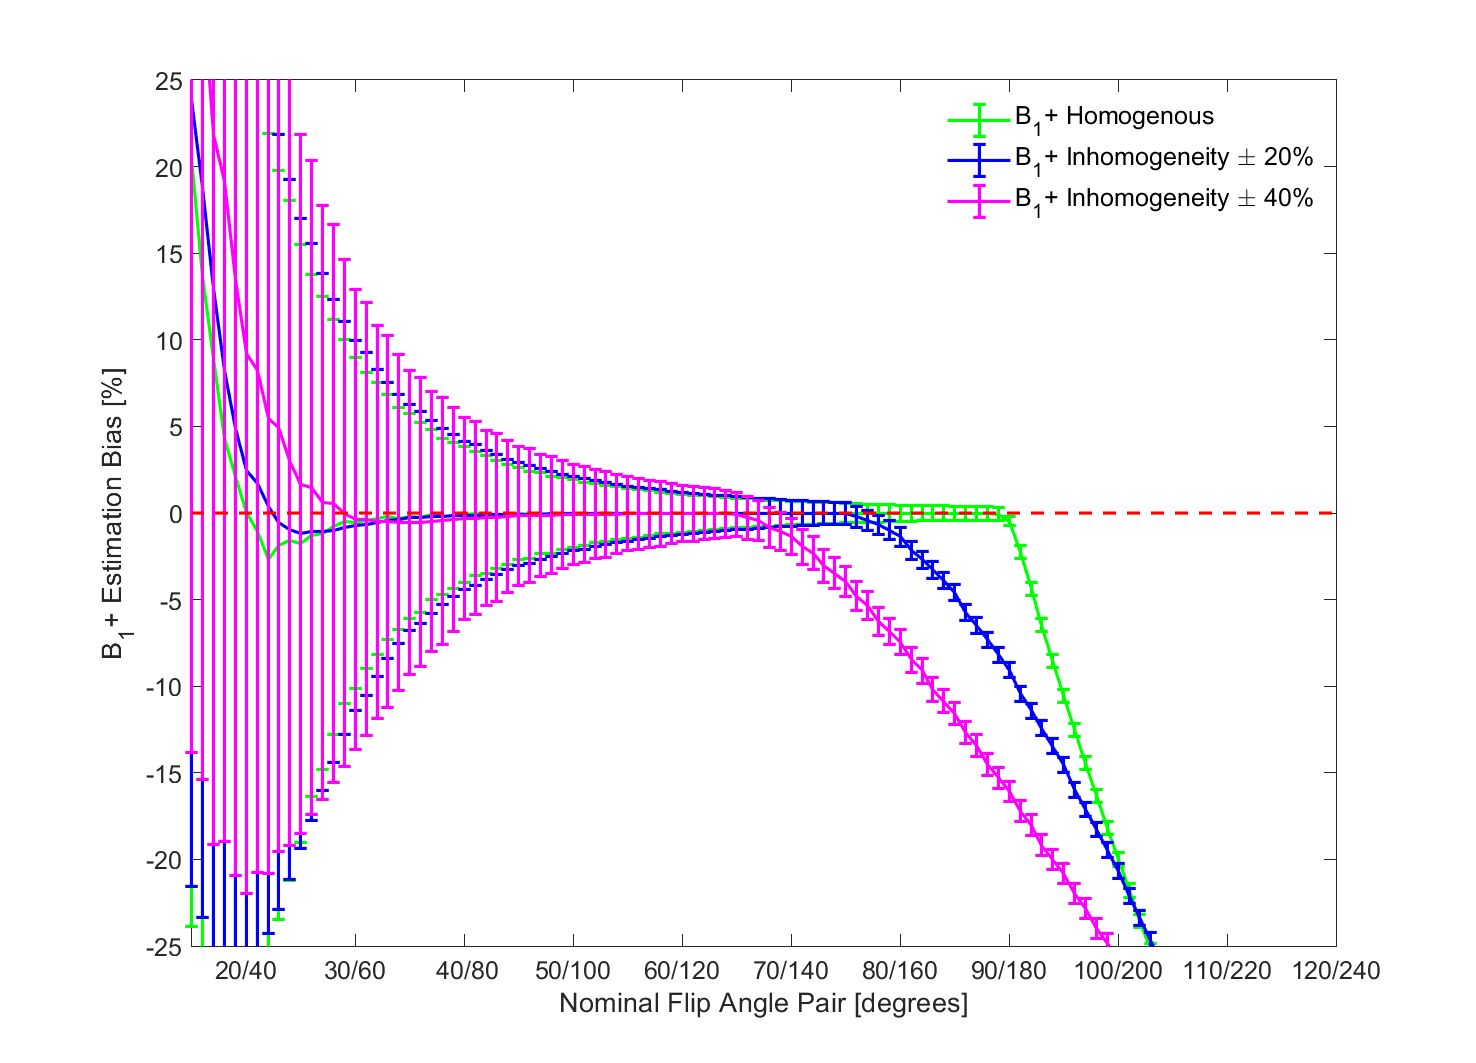
Figure 2 shows the mean B1+ bias as a function of nominal FA for an ideal rectangular pulse, considering three different B1+ variation levels. The FA lower bound is influenced by the SNR while the upper boundary is determined by the lack of phase data from this product sequence. For a rectangular pulse with homogeneous B1+, nominal FA pairs from 37°/74° until 90°/180° yield an accurate mean B1+ estimate, with uncertainties within 5%. As the B1+ inhomogeneity increases to ±20% and ±40%, the upper boundary of the FA decreases to 75°/150° and 65°/130°, respectively. Additionally, the lower FA bound increases since smaller angles are more sensitive to noise.
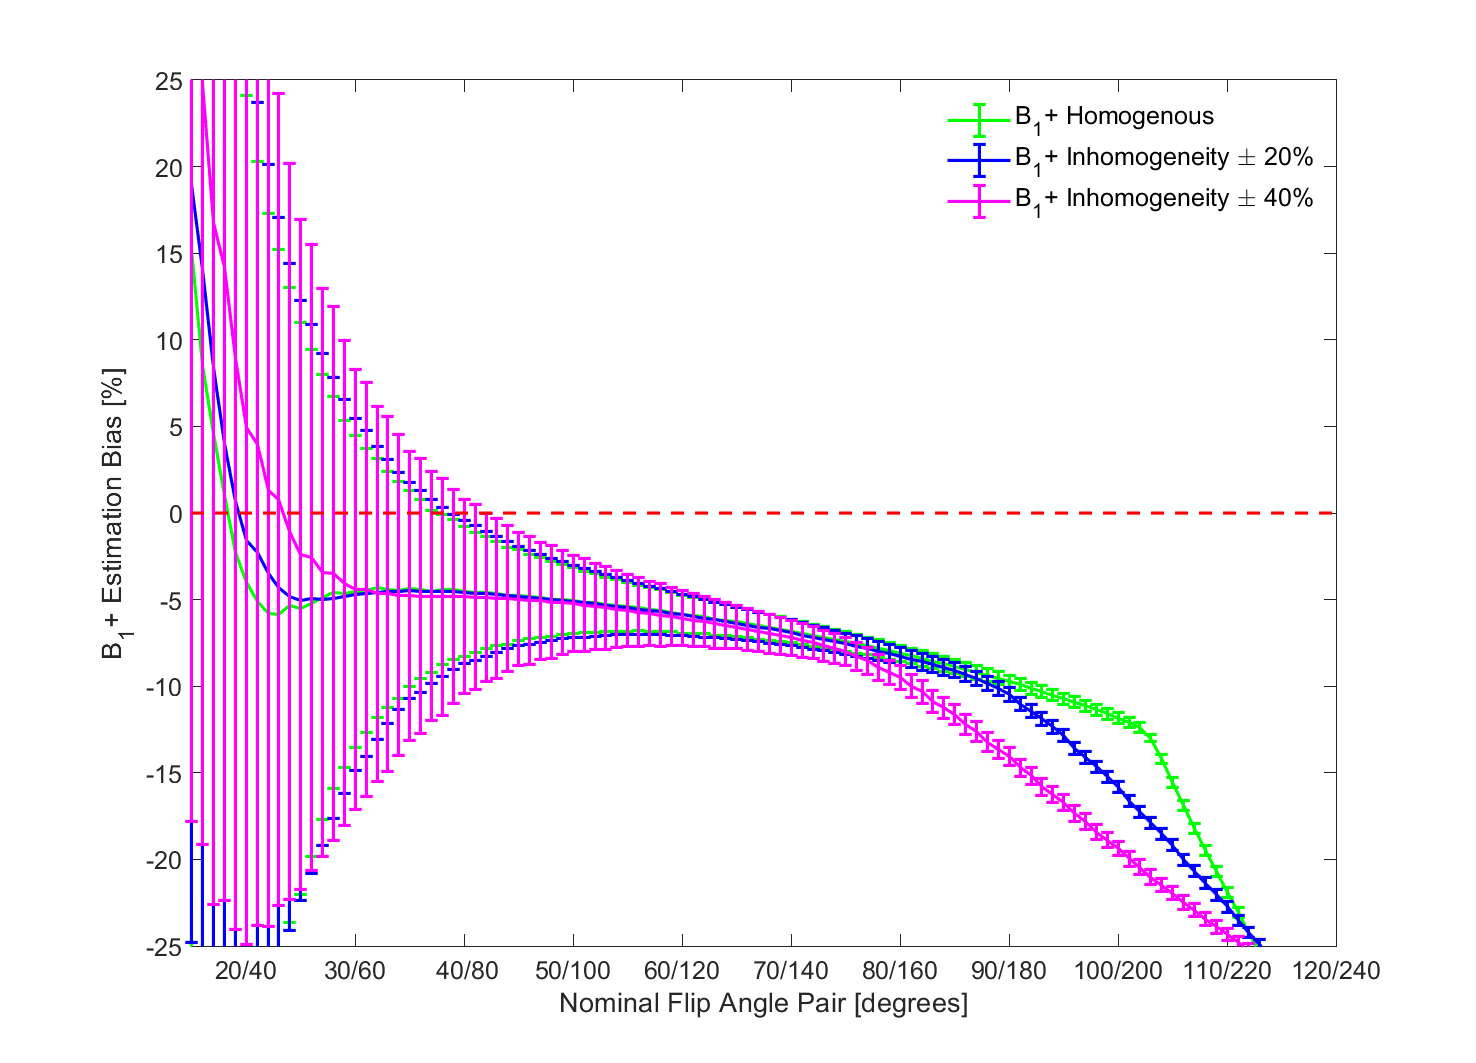
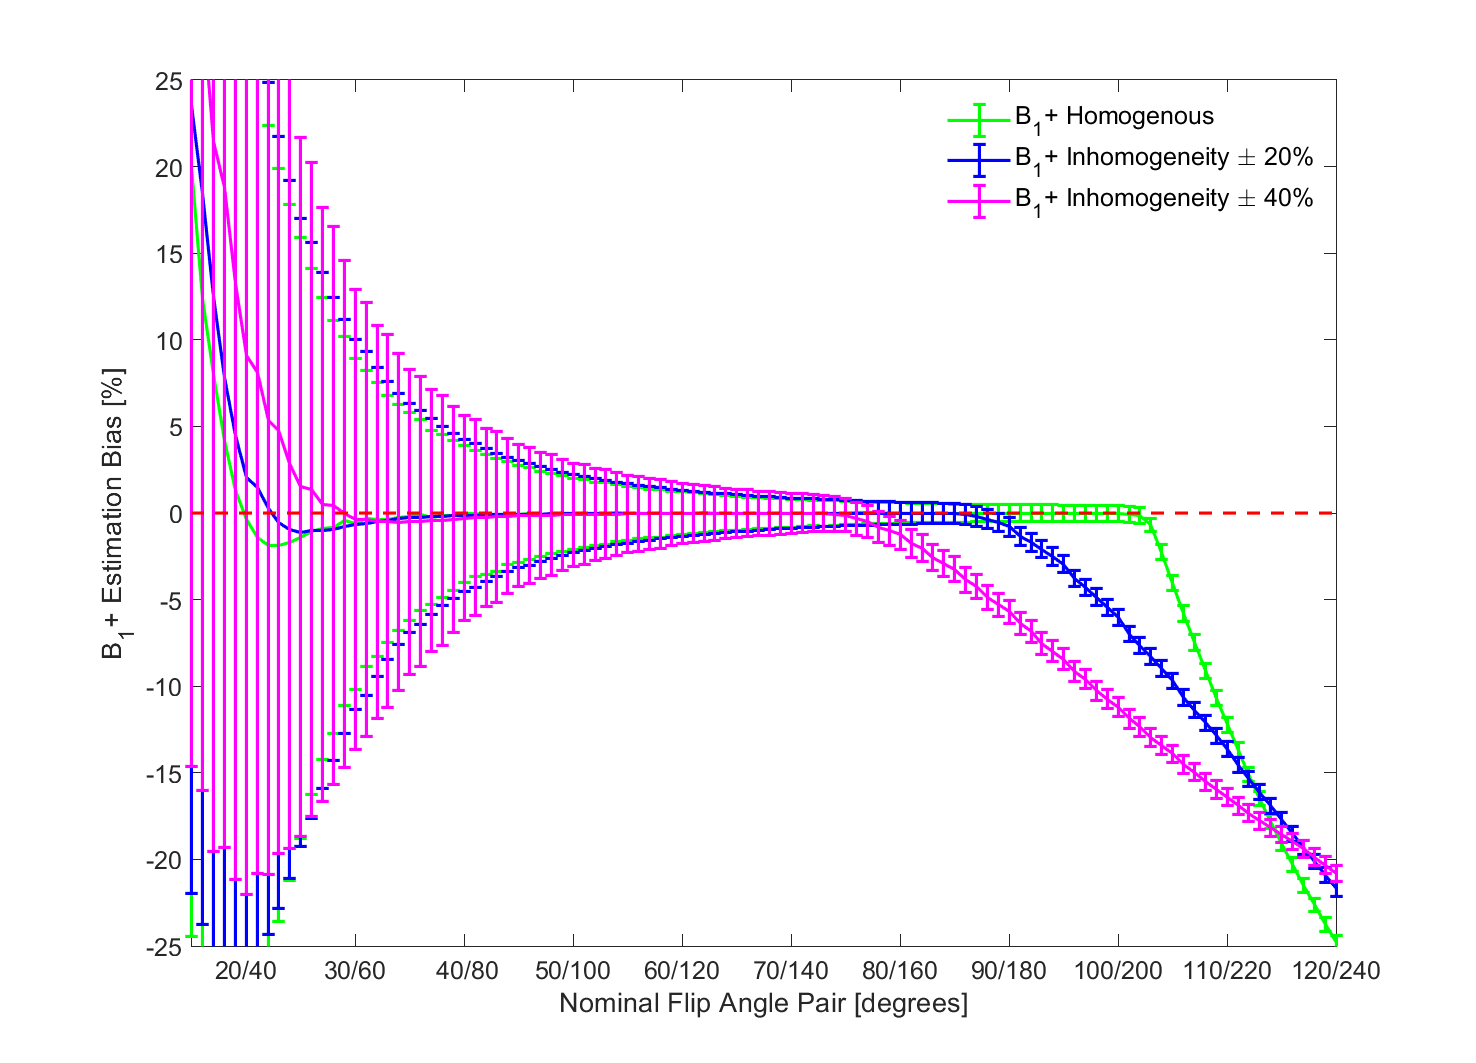
Figure 3 illustrates the mean B1+ bias for the GRE-EPI pulse. The slice profile effect generates a 6% underestimation of B1+ for 60°, becoming progressively worse for larger angles. This leads to overestimation of T1 values. Correcting for slice profile effects eliminates this bias (Figure 4). The suggested lower bound nominal FA pair for B1+ variations up to 40% is 43°/86° to maintain the uncertainty in B1+ estimation below 5%. The upper boundary is 74°/148°, above which the mean B1+ estimate diverges. These recommended FA pairs are valid for this specific excitation pulse profile and scanner FA calibration.
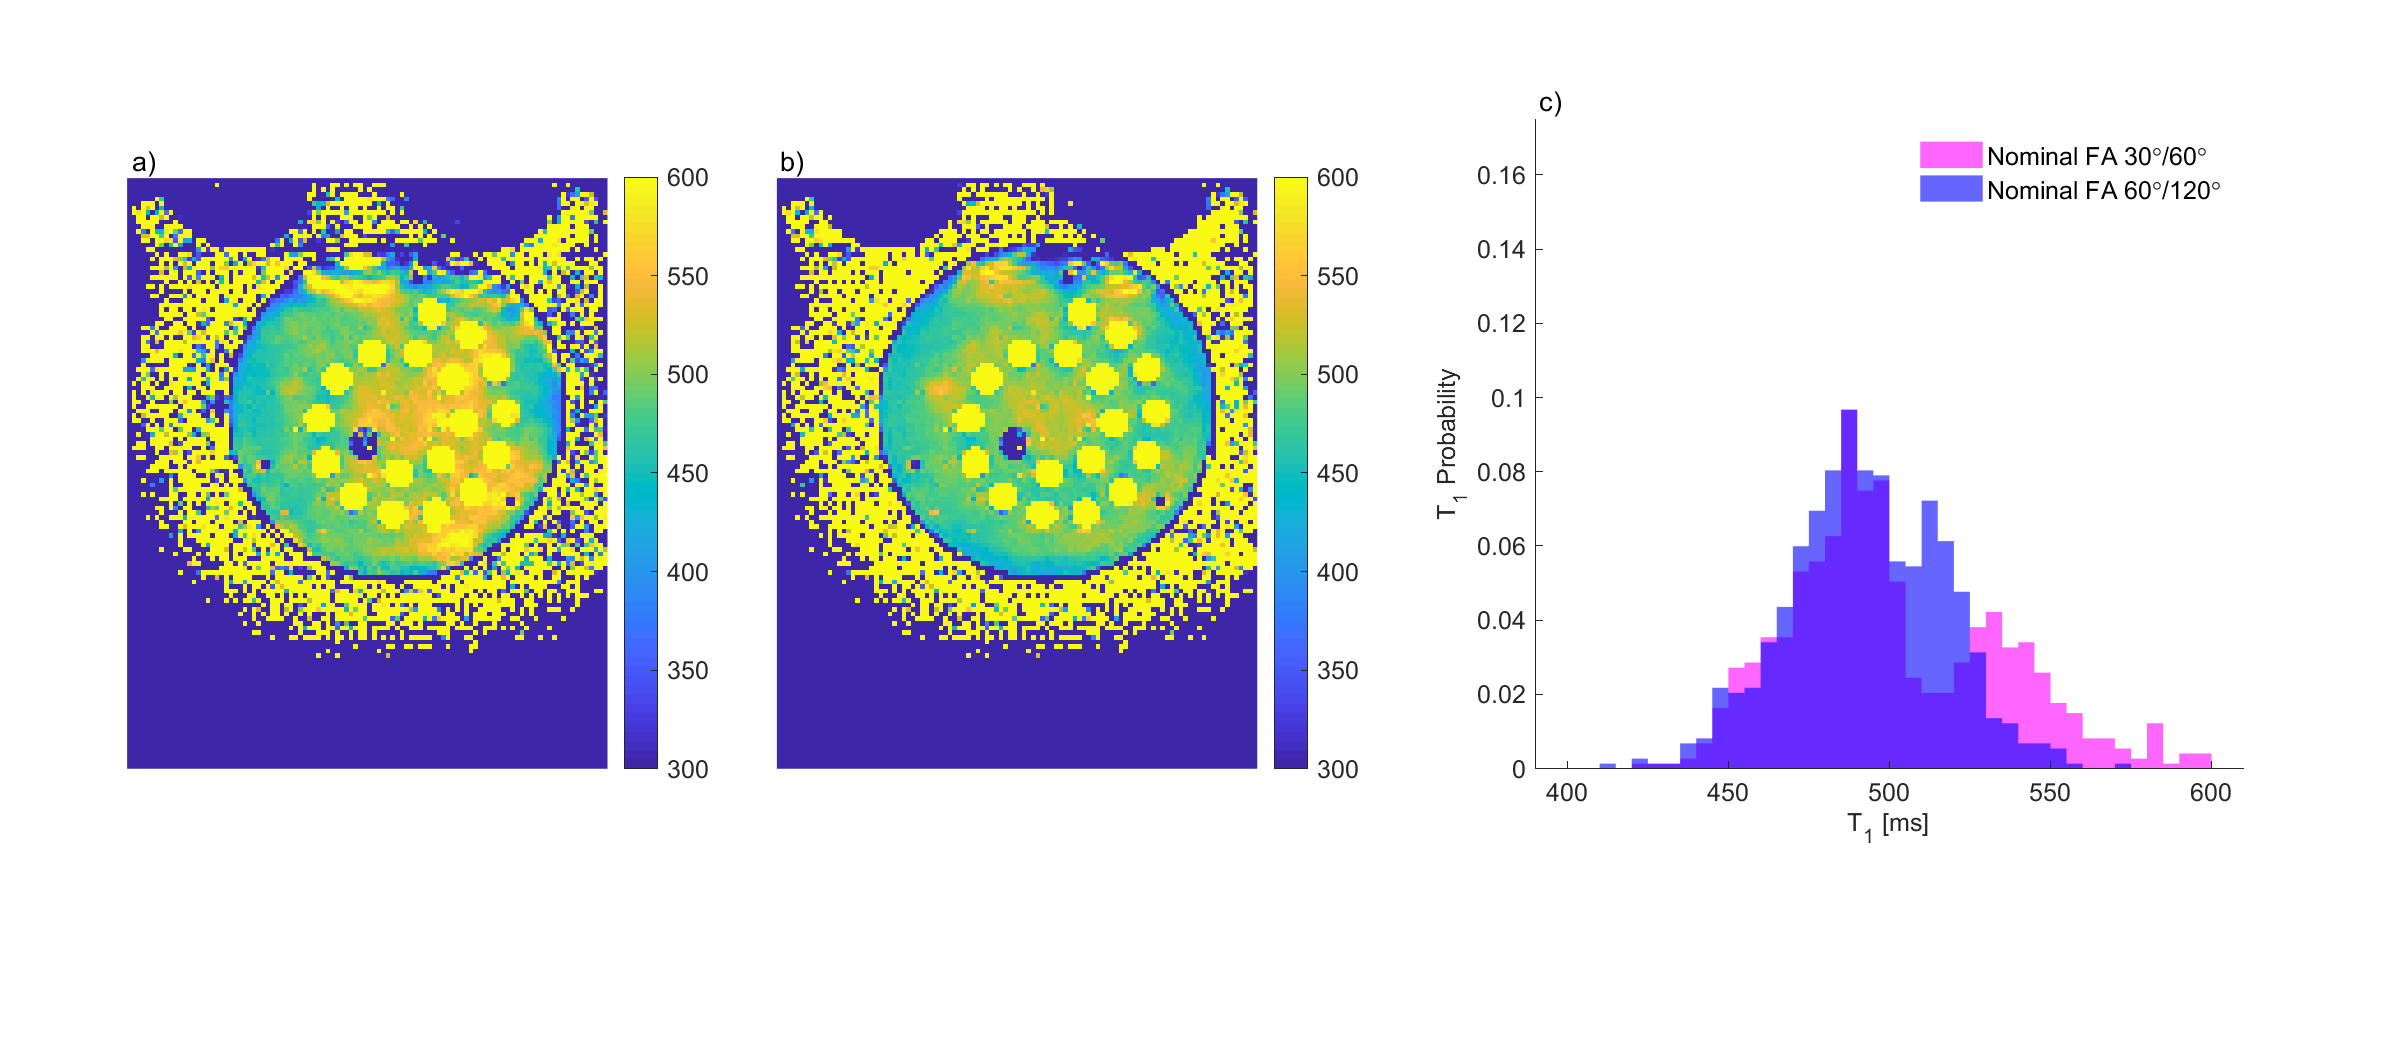
The phantom T1 with B1+ corrections determined from nominal FAs of 30°/60° (Figure 5 a)) have a broader distribution (501±33ms) than that determined from nominal FAs of 60°/120° (493±24ms) (Figure 5 b)), consistent with the simulations. Figure 5 c) displays the T1 value histogram for these FA pairs, with mean consistent with the gold standard T1 value (496±9ms).
Conclusion
Slice profile corrections are essential when applying 2D multi-slice GRE-EPI to map B1+ and obtain accurate VFA T1 values. We propose a nominal FA range of 43°/86° and 74°/148° for mapping B1+ at 40% inhomogeneity with this sequence. Further studies will be performed in phantoms and in vivo to compare VFA T1 mapping with this B1+ correction method to existing inversion recovery T1 mapping techniques such as MOLLI and SASHA.Acknowledgements
This work was supported by funding from the Engineering and Physical Sciences Research Council (EPSRC) and Medical Research Council (MRC) [grant number EP/L016052/1] and the NIHR Oxford Biomedical Research Centre.
The authors would like to thank Aaron Hess and John McGonigle for useful discussions as well as Ferenc Mozes for providing the phantom.
References
1. Jiru F., Klose U. Fast 3D radiofrequency field mapping using echo-planar imaging. Magn. Reson. Med. 2006; 56(6): 1375–1379
2. Dowell N., Tofts P. Fast, accurate, and precise mapping of the RF field in vivo using the 180° signal null. Magn. Reson. Med. 2007, 58(3): 622–630.
3. Morrell G. A phase-sensitive method of flip angle mapping. Magn. Reson. Med. 2008, 60(4): 889–894.
4. Sacolick L., Wiesinger F., Hancu I., et al. B1 mapping by Bloch-Siegert shift. Magn Reson Med. 2010; 63(5): 1315–1322.
5. Yarnykh V. Actual flip-angle imaging in the pulsed steady state: A method for rapid three-dimensional mapping of the transmitted radiofrequency field Magn. Reson. Med. 2007; 57(1): 192–200
6. Stollberger R., Wach P. Imaging of the Active B1 Field in Vivo Magn. Reson. Med. 1996; 35(2): 246-251
7. Parker G., Barker G.,Tofts P. Accurate Multislice Gradient Echo T1 Measurement in the Presence of Non-ideal RF Pulse Shape and RF Field Nonuniformity Magn. Reson. Med. 2001; 45(5): 838-845
Figures