4494
Impact of registration on multi-parametric breast MRI data and parameters: Qualitative and Quantitative Assessment1Centre for Biomedical Engineering, Indian Institute of Technology Delhi, New Delhi, India, 2Department of Computer Science and Engineering, Indian Institute of Technology Delhi, New Delhi, India, 3C-DOT India, Delhi, India, 4Center for Magnetic Resonance & Optical Imaging, University of Pennsylvania, Philadelphia, PA, PA, United States, 5Department of Radiology, Fortis Memorial Research Institute, Gurgaon, Haryana, New Delhi, India, 6Department of Biomedical Engineering, All India Institute of Medical Science, New Delhi, India
Synopsis
Multi-parametric(mp)-MRI data such as conventional MRI, DCE-MRI, DWI, etc. are routinely acquired for breast cancer patients. Any motion during mp-MRI data acquisition can affect qualitative as well as quantitative mp-MRI results. In this study, impact of registration on mp-MRI data as well as on quantitative parameters was evaluated qualitatively and quantitatively. Study included mp-MRI data of 40 patients with breast cancer. B-spline based registration performed better than Affine and SyN. It showed highest dice-coefficient, correlation coefficient. It also provided better histograms of quantitative maps and provided lowest sum-of-squared error in signal-intensity curves from ROI at edge and center of lesion.
Introduction:
Multi-parametric(mp)-MRI data is routinely acquired for breast cancer patients. Along with conventional-MRI(PD-weighted(W),T1-W,T2-W images),dynamic-contrast-enhanced(DCE)-MRI and diffusion-weighted(DWI) images, etc. are termed as mp-MRI1. The combination of mp-MRI data is also being used for several application like segmentation, quantitative analysis, classification, etc2. During acquisition of DCE-MRI data at different time points and DWI-MRI at different b-values, some motions might occur. Quantitative analysis of DCE-MRI requires T1-map, which require acquisition of multiple images depending upon type of technique used3. Recently, machine-learning application for improved diagnosis and grading, are being explored using features extracted from mp-MRI data4,5. However, any motion during the acquisition of mp-MRI can also affect the accuracy of diagnosis. In a recently reported study, the impact of different registration methods was evaluated qualitatively on DCE-MRI data6. The objective of proposed study was to evaluate the impact of registration methods on mp-MRI data(T1-W, T2-W, PD-W, DCE and DWI) as well as on quantitative parameters using qualitative and quantitative evaluation. The performance of various registration methods was evaluated using validation methods like Dice-coefficient, correlation, absolute-relative-error(%) and sum-of-squared-intensity-differences(SSD).Methods:
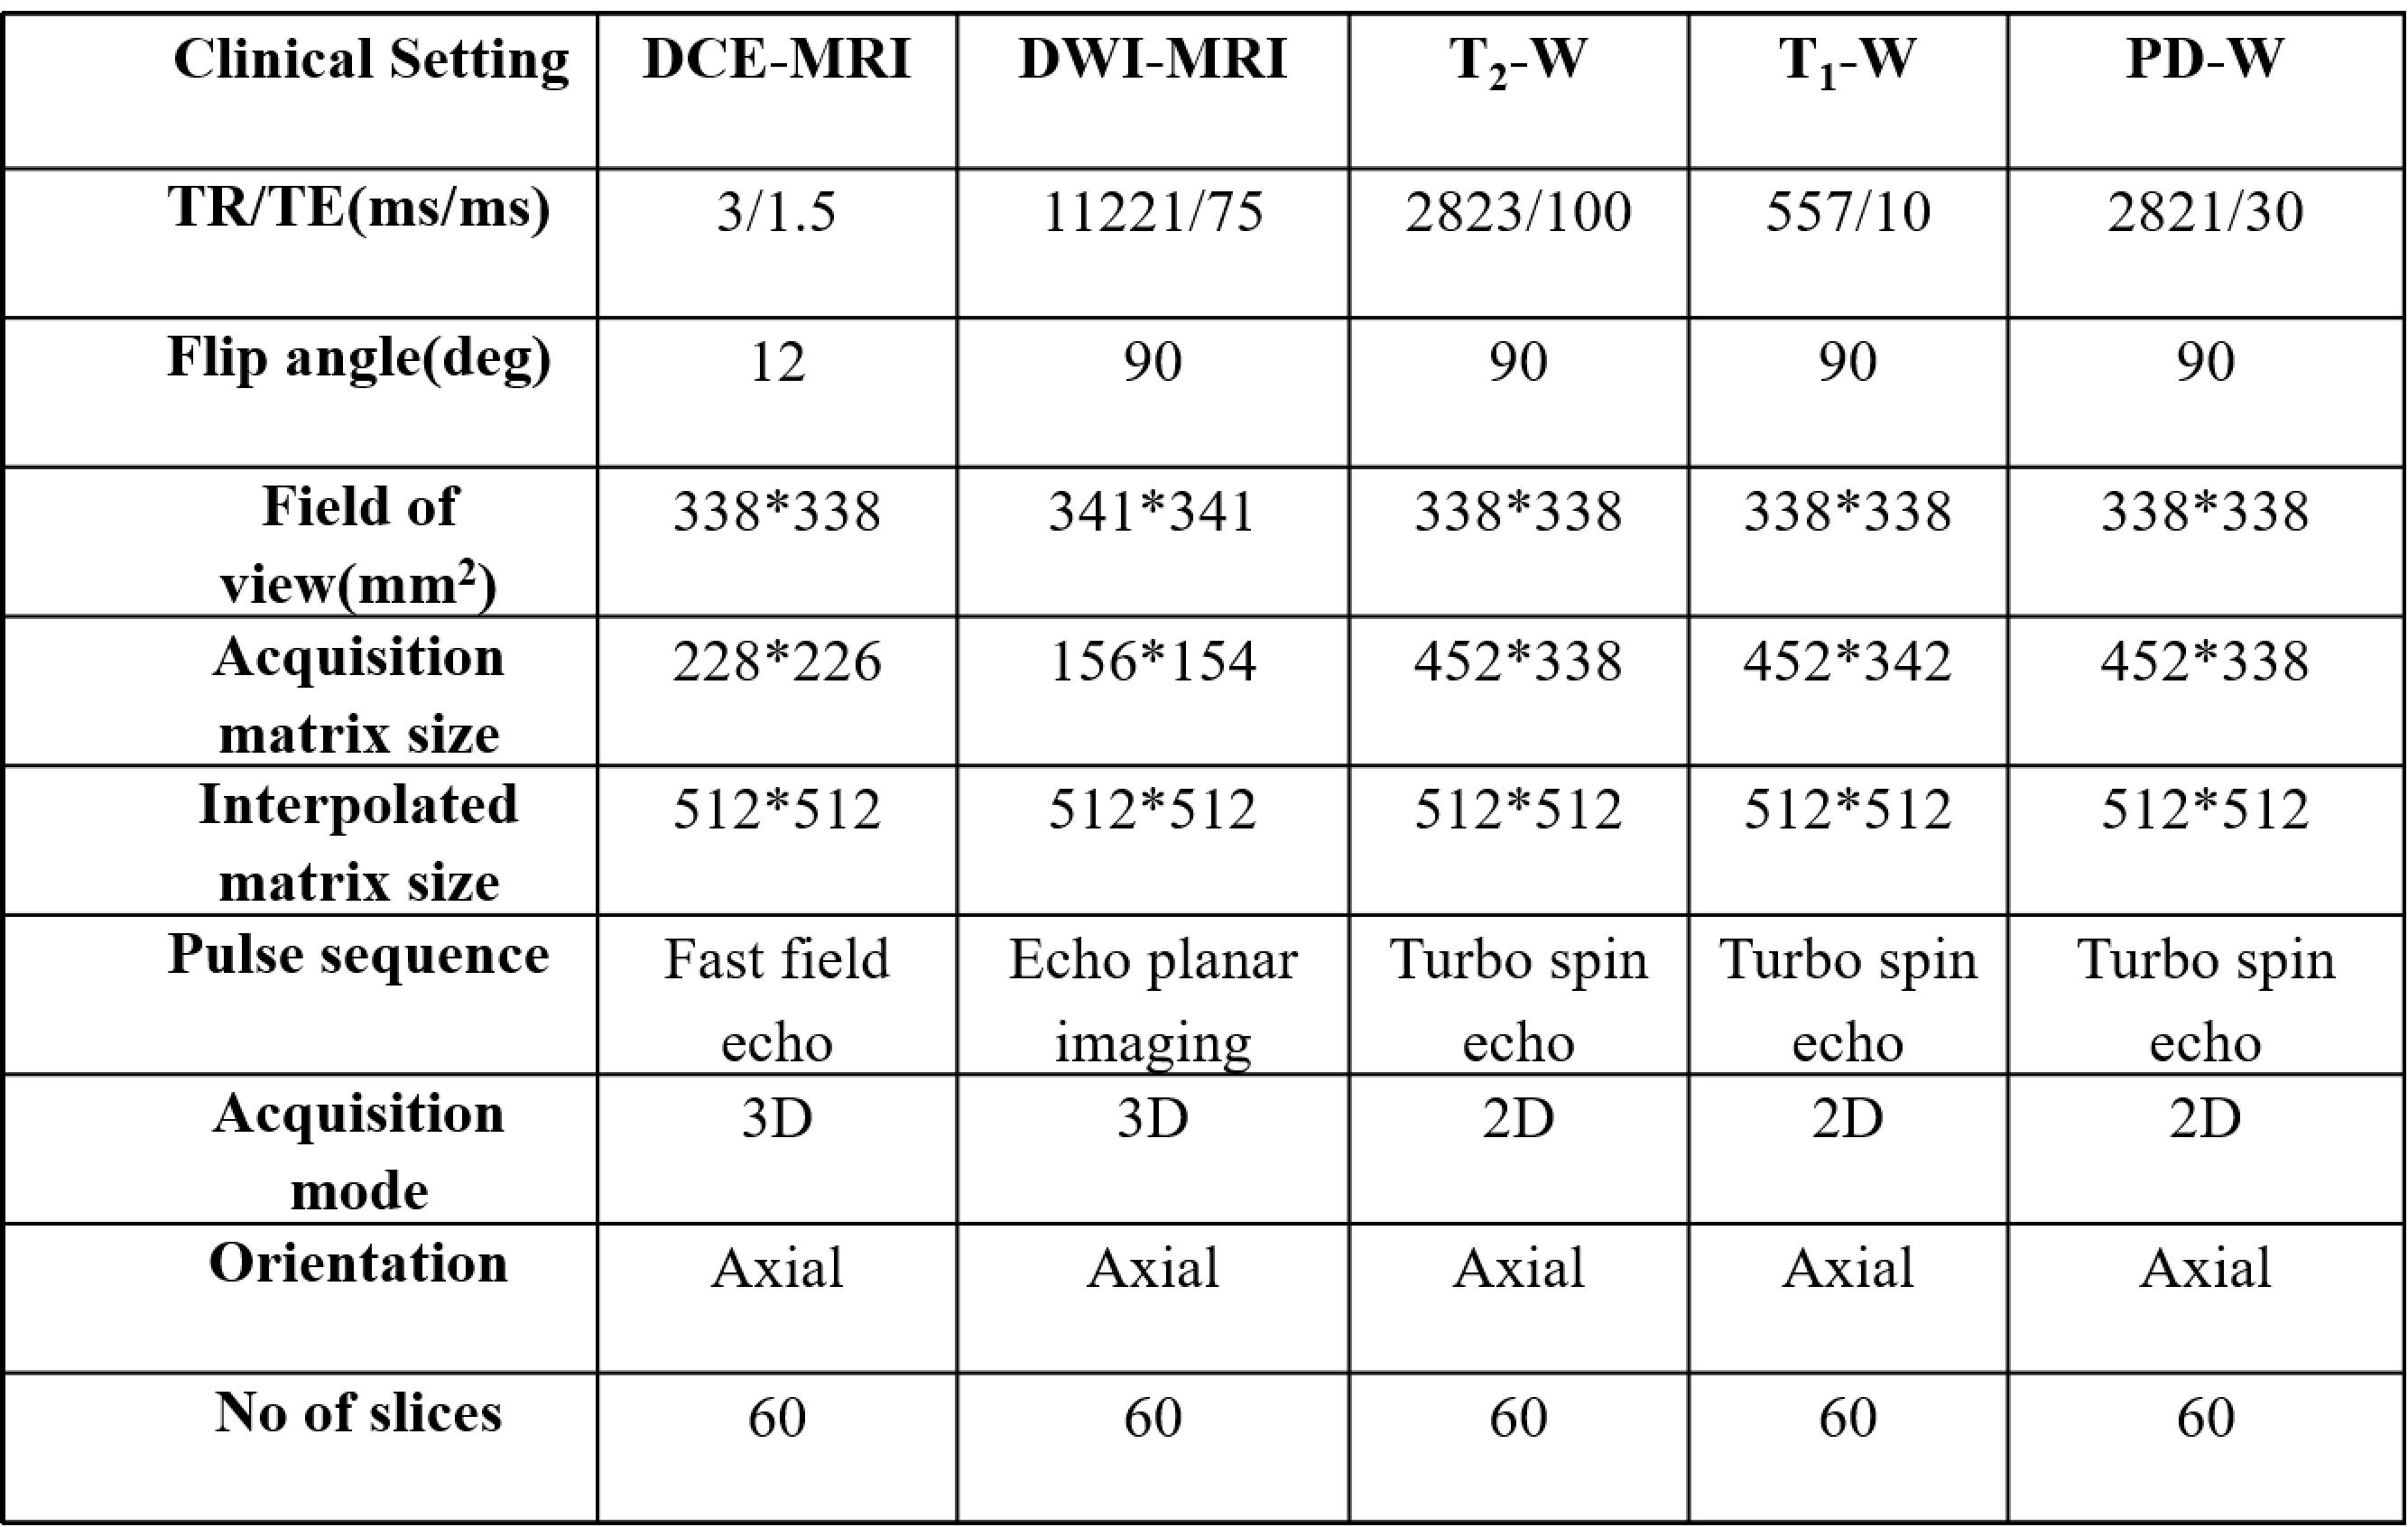
MRI experiments were performed at 3T MRI(Philips-Healthcare,The Netherlands) using 7-channel breast coil. Breast mp-MRI data of 40-female patients were included. Protocol included conventional-MRI(T1-W,T2-W,PD-W), DWI and DCE-MRI data(Table-1). DWI was performed using EPI-sequence with different b-values(0,200,400,600,1000,1200,1500s/mm2). DCE-MRI was performed using a 3-D fast-field-echo-sequence(40-dynamics, 5.4-seconds temporal-resolution).
Data processing: Breast MRI data were registered using Affine-registration and NRR methods(B-Spline7 and SyN8). The first time-point(pre-contrast) in 3D-image stack of DCE-MRI sequence(as reference) was used to register conventional images, subsequent 3D-image stacks of DCE-MRI at different time-points. Additionally, registration was also performed using DWI images at b0(as reference) and subsequent images of 3D stacks of DWI-MRI at the different b-values(as moving images). Data were analyzed before and after registration (different methods). T1-W, T2-W and PD-W images were used for computing T1 maps3. Generalized-tracer-kinetic model3 was used for computing Ktrans, Ve and Vp maps from DCE-MRI data. ADC map was computed from DWI-data9. Registration results were assessed using Dice-coefficient, correlation and SSD. SSD was computed from signal-intensity(SI) curves of DCE as well as DWI-MRI data. Additionally, the absolute-relative-error(%) was also computed from representative Ktrans, Ve, ADC, T1 map and T2-W images.
Results:
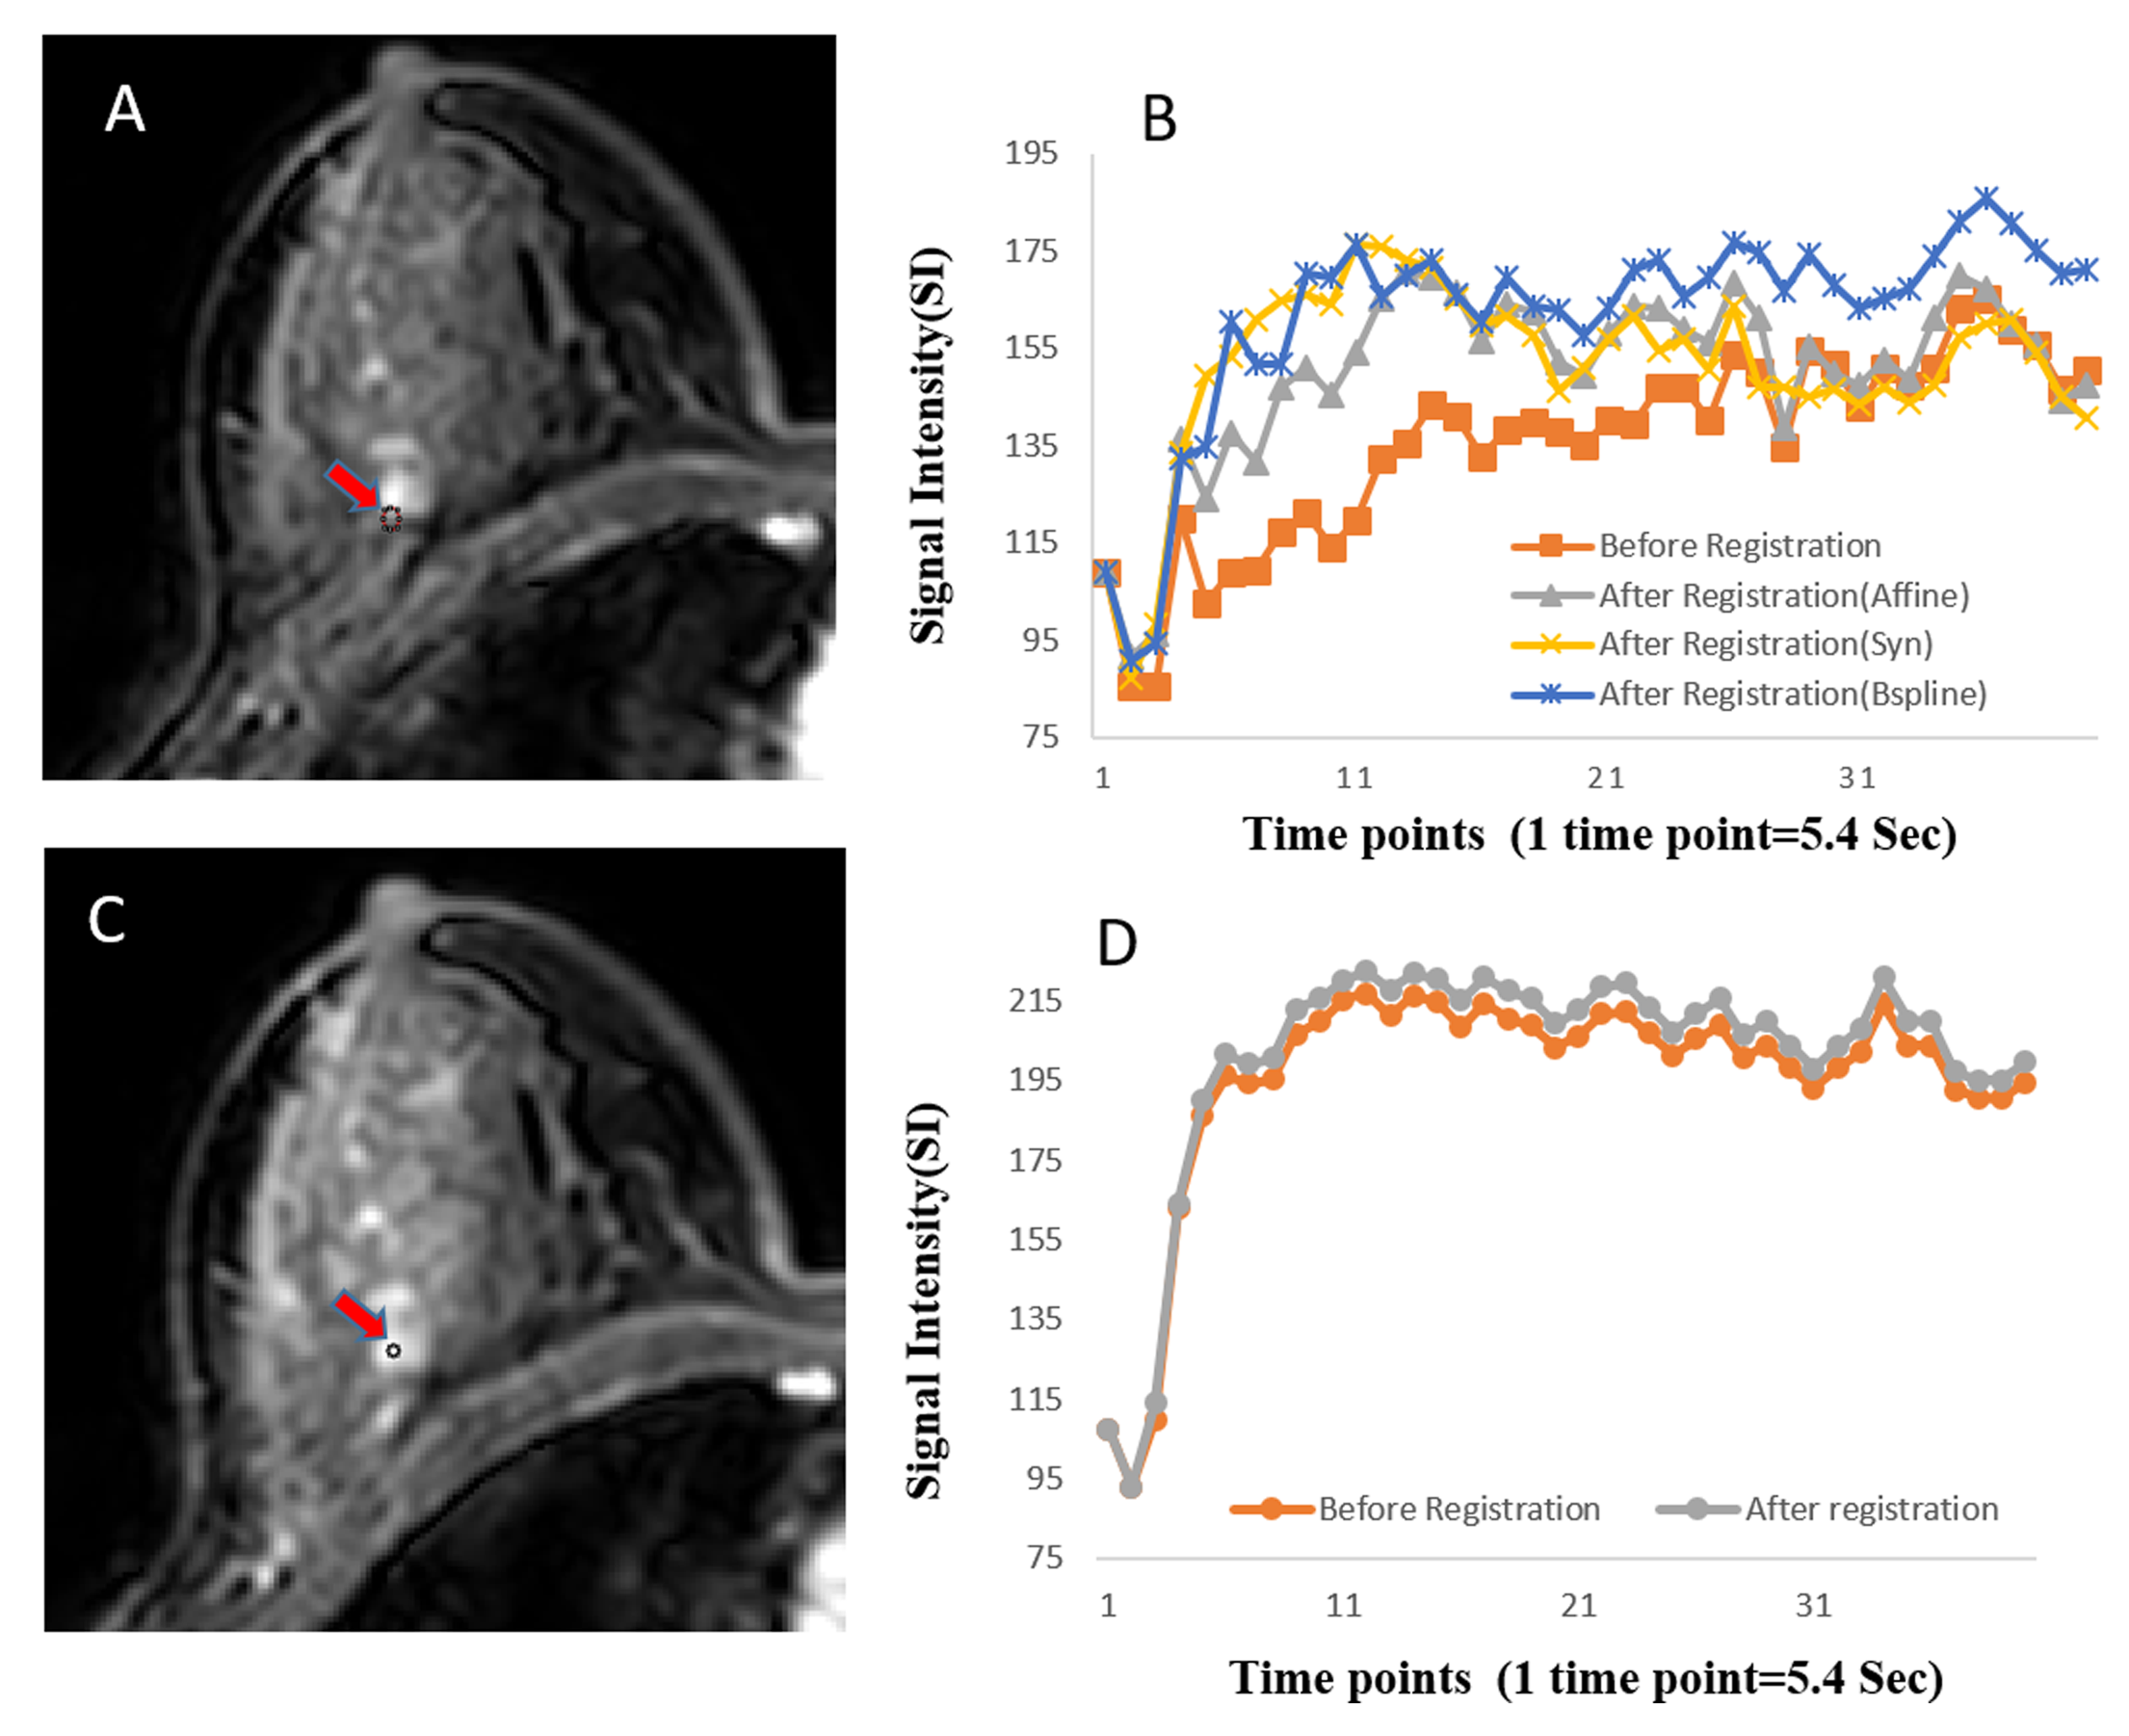
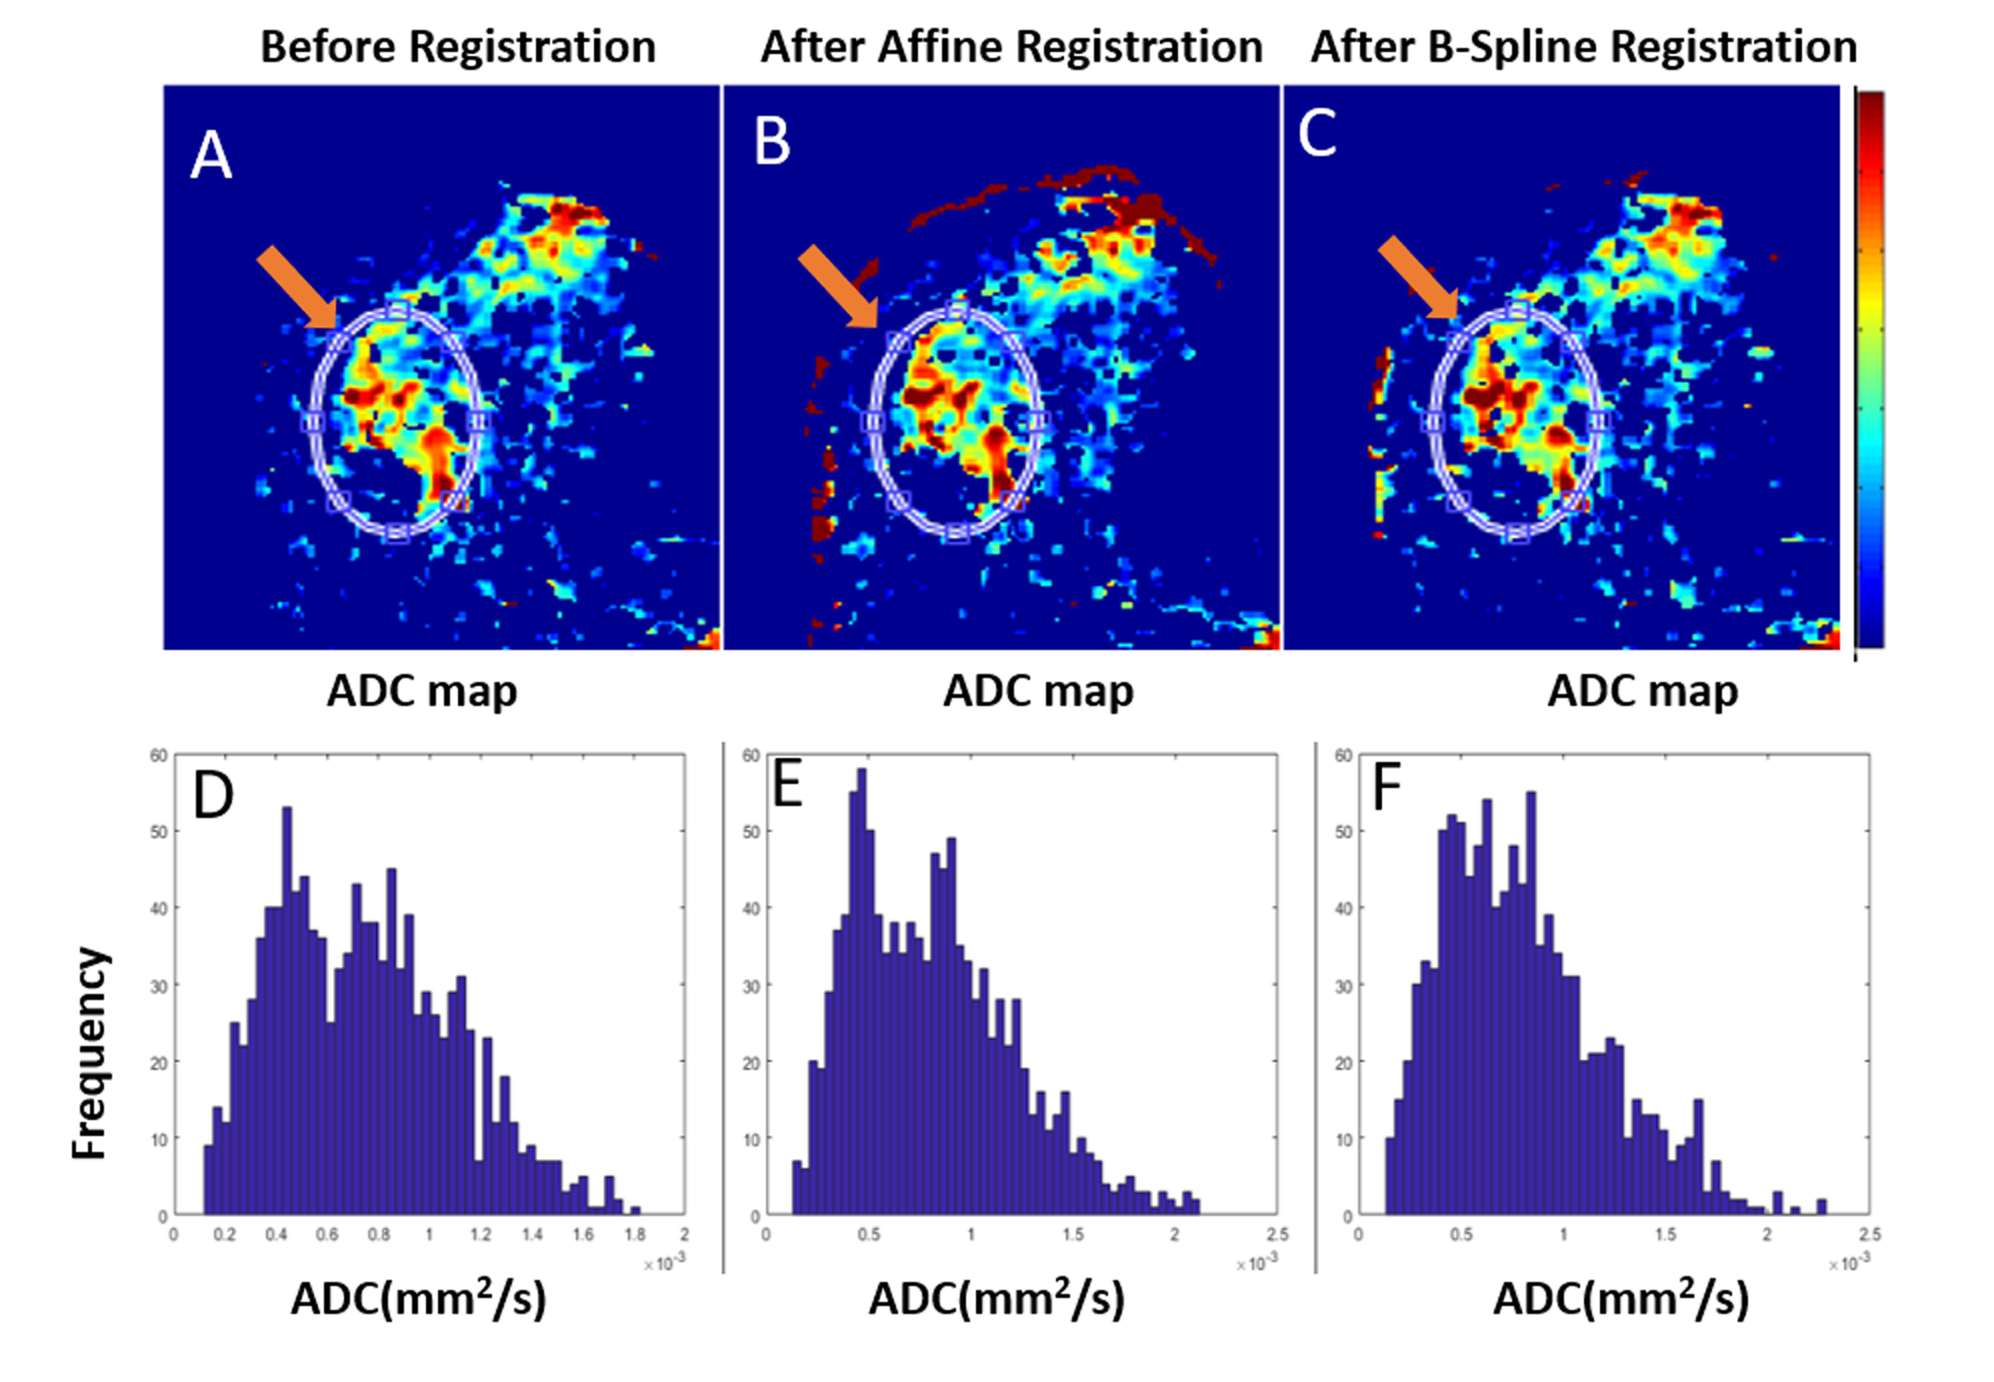
B-spline-method showed highest Dice-coefficient(98.06±1.30% for entire and 91.2±1.53% for tumor-ROI) for DCE-MRI data. Same method also showed highest Dice-coefficient(99.1±1.28% for entire and 92.4±1.2% tumor-ROI) for DWI data. The correlation-coefficient of 0.99 was observed before and after registration(B-splines) in both DCE-MRI and DWI-MRI data which is similar to Affine and SyN method in the homogeneous area. Among all these methods for DCE-MRI, B-spline provided the highest correlation-coefficient(0.90) and lowest SSD(6.56) between SI-curve from boundary voxels and center/homogenous region of the tumor as compared to Affine(Correlation-coefficient:0.89 and SSD:8.38) and SyN(Correlation-coefficient:0.89 and SSD:8.20) in our cohort. In case of DWI-MRI, B-spline also provided the highest correlation-coefficient(0.998) and lowest SSD(18.67) as compared to Affine(Correlation-coefficient:0.997 and SSD:19.04) and SyN(Correlation-coefficient:0.998 and SSD:19.14) in our cohort(Figure-1 and 2). Figure-3 and 4 show quantitative maps(Ktrans and ADC maps) of DCE and DWI-MRI data respectively before and after registration using Affine and B-spline methods. The histogram of Ktrans and ADC map from a tumor ROI after B-spline registration was smoother as compared to before and Affine-registration as shown in Figure-3 and 4. Therefore, the improvement of ADC and Ktrans after registration signifies the need of motion correction before quantitative analysis.Discussion:
B-spline method(high-correlation and low-SSD) was better than Affine and SyN at correctly aligning breast mp-MRI images in our cohort. This study has proposed a new registration evaluation method for DCE and DWI data, in which SI-curves of voxels in the center of the tumor(homogeneous region) is used. SI-curve from homogenous area is less prone to motions than heterogeneous areas in breast. The absolute-relative-error between before and after registration for various maps as shown in Table-2 were varied due to three reasons:(1)motions in conventional MRI which propagates error in T1 map, Ktrans and Ve maps, (2)motion occurs during the acquisition of DCE-MRI and DWI-MRI at different time-points and b-values respectively, and (3)motions can occur both in conventional MRI and during the acquisition of DCE-MRI or DWI. Therefore, any motion during the acquisition of mp-MRI can also affect the accuracy of diagnosis and other applications. Further studies are required to evaluate clinical significance of these changes due to registration on mp-MRI data and parameters.Conclusion:
There were substantial motions in the mp-MRI data, which affected shapes of SI curves as well as introduced errors in the quantitative parameters. These errors might influence diagnosis and grading of breast cancer.Acknowledgements
The authors acknowledge an internal funding support from IIT-Delhi. Authors acknowledge support of Philips India Limited and Fortis Memorial Research Institute Gurugram in MRI data acquisition.References
[1] Rahbar H, Partridge SC. Multiparametric Breast MRI of Breast Cancer. Magn Reson Imaging Clin N Am 2016;24:223–38.
[2] Pinker K, Helbich TH, Morris EA. The potential of multiparametric MRI of the breast. Br Inst Radiol 2017;90:1–17.
[3] Singh A, Haris M, Rathore D, Purwar A, Sarma M, Bayu G, et al. Quantification of physiological and hemodynamic indices using T1 dynamic contrast-enhanced MRI in intracranial mass lesions. J Magn Reson Imaging 2007;26:871–80.
[4] Pinker K, Baltzer P, Bogner W, Leithner D, Trattnig S, Zaric O, et al. Multiparametric MR Imaging with High-Resolution Dynamic Contrast-enhanced and Diffusion-weighted Imaging at 7 T Improves the Assessment of Breast Tumors: A Feasibility Study. Radiology 2015;276.
[5] Aribal E, Asadov R, Ramazan A, Ümit M. Multiparametric breast MRI with 3T : Effectivity of combination of contrast enhanced MRI , DWI and 1H single voxel spectroscopy in differentiation of Breast tumors. Eur J Radiol 2016;85:979–86.
[6] Subhajit Chatterjee, Snekha Thakran , Rakesh Kumar Gupta , and Anup Singh, Influence of Parameter Optimization and Segmentation on the Accuracy of Various Registration Approaches for Multi-parametric 3D Breast MRI Data. Proc. Intl. Soc. Mag. Reson. Med. 26 (2018) 2681.
[7] Wang H, Zheng B, Good W, Zhuang T ge. Thin-plate spline based automatic alignment of dynamic MR breast images. Annu Int Conf IEEE Eng Med Biol - Proc 2000;4:2850–3.
[8] Avants BB et al. Symmetric dieomorphic image registration with cross-correlation: evaluating automated labelling of elderly and neurodegenerative brain (2008).
[9] Guo Y, Cai Y-Q, Cai Z-L, Gao Y-G, An N-Y, Ma L, et al. Differentiation of clinically benign and malignant breast lesions using diffusion-weighted imaging. J Magn Reson Imaging 2002;16:172–8.
Figures