4486
Self-navigated bulk motion detection for feed and wrap renal dynamic radial VIBE DCE-MRI1Radiology, Boston Children's Hospital, Boston, MA, United States, 2Harvard Medical School, Boston, MA, United States, 3Siemens Healthcare GmbH, Erlangen, Germany, 4Urology, Boston Children's Hospital, Boston, MA, United States
Synopsis
Dynamic Radial VIBE (DRV) DCE-MRI allows to image with sufficient spatio-temporal resolution for functional imaging of kidneys. However, fast movements of babies during the scan corrupt individual lines in k-space and severely compromise the quality of the reconstructed images and limits the clinical utility of non-sedated imaging. In this work, we evaluate a self-navigated bulk motion detection approach to identify these corrupted lines. We applied this approach on non-sedated infants undergoing feed-and-wrap DCE-MRI with DRV. Our results show that this approach correctly identifies the bulk motion and allows for post-processing correction of the DCE absorption curves.
Introduction
In order to determine which babies with antenatally detected hydronephrosis will benefit from intervention, clinicians need measures of glomerular filtration rate (GFR) of each kidney and differential renal function (DRF). Motion-robust radial Dynamic Contrast Enhanced (DCE) MRI using feed and wrap imaging technique can provide GFR and DRF measures for babies without sedation [1].
Dynamic Radial VIBE (DRV) sequence is capable of attaining the desired spatio-temporal resolution required to capture fast dynamics of arterial input function [2], however, it is severely affected by sudden bulk motion of the subjects. To mitigate its impact, it is key to detect which lines in the k-space measurements have been compromised and discard them during the image reconstruction and realign the misaligned volumes back into their original position.
Here, we evaluate an approach to detect the presence of bulk motion for each k-space line and identify which lines have been corrupted. We compare the motion events identified by the proposed method with another measure of motion evaluated on the reconstructed images. Finally, we show an example on how to use the detected bulk motion to correct for the DCE signal with post-processing.
Methods
14 infants (age 0-4 months months) were imaged with DCE-MRI after being fed, swaddled and rocked to sleep, without sedation. The images were acquired with a “stack-of-stars” 3D FLASH prototype sequence using a multi-channel body-matrix coil (3T Siemens Skyra/Trio, TR/TE/FA 3.56/1.39ms/12o, 32 coronal slices, voxel size=1.25x1.25x3mm, 1326 radial spokes acquired in 6 mins with golden angle radial ordering). The average temporal resolution was 3.3 sec.
We derived the bulk motion detection from the center of the k-space lines (FID) for each slice (i.e. center line of the k-space data in 3D, kx,ky=0) after computing the FFT along the slice direction [3]. We took the absolute value of each entry of the FID matrix (number of slices (S) x number of coils (C) x number of k-space radial lines (L)), normalized across radial lines and concatenated the values of all coil channels, resulting in a vector (of size C) per radial line and slice. We applied a moving average filter along the radial line (or temporal) dimension with window length of 3.3 secs. We then computed the average correlation coefficient of each vector at radial line 't' against all its neighboring radial lines within a window of length 3.3 sec (34 radial lines) [4,5]. A motion-event was detected at radial line t when the resulting correlation coefficient (CC) was smaller than 0.99 for any slice. Figure 1 shows example plots of the 1-CC, as well as the binary masks of bulk motion events detected.
To evaluate the approach, we compared the detected motion events per radial line against the relative error between consecutive reconstructed volumes at low temporal resolution (6.6 sec). To determine the presence of bulk motion using this metric, we thresholded it at 0.05. Finally, we computed the average time intensity curves for left and right kidneys before motion-detection. Then, we post-processed the initial curve by removing the temporal samples corrupted by the detected bulk motion events and linearly interpolated the values for the removed samples.
Results
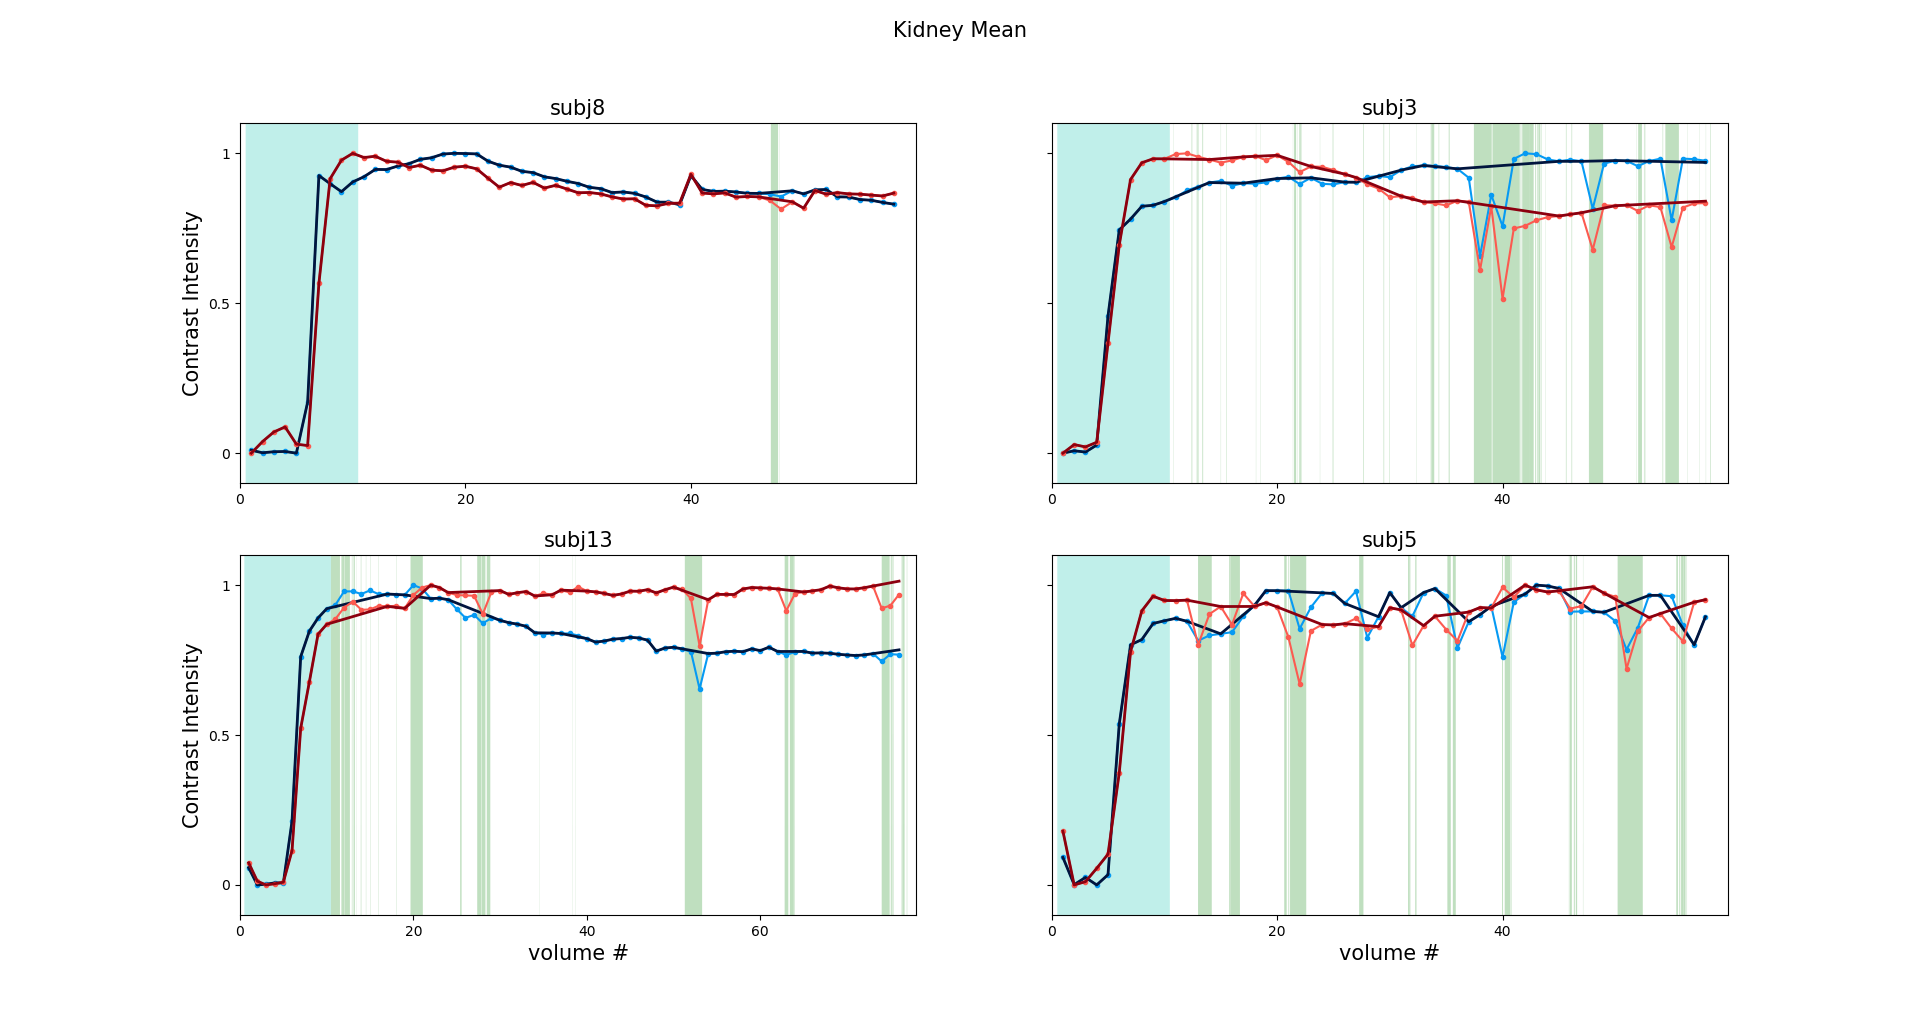
Figures 2 compares the bulk motion derived from the reconstructed volumes against the motion events detected by our approach using FIDs. The results show good correspondence between increased relative error during movements of the kidneys and motion events detected by the FIDs. To evaluate this similitude, we computed the percentage of time with detected motion using both metrics and show their agreement in the correlation and Bland Altman plots in Figure 3. We illustrate the loss in image quality during detected motion events with representative image reconstructions in Figure 4. Lastly, Figure 5 shows the DCE time intensity curves before and after removal of motion affected samples.Conclusion
We presented a method to detect samples affected by bulk motion from the center line of the k-space data. The detected motion-events (~100ms) correlate well with the alternative measure of motion calculated from image space, obtained at lower temporal resolution (~6.6sec vs. ~100ms). Detection of motion allowed us to improve the DCE time intensity curves using simple post-processing approaches. This approach will further allow to improve the image reconstruction through rejection of individual corrupted k-space lines. This method will potentially enable non-sedated DCE-MR imaging of babies with hydronephrosis for evaluation of their kidney function.Acknowledgements
This work was supported by Boston Children’s Hospital Translational Research Program Grant 2018 and Society of Pediatric Radiology Young Investigator Grant 2016.References
- S. Kurugol, O. Afacan, C. Seager, R. S. Lee, J. S. Chow, and S. K. Warfield, “Compensating for Bulk Motion in Feed and Wrap Renal Dynamic Radial VIBE DCE-MRI using Bulk Motion Removal and Non-Rigid Registration,” Int. Soc. Magn. Reson. Med., no. Mc, pp. 72–74, 2018.
- Feng L, Grimm R, Tobias Block K, et al. Golden-angle radial sparse parallel MRI: Combination of compressed sensing, parallel imaging, and golden-angle radial sampling for fast and flexible dynamic volumetric MRI. Magn Reson Med. 2014;72: 707–717.
- Feng, L., Axel, L., Chandarana, H., Block, K.T., Sodickson,D.K. and Otazo, R., 2016. XD‐GRASP: Golden‐angle radial MRI with reconstruction of extra motion‐state dimensions using compressed sensing. Magnetic resonance in medicine, 75(2), pp.775-788. 5.
- B. Stemkenset al., “Adaptive bulk motion exclusion for improved robustness of abdominal magnetic resonance imaging,” NMR Biomed., vol. 30, no. August, p. e3830, 2017.
- T. E. Wallace, K. Pelkola, M. Dugan, S. K. War, and O. Afacan, “Pediatric Head Motion Detection using Free Induction Decay Navigators,” in International Society for Magnetic Resonance in Medicine (ISMRM), 2018, pp. 5–7.
Figures