4476
Data Consistency Driven Correction of B0-Fluctuations in 2D and 3D Gradient-Echo MRI of the SpineJakob Meineke1 and Tim Nielsen1
1Philips Research, Hamburg, Germany
Synopsis
We demonstrate the data-consistency driven determination and correction of B0-fluctuations induced by respiratory motion in 2D and 3D gradient-echo images of the cervical spine. By promoting data-consistency in the multi-channel raw data, it is possible to estimate the instantaneous off-resonance. Furthermore, we demonstrate a marked improvement in image quality by correcting the k-space data using the measured B0-fluctuations.
Introduction
Gradient-echo MRI is sensitive to spatio-temporal variations of the B0-field (off-resonance). This is one of the main obstacles for high-field spinal cord imaging [1], where the fluctuations of the B0-field induced by respiratory motion in the chest can lead to pronounced ghosting artifacts and intensity modulations. Previously, we have described a method, dubbed consistency-navigation, to estimate B0-fluctuations directly from the inconsistency they produce in 3D multi-channel raw data [2]. Here, we apply this method to gradient-echo imaging in the spine and extend it to multi-slice 2D acquisitions.Methods
2D and 3D gradient-echo images of the cervical spine of a healthy volunteer were acquired with written informed consent on a 3T scanner (Achieva, Philips, Best, The Netherlands) using four Flex coils arranged around the neck of the volunteer. Sequence parameters 2D gradient-echo: FOV (AP/RL): 201 mm × 201 mm, acquisition voxel 0.7 mm × 0.7 mm, slice thickness 5 mm, slice gap 4 mm, 11 slices, TR/TE1/ΔTE: 500/6.6/6.6 ms, 3 echoes, slices acquired in linear order in feet-head (FH) direction. Sequence parameters RF-spoiled 3D gradient-echo: FOV (AP/RL/FH): 201 mm × 201 mm × 104 mm, acquisition voxel 0.7 mm × 0.7 mm × 4 mm, TR/TE1/ΔTE: 36.8/6.6/6.6 ms, 5 echoes, profile order: zy-order. For reference purposes, a phase-navigator was interleaved into the 2D and 3D acquisition every 10 excitations to obtain an independent measure of the off-resonance fluctuation [2]. The 3D complex raw data were processed as described in Reference [2]. Briefly, images are reconstructed from the multi-channel k-space data using standard coil-combination and Fourier-transform. The resulting image is mapped back to k-space using the inverse transformation, i.e. by multiplying with the coil-sensitivities followed by FFT. Finally, the phase-angle of the complex ratio between the measured and the synthesized k-space data is computed. This phase-error is proportional to ΔB0 at the acquisition time of the respective k-space profile. An improved image can be reconstructed by using the estimated phase-error to correct the measured k-space data. To improve the SNR of the estimated B0-fluctuations, the complex ratio is averaged along the readout direction was performed (after FFT) and temporally adjacent phase-encoding profiles were averaged using a Gaussian low-pass filter with width=3*TR. For the 2D data, processing was performed analogously for each slice. However, since temporally adjacent profiles are now in different slice, we now average the computed ratio across neighboring slices using a Gaussian-low pass filter with a width of 1 slice. The above process was iterated for 30 iterations to ensure convergence.Results
For both 2D and 3D images a stable consistency-navigator signal could be derived, see Figure 1. Amplitudes of the B0-fluctuations are between 2 and 7 Hz depending on the distance to the chest, see Figure 2. As can be expected, this is significantly larger than the frequency fluctuations observed in the brain at 3T. Furthermore, correcting for the estimated phase-error induced by the B0-fluctuations leads to marked improvements in both 2D and 3D images, with reduced ghosting and removed intensity modulations, as well as better tissue delineation, see Figures 3 and 4. The rate of convergence was faster for 3D as compared to 2D data, with only tiny changes occurring after 10 (20) iterations for 3D (2D). The B0-fluctuations estimated from data consistency are in good agreement with the values estimated from the phase-navigator.Discussion
We have demonstrated the successful application of our previously described consistency navigator to 2D and 3D GRE imaging of the cervical spine. This is useful for improving robustness and image-quality of gradient-echo imaging in the spine and does not require modification of the sequence or additional hardware. The number of iterations needed for the method to converge is larger than for previous applications in the brain, most likely due to the smaller number of coil-elements, and, in the case of 2D imaging, the smaller number of profiles mixed during in the coil-combination process. Due to the arrangement of the coil elements around the neck of the volunteer, no information about the spatial variation of the B0-fluctuations in the FH-direction can be derived in the 3D case. The 2D data, in contrast, offer explicit spatial information via slice-excitation, leading to more complete correction of B0-fluctuation artifacts in this case.Acknowledgements
No acknowledgement found.References
1. Vannesjö et al, Spatiotemporal characterization of breathing-induced B0 field fluctuations in the cervical spinal cord at 7T, NeuroImage 167, 191 (2018)
2. Meineke and Nielsen, Data-Driven Determination and Correction of B0-fluctuations in Greadient-Echo MRI, ISMRM 2018
Figures
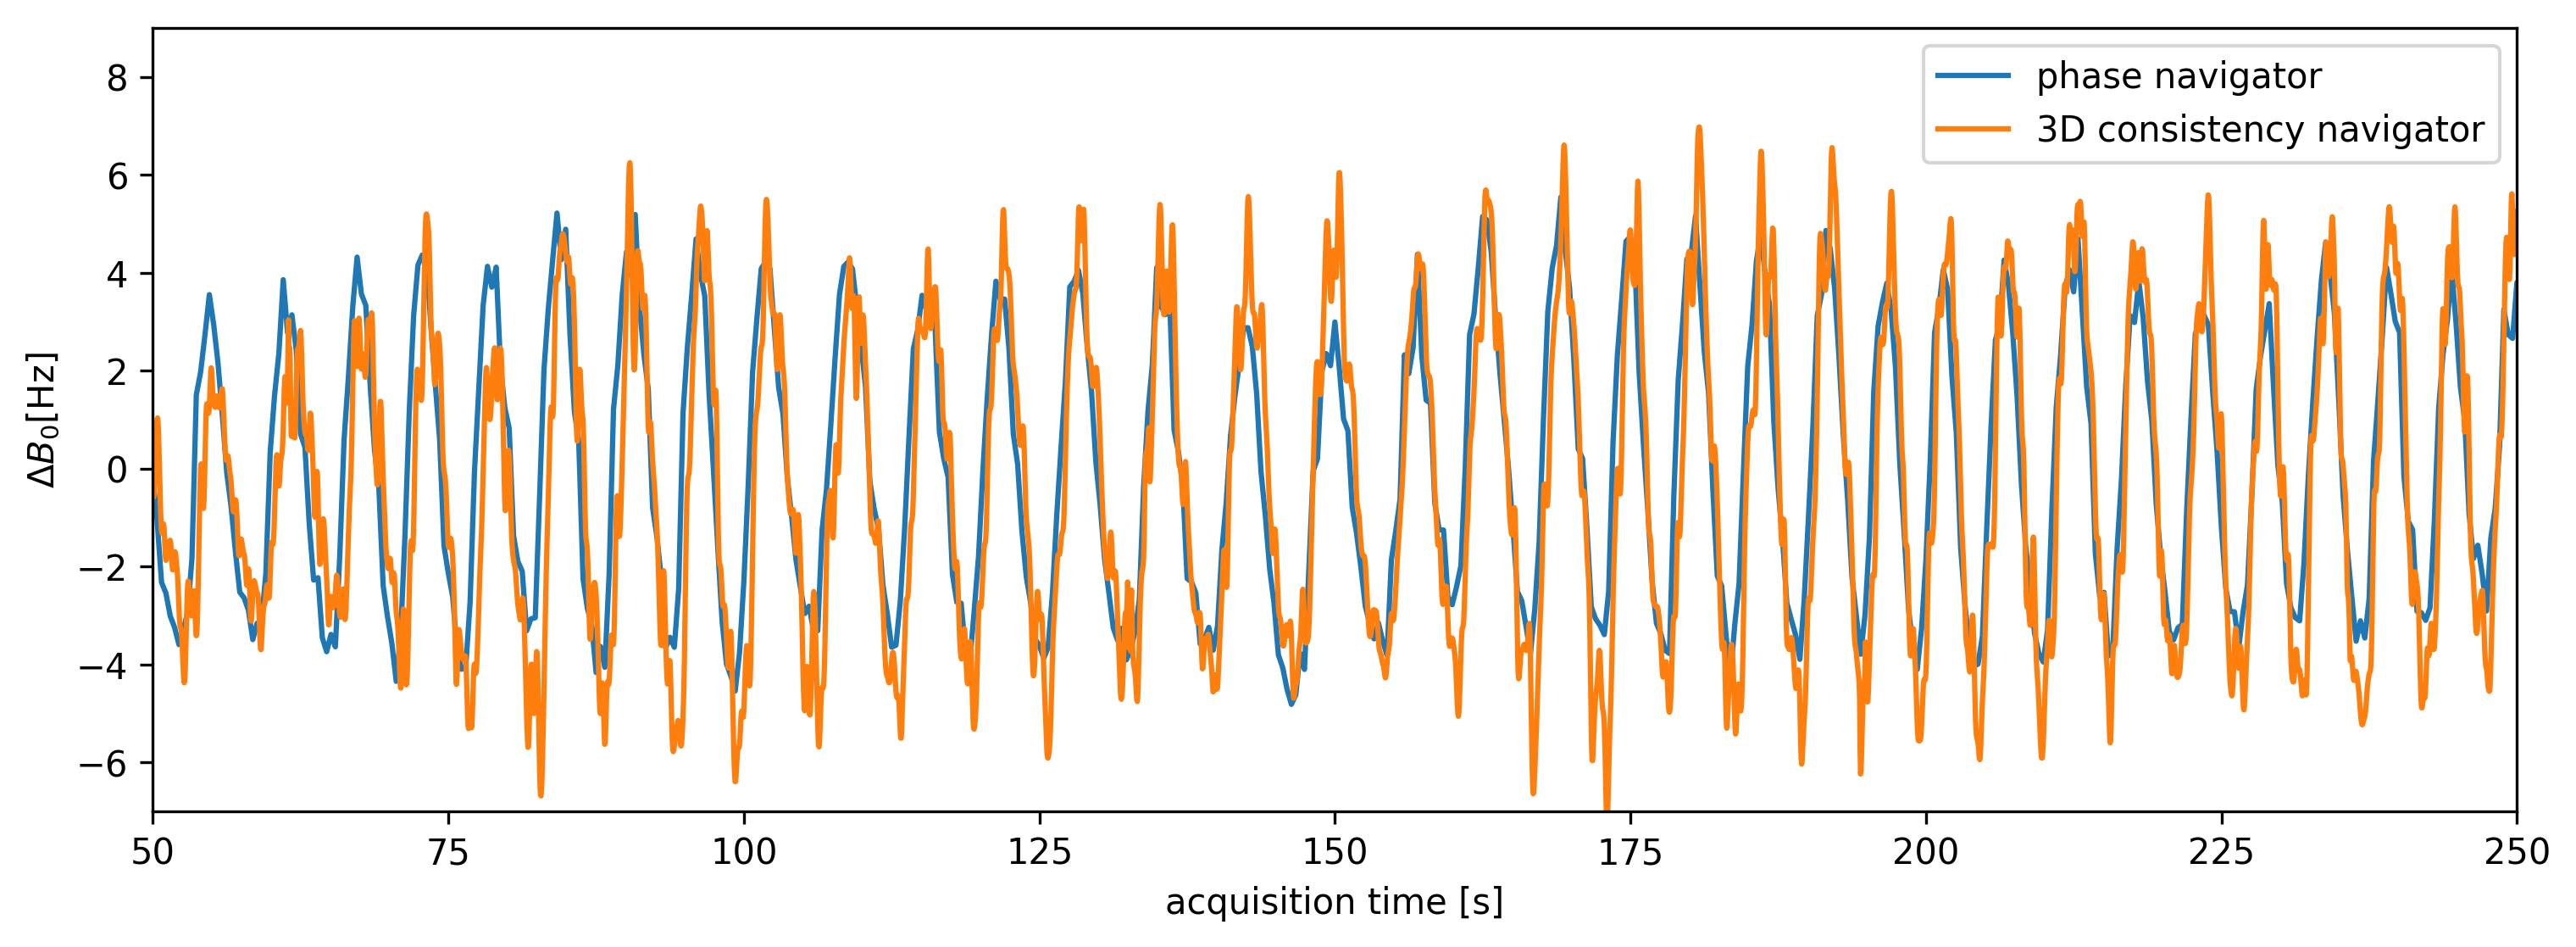
B0-fluctuations
derived using the consistency-navigator (orange) and the interleaved
phase-navigator (blue) from 3D gradient-echo data.
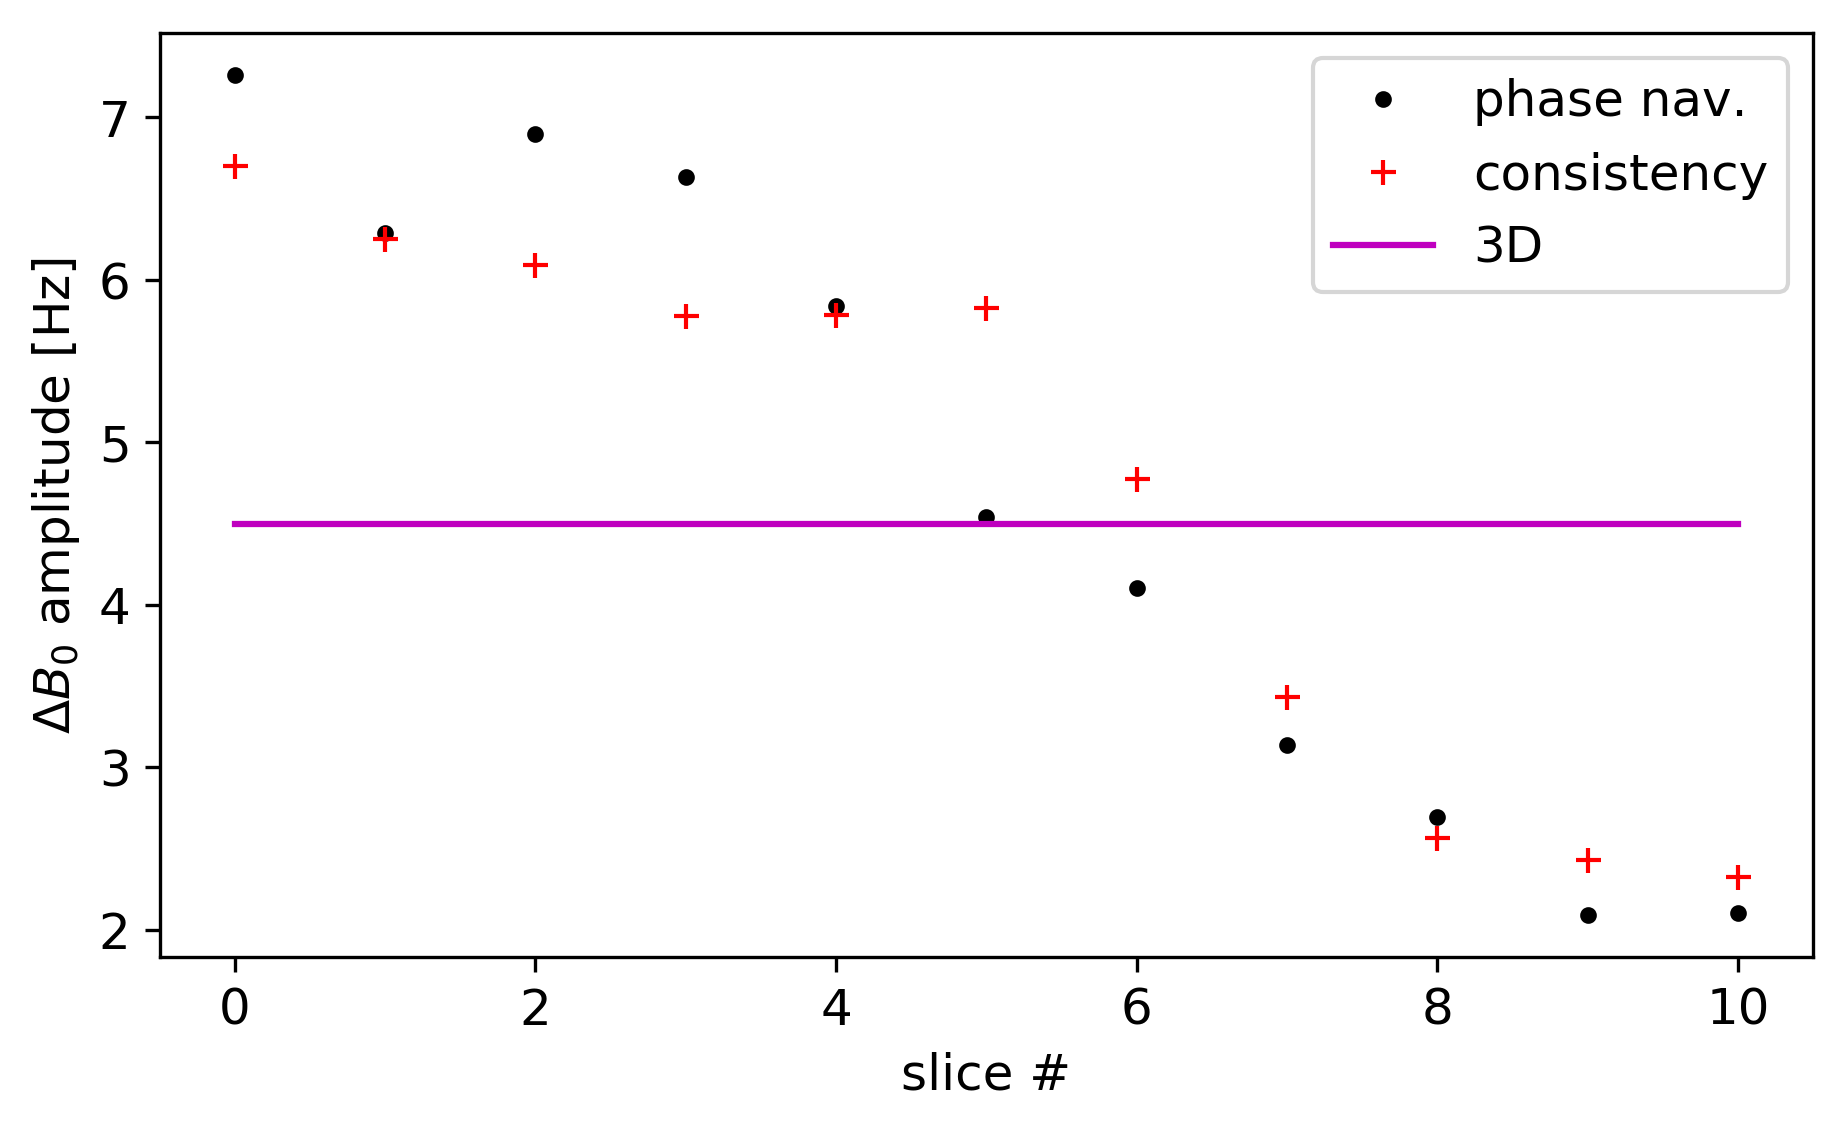
Amplitude
of B0-fluctuation for different slices in multi-slice C-spine imaging at 3T.
Slice #0 is closest to the chest, slice #10 is closest to the head. Values from
the consistency-navigator (+) and phase-navigator (.) agree well. The horizontal
line shows the amplitude observed in the 3D scan covering the same volume as
the stack of slices.
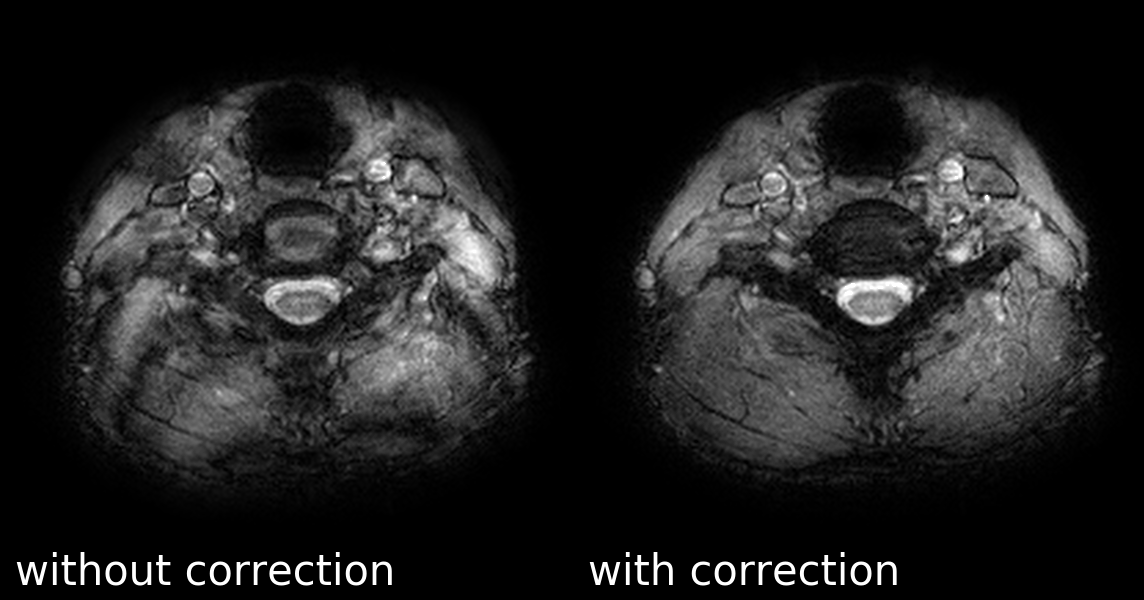
Left:
2D gradient-echo image at TE=18 ms before correction showing severe ghosting
artifacts along the phase-encoding direction (AP) . Right: The same slice after correction of B0-fluctuation
effects. A marked improvement in image quality can be observed.
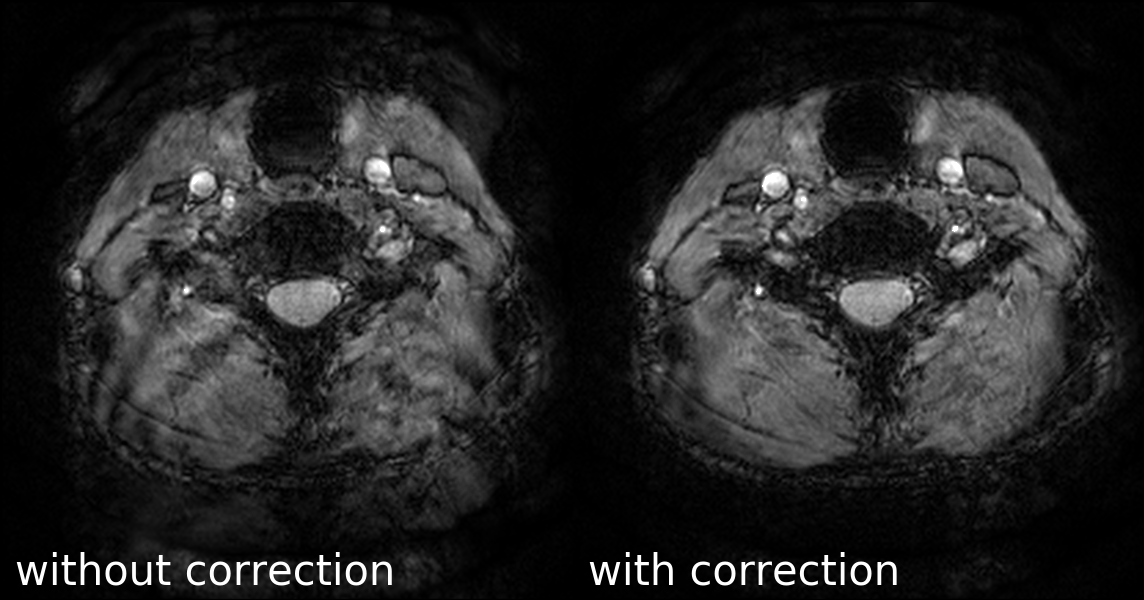
Axial
slice of 3D gradient-echo image at TE=18 ms. Left: uncorrected image, right:
image corrected for B0-fluctuations. Image quality is improved after correcting
for B0-fluctuations. Also note the contrast difference especially in the spinal
cord compared to the multi-slice scan due to the different TR, see Figure 3.