4472
Repeatability of radiomic features for prostate cancer diffusion weighted imaging obtained using b-values up to 2000 s/mm21University of Turku, Turku, Finland, 2Case Western Reserve University, Cleveland, OH, United States, 3Turku University Hospital, Turku, Finland, 4Icahn School of Medicine at Mount Sinai, New York, NY, United States
Synopsis
We evaluated repeatability and diagnostic performance of commonly used radiomic features for prostate cancer (PCa) DWI obtained using b values up to 2000 s/mm2. Forty-eight men with diagnosed PCa under two repeated 3T MRI examinations performed on the same day. Whole mounts prostatectomy sections were manually matched with in-vivo MRI data. Fourteen of the evaluated 575 features demonstrated high repeatability with ICC(3,1)>0.9 and AUC(Gleason score 3+3 vs >3+3 PCa)>0.6. Many of the conventional radiomics feature demonstrate high AUC but low repeatability (low ICC(3,1) values)stressing the fact that high classification potential using single acquisition does not necessarily mean good overall performance.
Purpose
Diffusion weighted imaging (DWI) is a cornerstone of prostate MRI(1) which has an increasingly important role in prostate cancer (PCa) detection and characterization. Modeling of PCa DWI signal decay is most commonly performed using the monoexponential model. However, kurtosis model has higher information content (fitting quality), similar repeatability, and similar robustness against noise(2,3). Texture features of T2-weighted imaging and DWI, i.e. radiomics, have already demonstrated promise in single institutional studies(4,5). However, variation in radiomics performance was observed in multiple studies evaluating radiomics in multi-institutional(6). Prostate MRI radiomic feature selection is typically based on area under the curve (AUC) values for PCa detection/characterization. Repeatability (same scanner/protocol) and reproducibility (different scanner/protocol) of radiomic features for prostate DWI have not been evaluated.Methods
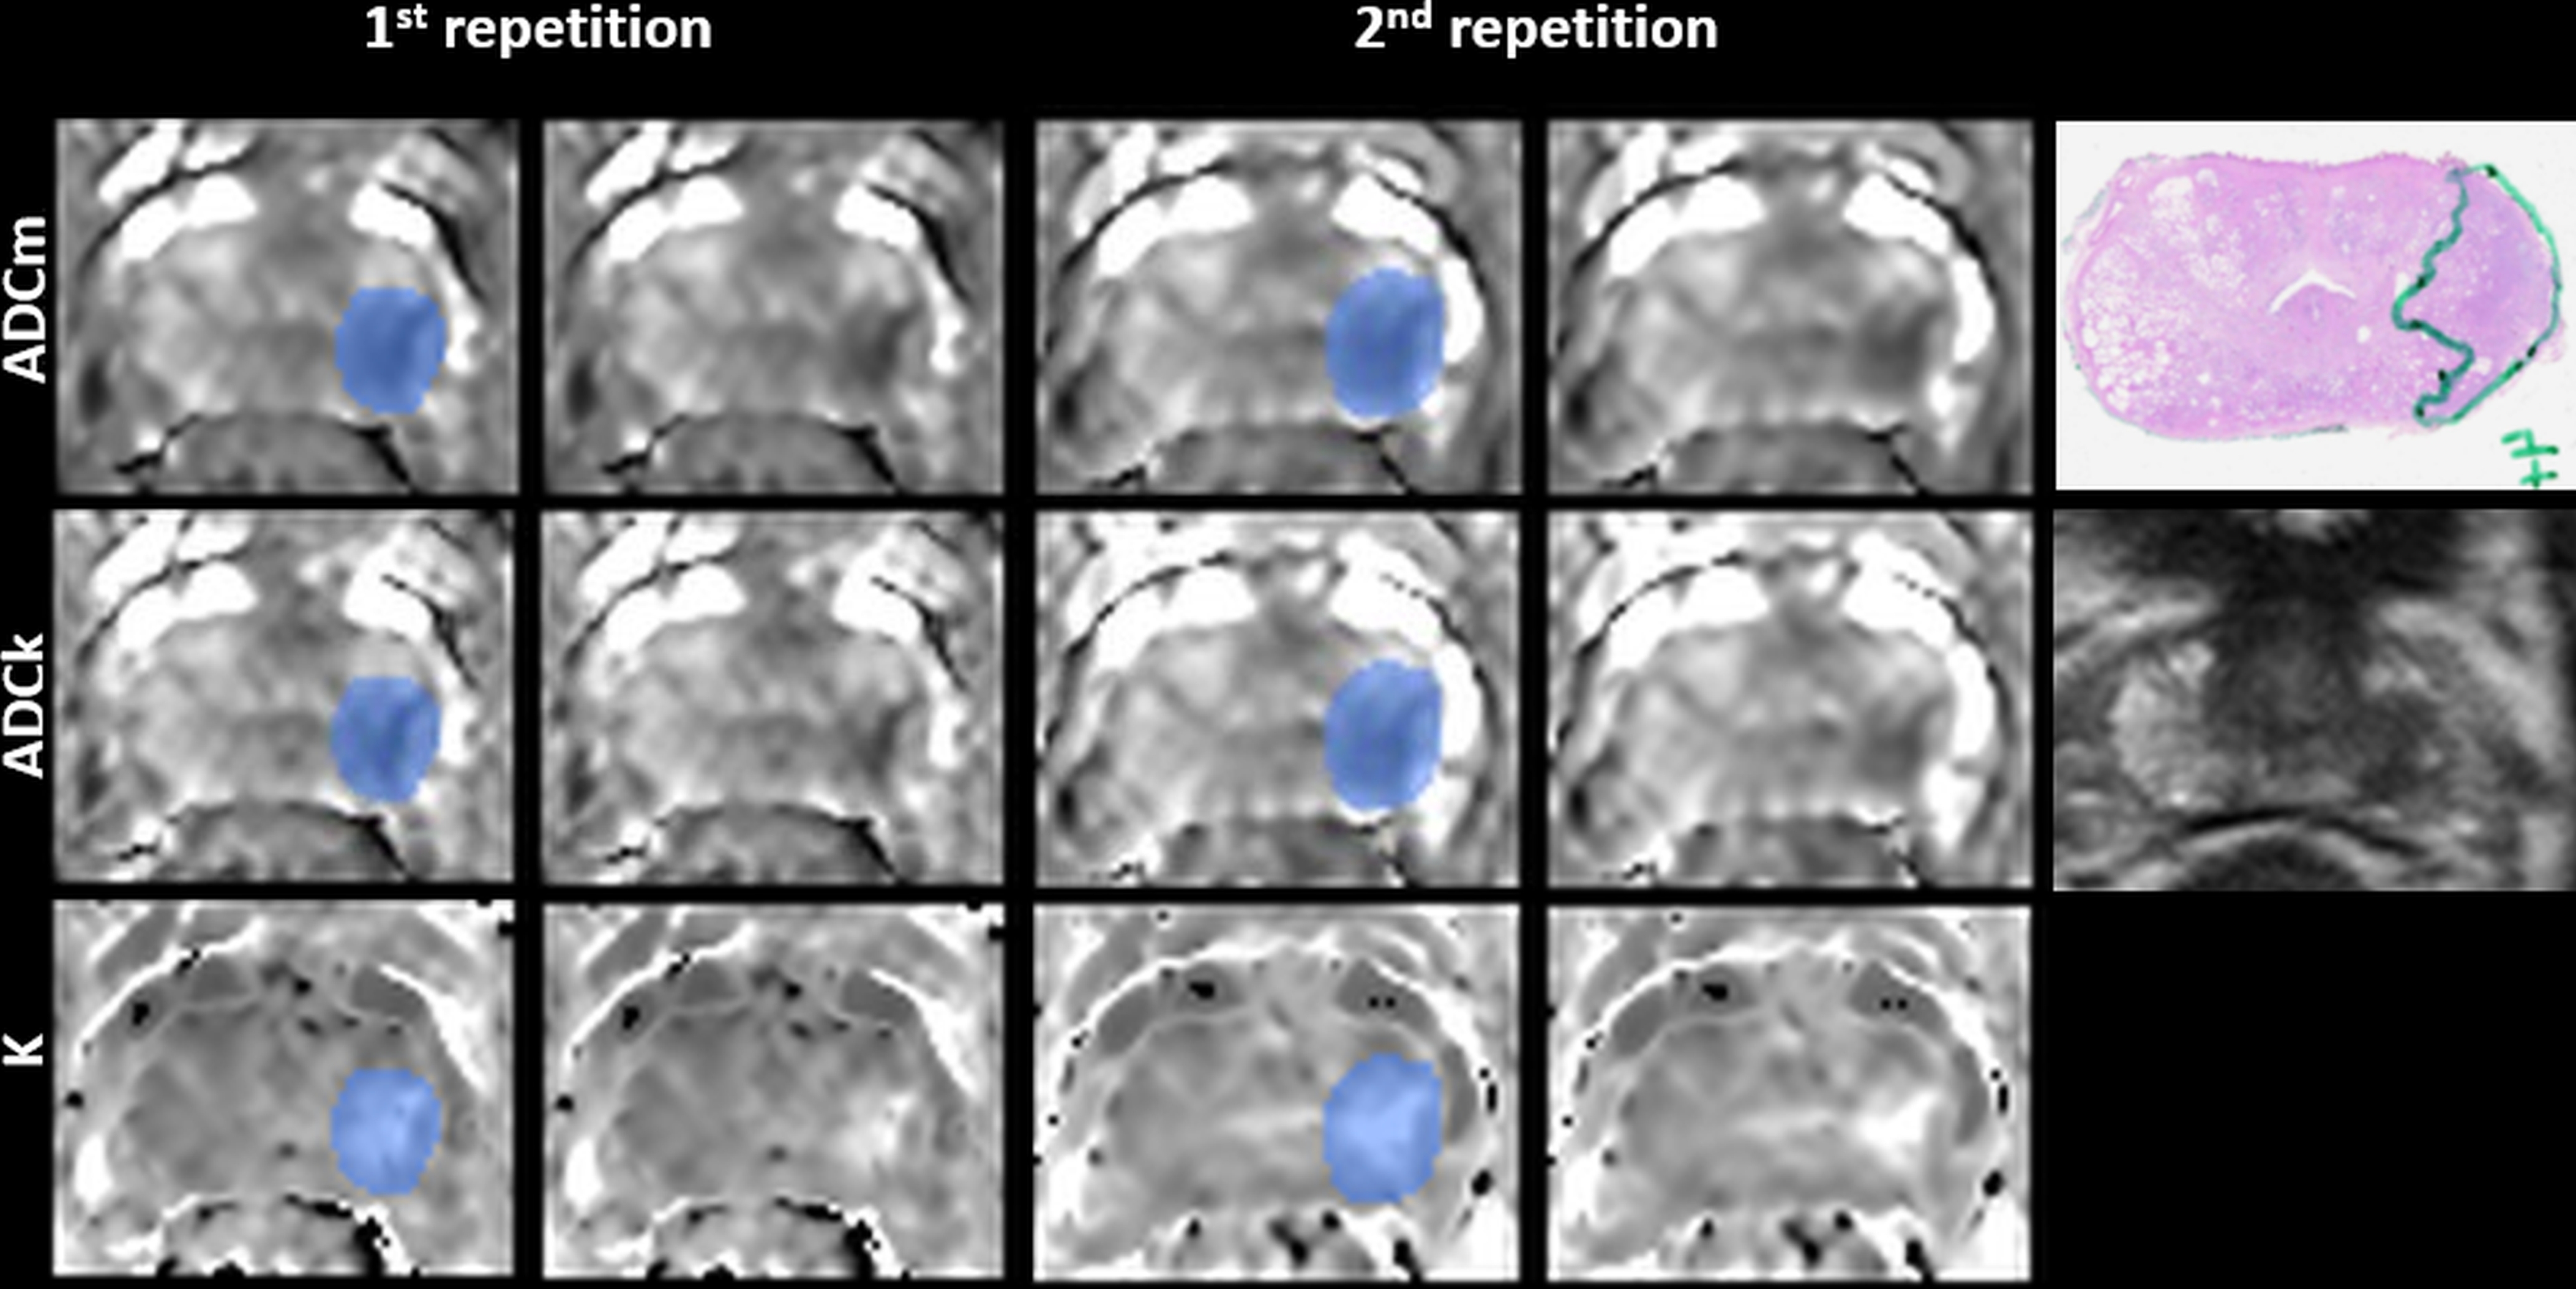
Forty-eight men with diagnosed prostate cancer underwent two prostate MR examinations performed on the same day before prostatectomy. The MR examination was performed using a 3T PET/MRI scanner (Ingenuity PET/ MR, Philips, Cleveland, OH) and 32 channel manufacturer's cardiac coils. DWI was performed using spin echo epi sequence with monopolar diffusion gradient scheme and the following parameters(2,3): TR/TE 3141/51ms, FOV 250x250 mm2, acquisition matrix 100x99, reconstruction matrix 224x224, slice thickness 5 mm, 12 b values of (number of signal averages) 0(2), 100(2), 300(2), 500(2), 700(2), 900(2), 1100(2), 1300(2), 1500(2), 1700(3), 1900(4), 2000(4) s/mm2. Whole mounts prostatectomy sections were manually matched with in-vivo MRI data and cancer areas were annotated .
DWI data sets were fitted using monoexponential (ADCm) and kurtosis (ADCk, K) models utilizing the Levenberg‐Marquardt algorithm in Leastsqbound‐scipy library(5). First order statistics of raw ADCm, ADCk, and K voxel intensity values were obtained using reconstruction voxel size of 1.25 x1.25 x 5.00 mm3 (referred here as First order statistics).
Basic statistics were obtained also from voxels considered to be located at the surface of the lesion (referred here as Surface first order statistics) and from the whole prostate region (referred here as Whole gland first order statistics).
Axial slices were processed with Sobel, Kirch, Gradient, Gabor, Haralick(7) and CoLlaGe(8) texture methods and voxel-wise parameter maps were calculated for each texture and per each lesion (including all slices) statistics were calculated (mean, standard deviation, median, range, 25th and 75th percentile). Features relating to shape of the lesion were acquired in 2D with as curvature of level-set regions applied on transaxial slices of the DWI parameter maps (referred here as 2D Level-set curvature). 3D features were created using Marching cubes algorithm, and smoothing it so that the mesh vertexes had more uniform distance to each other 3D mesh representation of lesion ROI delineation was used for curvature measurements (referred as 3D Shape features), and distance of lesion 3D mesh to 3D mesh representation of whole gland (referred as Lesion distance to the whole gland).
Area under the curve (AUC) values for Gleason score classification of PCa lesions with Gleason score 3+3 vs >3+3 were calculated. To assess repeatability of the features, intraclass correlation coefficient (ICC) values, specifically ICC(3,1), were estimated(9).
Results
In total, 77 PCa lesions with diameter >5 mm and Gleason score 3+3 or higher were included in final analysis. Fifteen, 37, 25 PCa lesions had Gleason score 3+3, 3+4, >3+4 while the corresponding lesion volumes were 0.95 (standard deviation, 0.92), 1.36 (1.0), 2.90 (1.88) ml, respectively.
Overall performance of the radiomics features for each parameter maps of monoexponential and kurtosis functions are shown in Figure 1. Thirteen of 575 features demonstrated excellent repeatability with ICC(3,1)>0.9. Nine of 13 features with ICC(3,1) > 0.9 had averaged AUC > 0.6.
The test-retest repeatability varied largely within families of texture features (Figure 2, 3, 4). Haralick and CoLlAGe features demonstrated the best classification performance. 3D shape features had the best repeatability (high ICC(3,1) values) and their performance was the same across modalities. For intensity-based features, the performance varied between parameter maps. Kurtosis parameteric maps generally had higher repeatability (higher ICC(3,1) values) of radiomic features than ADCm. K parameter map improved CoLlaGe Gabor, and Haralick features, suggesting the Kurtosis model may help to improve performance of radiomic texture features
Discussions/Conclusions
Many of the conventional radiomics feature demonstrate high AUC but low repeatability (low ICC(3,1) values) stressing the fact that high classification potential using single acquisition does not necessarily mean good overall performance. Careful optimization of radiomics parameters is needed to achieve both high diagnostic performance for PCa characterization as well as high repeatability in test-retest settingsAcknowledgements
This study was financially supported by grants from the Instrumentarium Research Foundation, Sigrid Jusélius Foundation, Turku University Hospital, TYKS-SAPA research fund, Finnish Cancer Society, Finnish Cultural Foundation, and Orion Research Foundation. HM was supported by Sigrid Juselius Foundation, Finland.References
1. Weinreb J, Barentsz J, Choyke P, et al. PI-RADS Prostate Imaging-Reporting and Data System:2015, Version 2. Eur Urol. 2016;69(1)(Version 2):16–40.
2. Jambor I, Merisaari H, Taimen P, et al. Evaluation of different mathematical models for diffusion-weighted imaging of normal prostate and prostate cancer using high b-values: a repeatability study. Magn Reson. p. 1988–1998.
3. Merisaari H, Jambor I. Optimization of b-value distribution for four mathematical models of prostate cancer diffusion-weighted imaging using b values up to 2000 s/mm2: Simulation and repeatability study. Magn Reson Med. 2015;73(5):1954–1969.
4. Algohary A, Viswanath S, Shiradkar R, et al. Radiomic features on MRI enable risk categorization of prostate cancer patients on active surveillance: Preliminary findings. J Magn Reson Imaging. 2018;48(3):818–828.
5. Toivonen J, Perez IM, Movahedi P, et al. Machine learning for prostate cancer Gleason score prediction using radiomics of T2-weighted imaging, diffusion weighted imaging and T2-mapping. ISMRM 2018
6. Shiradkar R, Ghose S, Jambor I, et al. Radiomic features from pretreatment biparametric MRI predict prostate cancer biochemical recurrence: Preliminary findings. J Magn Reson Imaging. 2018;
7. Haralick RM, Shanmugam K, Dinstein I. Textural Features for Image Classification. IEEE Trans Syst Man Cybern. 1973;SMC-3(6):610–621.
8. Prasanna P, Tiwari P, Madabhushi A. Co-occurrence of Local Anisotropic Gradient Orientations (CoLlAGe): A new radiomics descriptor. Sci Rep. Nature Publishing Group; 2016;6:37241.
9. Shrout PE, Fleiss JL. Intraclass correlations: uses in assessing rater reliability. Psychol.Bull. p. 420–428.
Figures
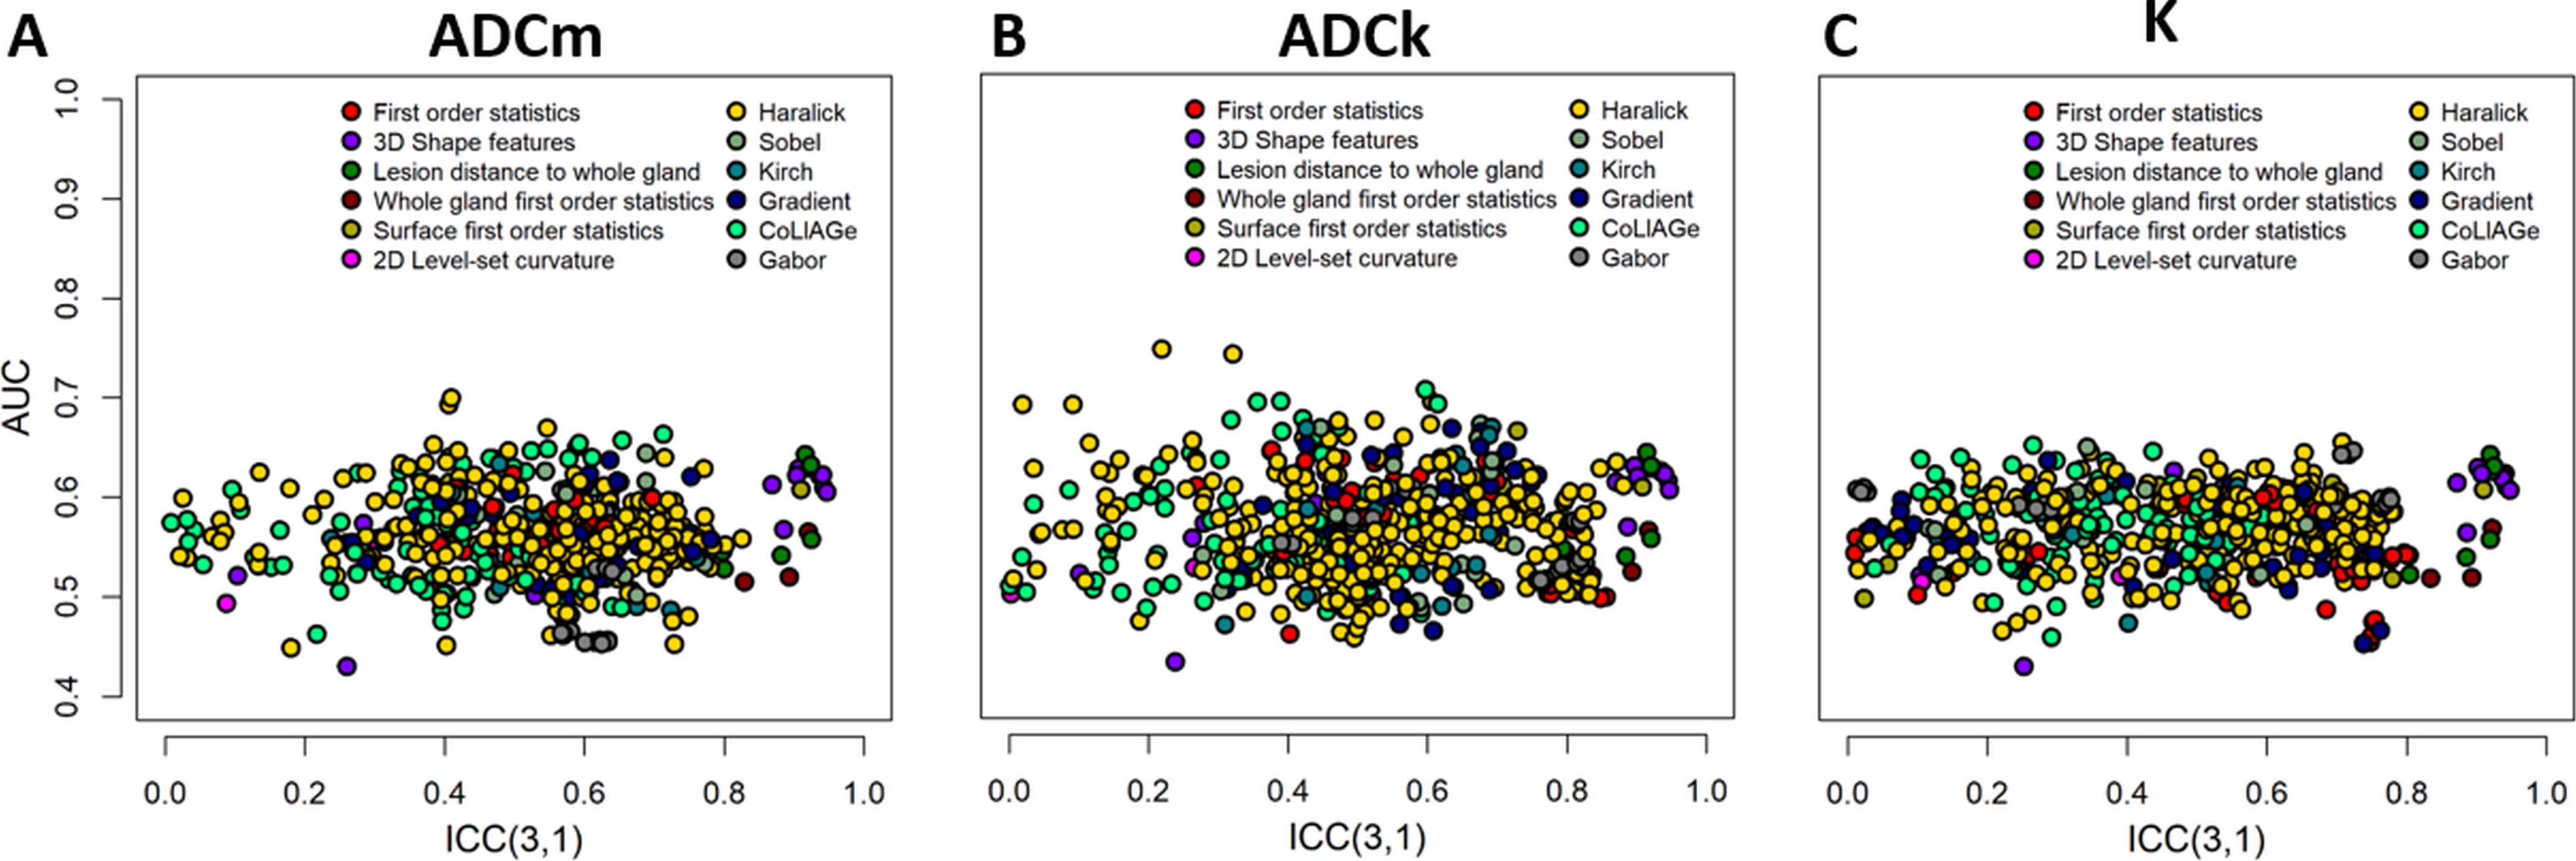
Figure 1
Test-retest repeatability (ICC(3,1) and classification potential (AUC) for prostate cancer lesions with Gleason score 3+3 versus >3+3.
AUC = area under the curve
ICC(3,1) = intraclass correlation coefficient (3,1)
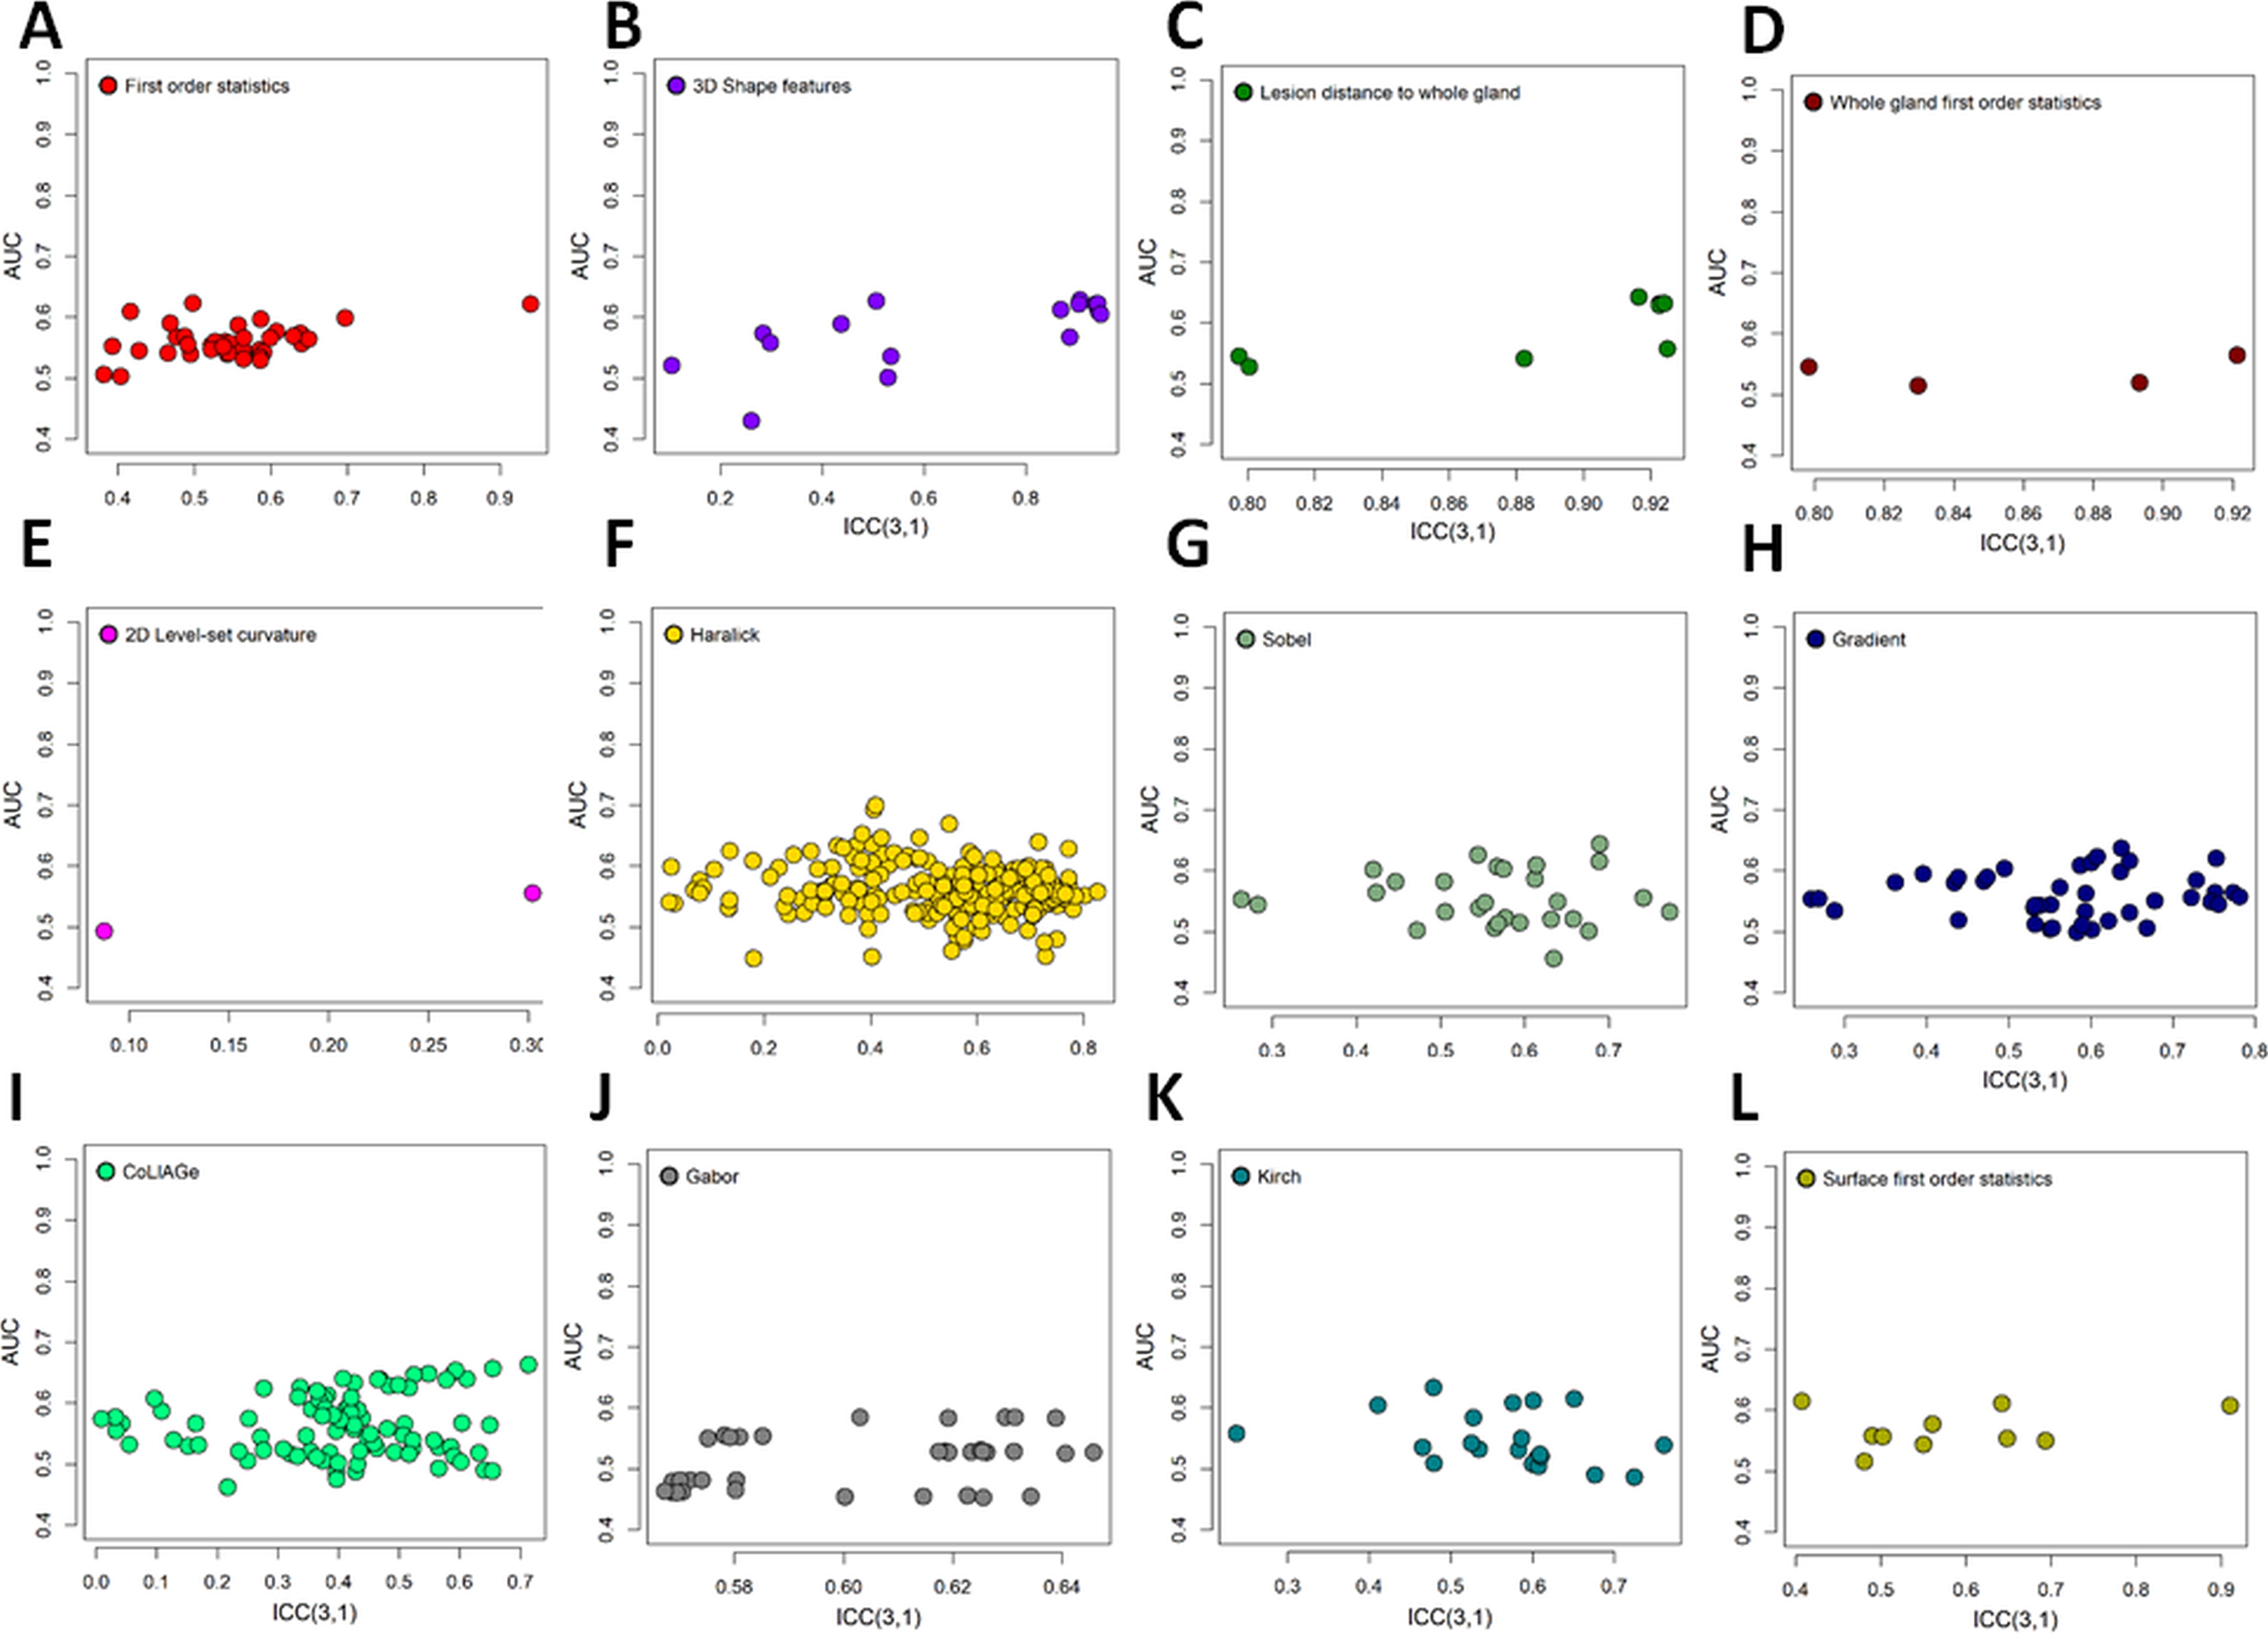
Figure 2
Test-retest repeatability and classification potential for prostate cancer lesion classification between 3+3 and >3+3 in ADCm parameter map of monoexponential model. The features are shown separately in their corresponding feature families'. All 575 features are shown as grouped by type of feature into A-L.
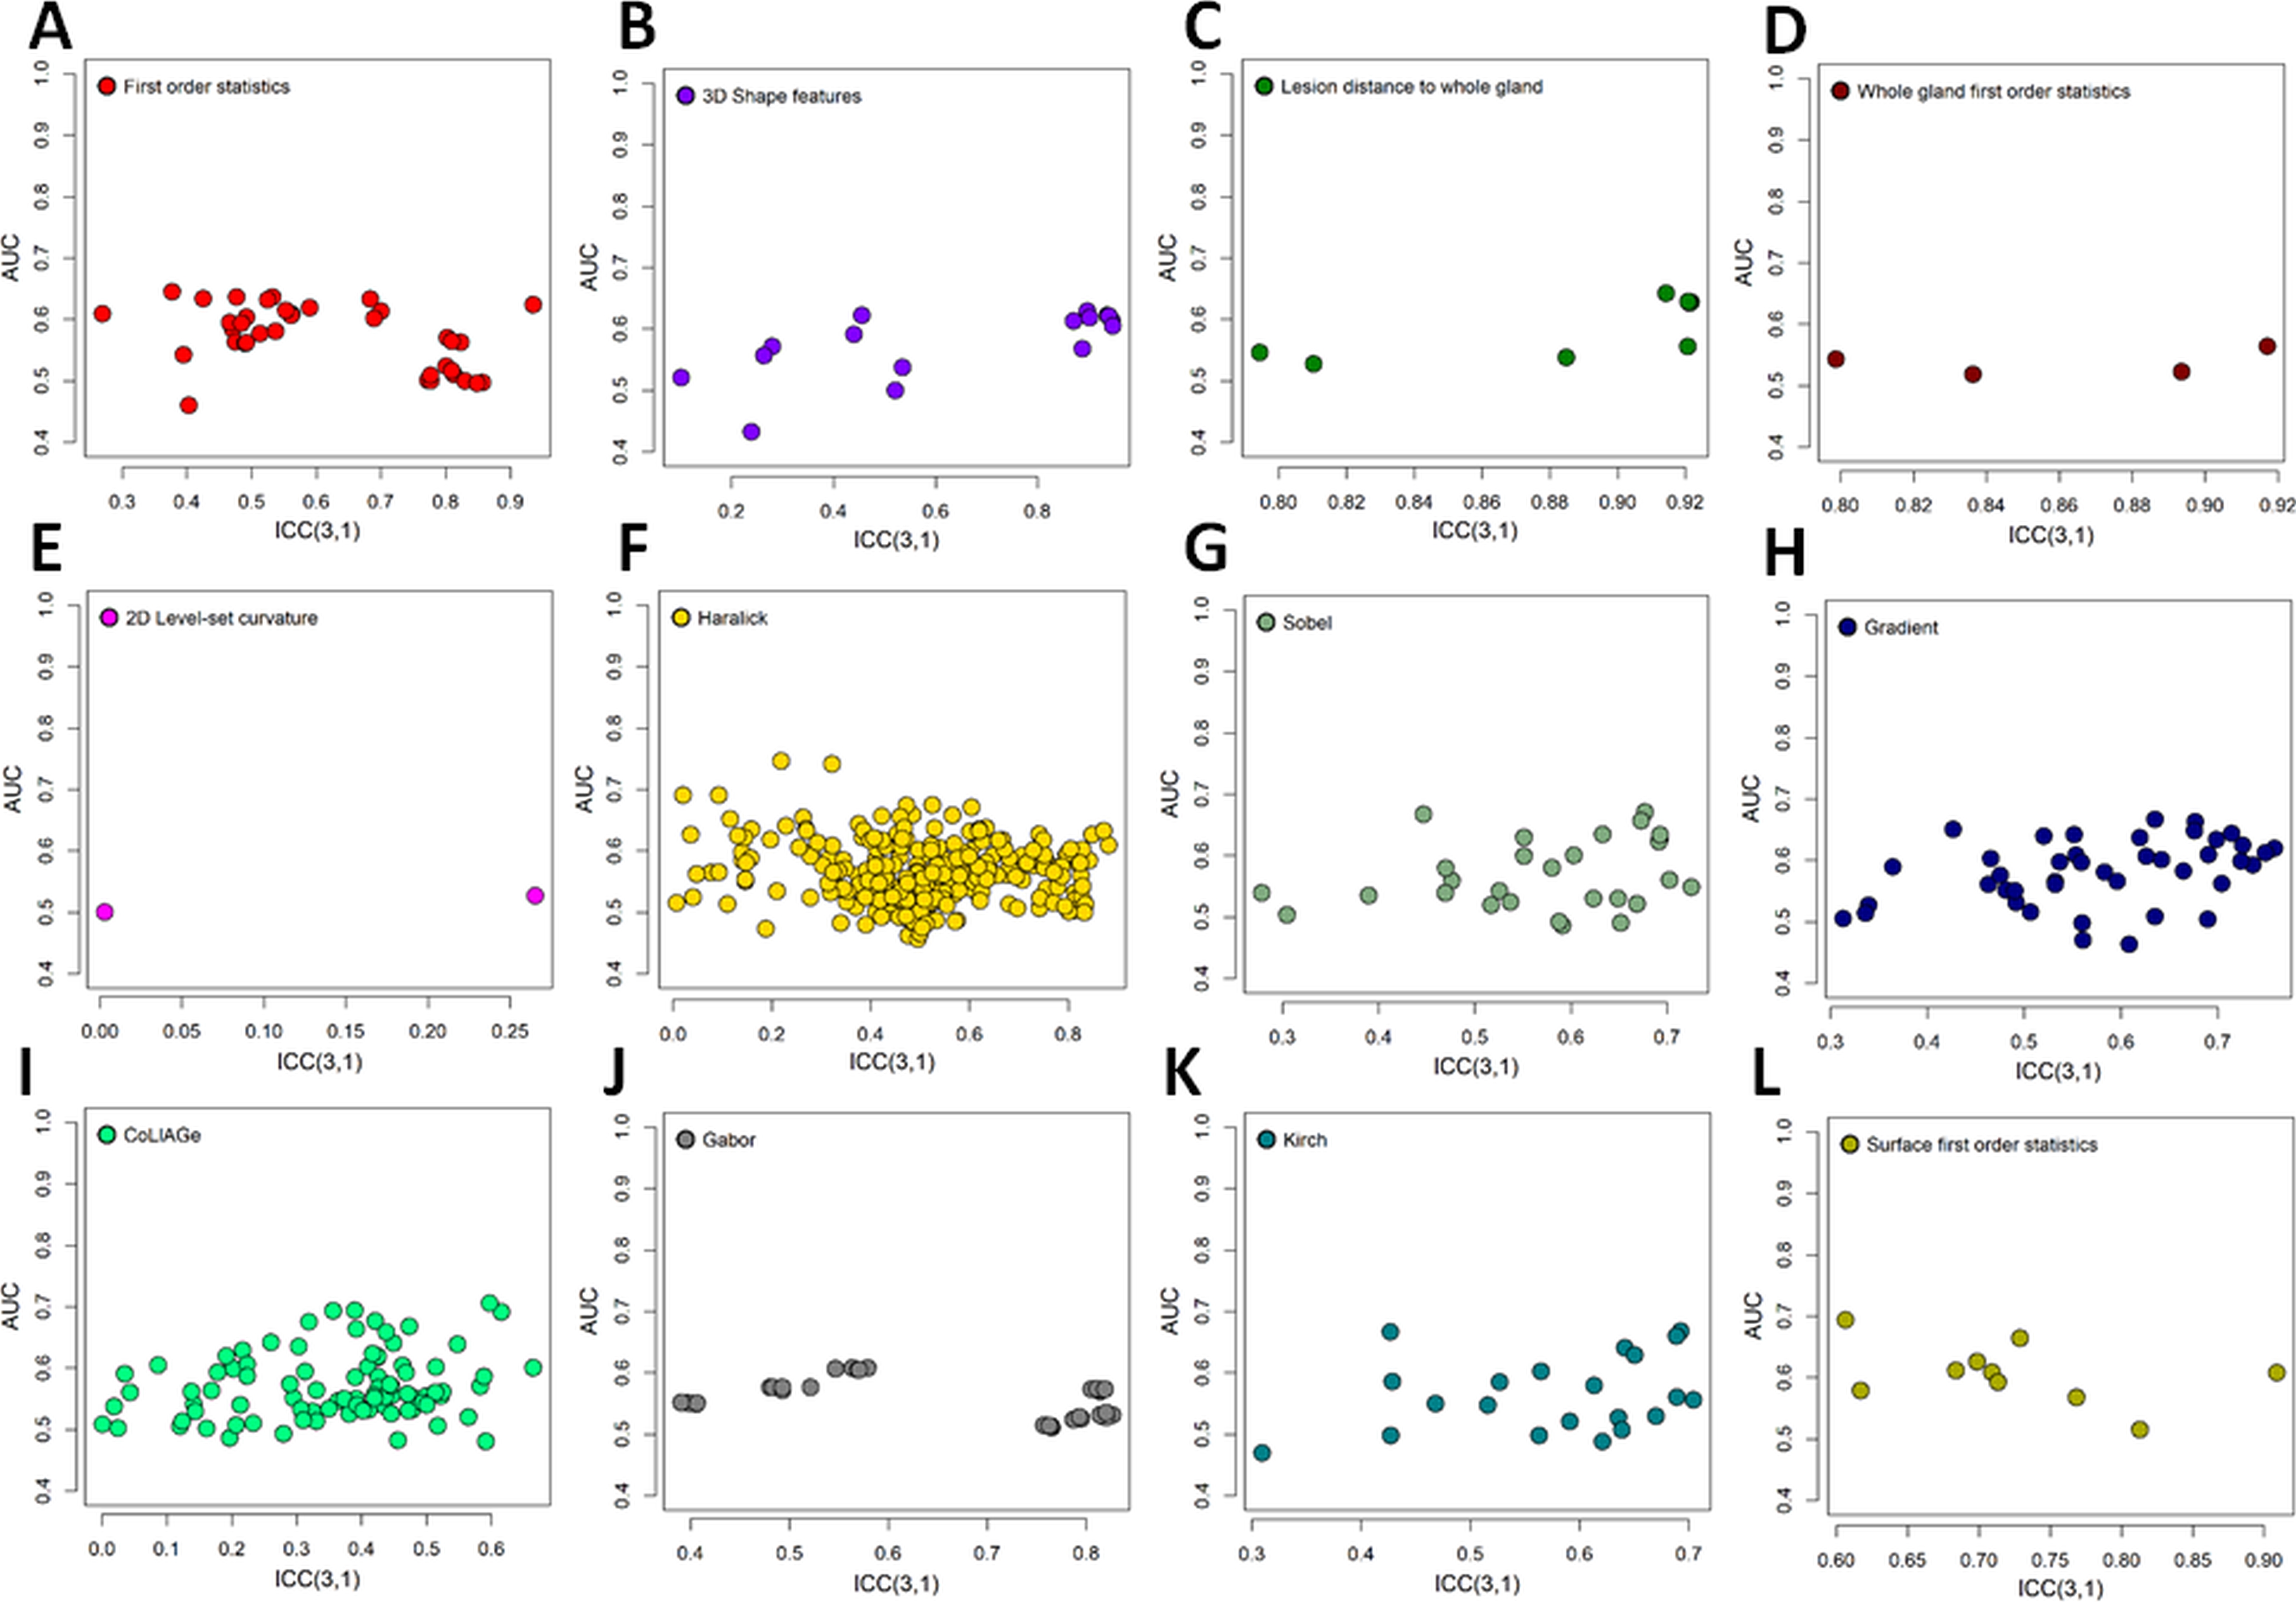
Figure 3
Test-retest repeatability and classification potential for prostate cancer lesion classification between 3+3 and >3+3 in ADCk parameter map of kurtosis model. The features are shown separately in their corresponding feature families'. All 575 features are shown as grouped by type of feature into A-L.
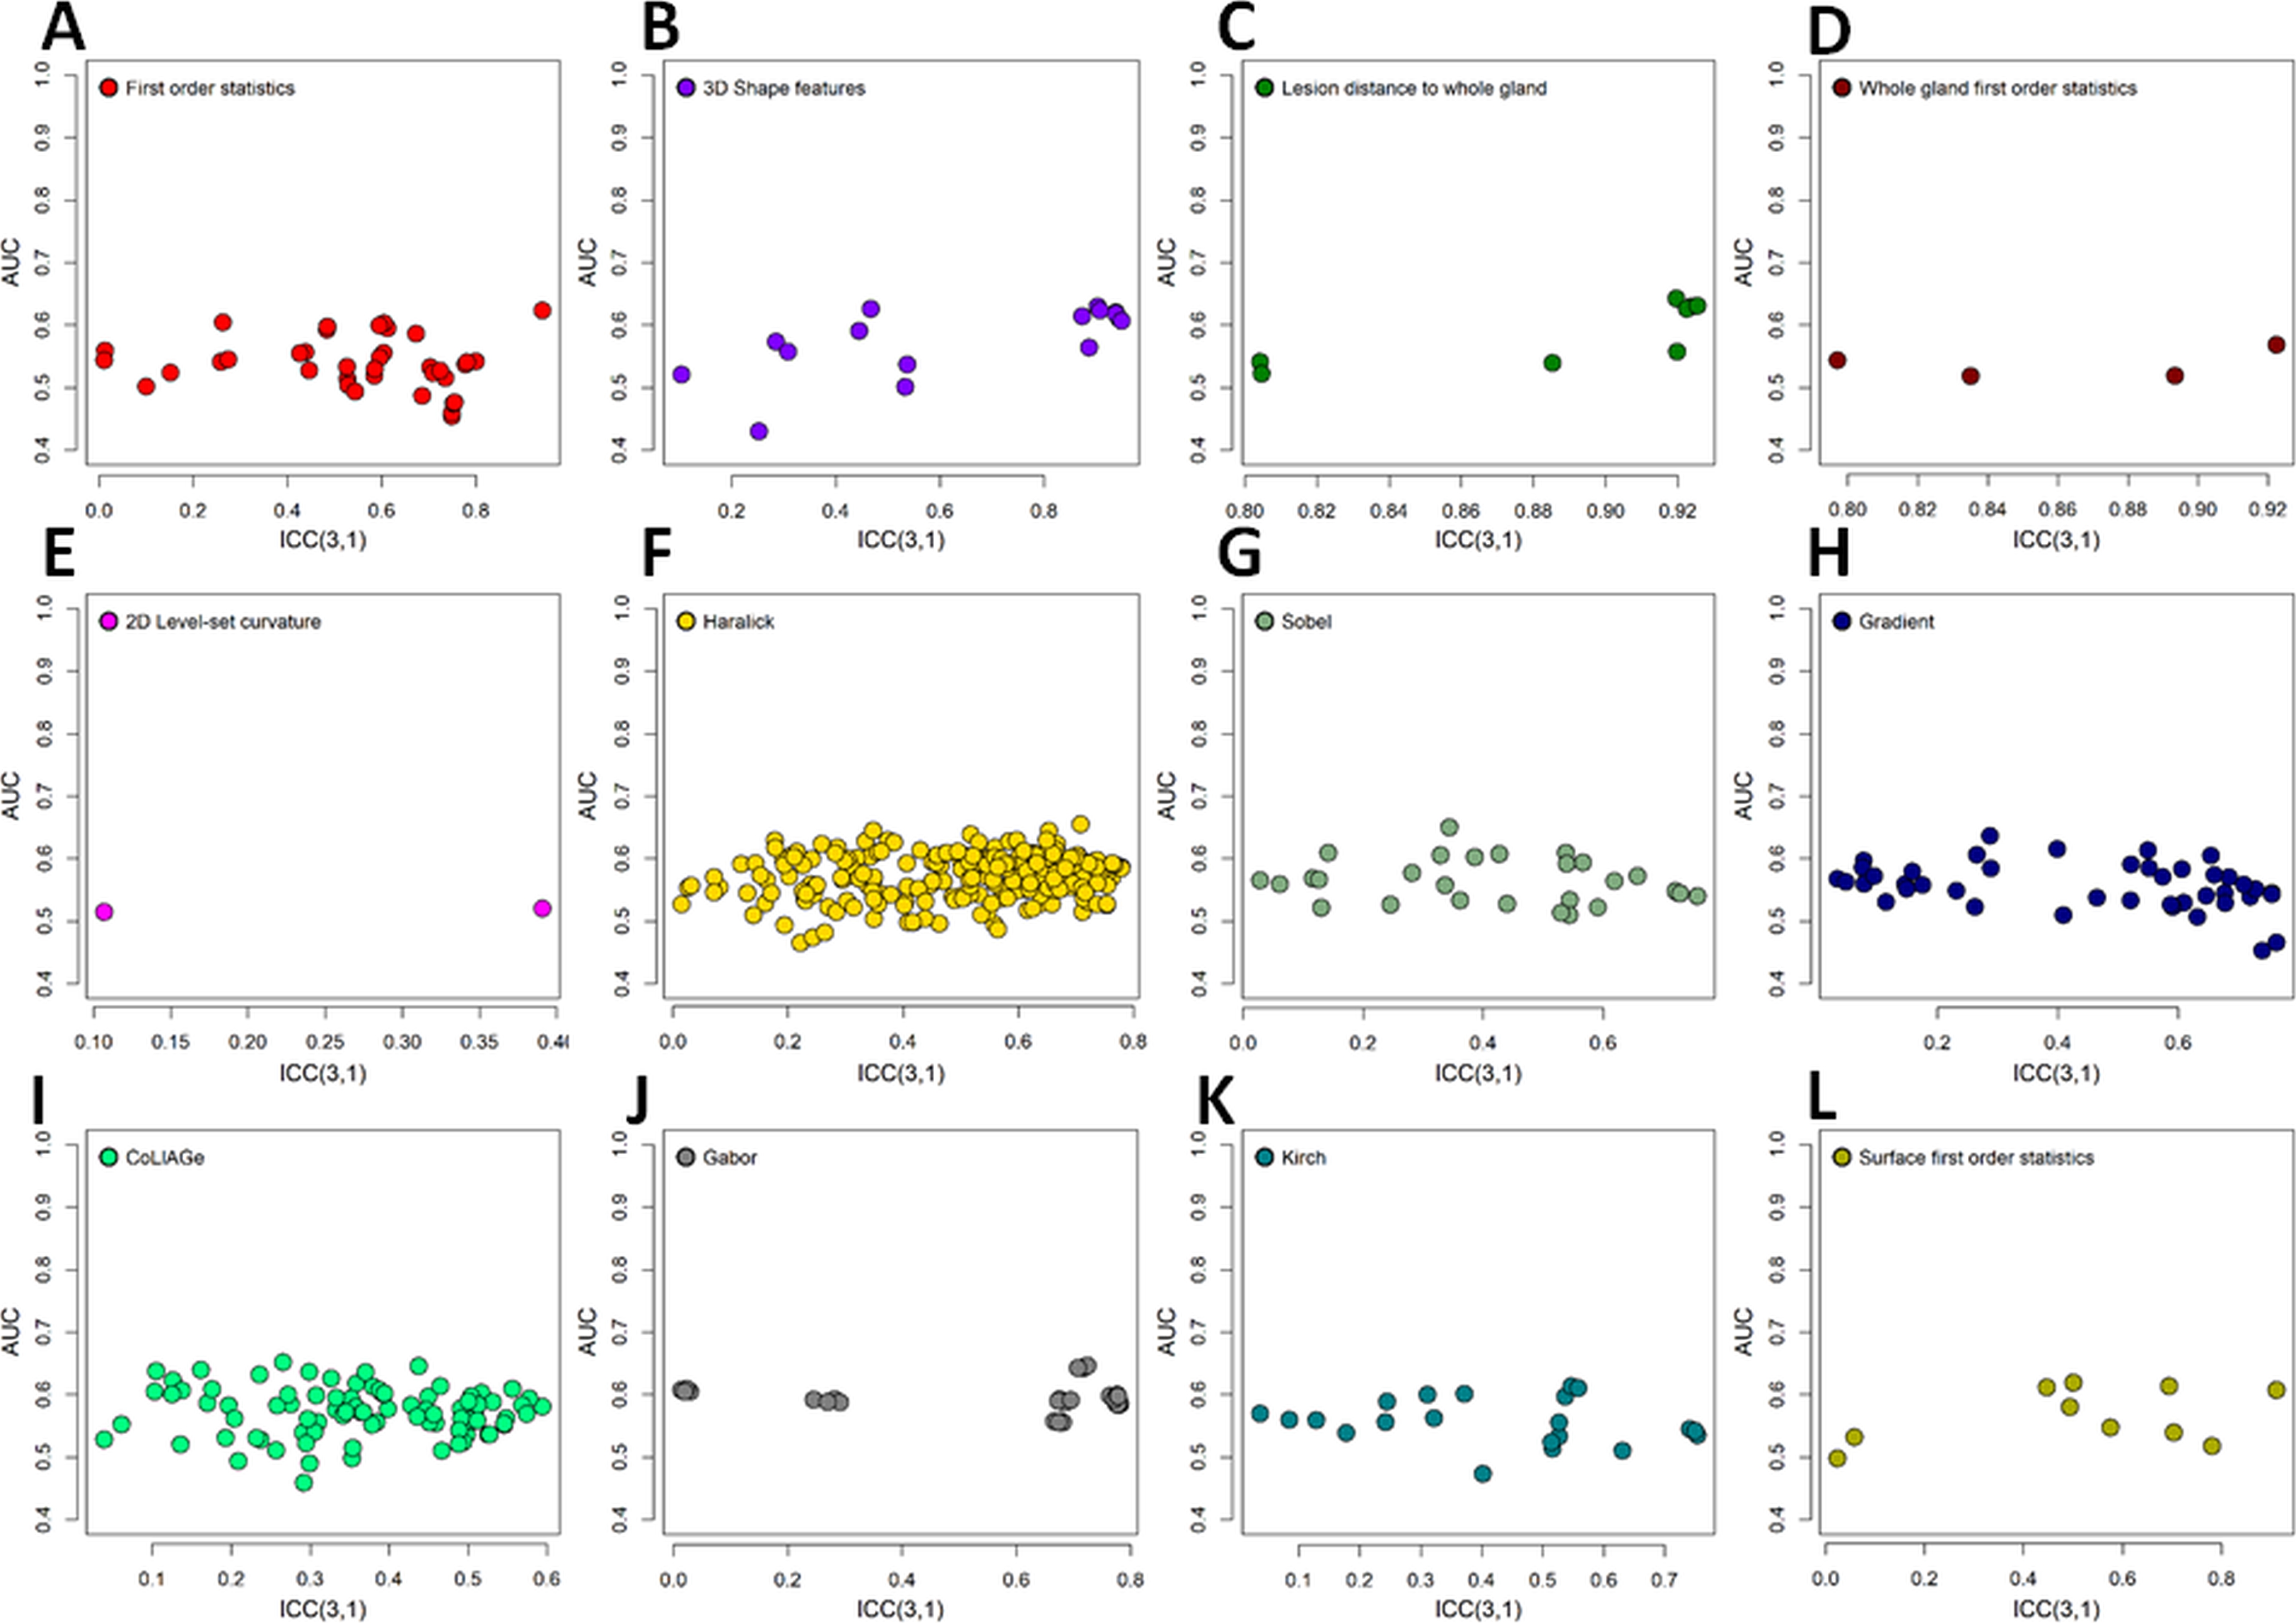
Figure 4
Test-retest repeatability and classification potential for prostate cancer lesion classification between 3+3 and >3+3 in K parameter map of kurtosis model. The features are shown separately in their corresponding feature families'. All features are shown as grouped by type of feature into A-L.