4471
Influence of image processing on the robustness of radiomic features derived from magnetic resonance imaging - a phantom study1Institute of Clinical Radiology and Nuclear Medicine, University Medical Center Mannheim, Medical Faculty Mannheim, Heidelberg University, Mannheim, Germany, 2Department of Radiology, University Hospital of Cologne, Cologne, Germany, 3Philips Healthcare Germany, Hamburg, Germany
Synopsis
The emerging field of
Introduction
The emerging field of radiomics aims at analyzing quantitative features derived from medical images to characterize tissue, e.g. tumor phenotypes, and support clinical decision-making1,2. However, an extensive knowledge about the robustness and reproducibility of radiomic features has to precede translation into routine clinical practice. Currently, the image biomarker standardization initiative works towards standardization of the radiomic feature extraction process, focusing on computed tomography and positron emission tomography imaging3. In contrast, very little is known regarding the robustness of radiomic features derived from magnetic resonance imaging (MRI)4-7. Recently our group showed that the robustness of radiomic features is considerably influenced by the MRI sequence and resolution used for image acquisition8. Although, standardized image processing is recommended before radiomic feature extraction, the dedicated processing parameter settings so far remain unknown. Thus, the purpose of the present study was to assess the influence of image processing parameters on the robustness of radiomic features and to deliver preprocessing recommendations for selected MRI sequences.Methods
Materials: Our radiomics phantom consisted of 4 onions, 4 limes, 4 kiwifruits, and 4 apples (reflecting different tissue textures) placed on a box made out of Styrofoam (Figure 1).
Data acquisition: Phantom measurements were performed on a clinical 3T scanner (Ingenia, Philips Healthcare, Best, The Netherlands) with the built-in spine matrix coil as well as the standard body-matrix coil. Two different MRI sequences were acquired: 1) a fluid-attenuated inversion recovery (FLAIR) sequence (acquired voxel size 1.2x1.5x5.5[mm], reconstructed voxel size 0.45x0.45x5.5[mm], FOV 300x300x77, TE/TR=140/12000[ms], Flip angle 90°), and 2) a T2-weighted (T2w) sequence (acquired voxel size 0.8x1.0x5.5[mm], reconstructed voxel size 0.3x0.3x5.5[mm], FOV 300x300x77, TE/TR=80/2500[ms], Flip angle 90°). After repositioning of the phantom all sequences were repeated to acquire test/retest data.
Image segmentation: Image segmentation was performed semi-automatically using the 3D Slicer open-source platform (version 4.8; www.slicer.org)9. The most apical and basal slice of each fruit/vegetable as well as border zones between fruit/vegetable and surrounding air were manually excluded to account for partial volume artifacts. Radiomic feature extraction: Radiomic features were extracted using the user-friendly, multiplatform freeware LIFEx (version 4.00; www.lifexsoft.org)10. Prior to feature extraction, 27 different image processing settings/resampling steps were used (Table 1). A total of 45 radiomic features were extracted, corresponding to the following 6 different matrices/feature classes: histogram matrix, shape matrix, grey-level cooccurrence matrix, grey level run length matrix (GLRLM), neighboring grey level dependence matrix, and grey level zone length matrix.
Statistical analysis: Statistical analysis was performed in R (version3.4.0; R Foundation for Statistical Computing) with RStudio (version1.0.136). Concordance correlation coefficients (CCCs)11 were calculated to analyze test-retest-robustness. The dynamic range (DR) was calculated as previously described12,13, with values close to 1 implying that the feature has a large biological range with good reproducibility. In order to account for subtle intra-reader differences in image segmentation, CCCs were corrected as follows: CCCcorr=CCC+(1- intra-observer ICC). Excellent robustness was then defined as CCCcorr and DR≥0.90 as previously described12. Systematic differences of individual features between different resampling steps were assessed using one-way analysis of variance with Tukey-type post-hoc comparisons in order to adjust for multiple testing.
Results
For both MRI sequences, the amount of robust radiomic features differed considerably depending upon the chosen image processing parameters (Figure 2). In general, the percentage of robust features tended to be higher for FLAIR than for T2w. For FLAIR imaging, image processing with spatial resampling of 1.25x1.25x1.25[mm], intensity discretization with 32 grey-levels and mean±3 standard deviations relative intensity rescaling delivered the highest percentage of robust features (n=34/45, 76%), whereas for T2w imaging, highest robustness (n=36/45, 80%) was achieved by using a spatial resampling of 1x1x1[mm], intensity discretization with 32 grey-levels and min<>max relative intensity rescaling as image processing settings.
Regarding systematic differences introduced by the variation of image processing parameters, histogram and shape features did not show significant differences between the different resampling steps, except for resampling steps leading to anisotropic voxels. In contrast, there were large and significant differences for nearly all other feature matrices, as exemplarily shown for GLRLM features (Figure 3).
Discussion
Our results show that variation of image processing parameters has considerable impact on the robustness as well as on absolute values of radiomic features extracted from MRI data. Optimal image processing parameters differ between different MRI sequences. Thus, dedicated image processing settings should be recommended for each individual sequence used for radiomic feature extraction.Conclusion
Extensive reproducibility and validation studies as well as standardization are required before being able to reliably translate quantitative image analysis and radiomics into standard clinical care. Care should be taken in the interpretation of non-standardized MRI-based clinical radiomic studies.Acknowledgements
No acknowledgement found.References
- Obermeyer, Z. and E.J. Emanuel, Predicting the Future - Big Data, Machine Learning, and Clinical Medicine. N Engl J Med, 2016. 375(13): p. 1216-9.
- Lambin, P., R.T.H. Leijenaar, T.M. Deist, et al., Radiomics: the bridge between medical imaging and personalized medicine. Nat Rev Clin Oncol, 2017. 14(12): p. 749-762.
- Zwanenburg, A., S. Leger, M. Vallières, et al., Image biomarker standardisation initiative. arXiv preprint arXiv:1612.07003, 2016.
- Mayerhoefer, M.E., P. Szomolanyi, D. Jirak, et al., Effects of magnetic resonance image interpolation on the results of texture-based pattern classification: a phantom study. Invest Radiol, 2009. 44(7): p. 405-11.
- Collewet, G., M. Strzelecki, and F. Mariette, Influence of MRI acquisition protocols and image intensity normalization methods on texture classification. Magn Reson Imaging, 2004. 22(1): p. 81-91.
- Park, J.E. and H.S. Kim, Radiomics as a Quantitative Imaging Biomarker: Practical Considerations and the Current Standpoint in Neuro-oncologic Studies. Nucl Med Mol Imaging, 2018. 52(2): p. 99-108.
- Saha, A., M.R. Harowicz, and M.A. Mazurowski, Breast cancer MRI radiomics: An overview of algorithmic features and impact of inter-reader variability in annotating tumors. Med Phys, 2018. 45(7): p. 3076-3085.
- Baeßler, B., K. Weiss, and D. Pinto dos Santos, Robustness and Reproducibility of Radiomics in Magnetic Resonance Imaging - a Phantom Study. Investigative Radiology, in press.
- Fedorov, A., R. Beichel, J. Kalpathy-Cramer, et al., 3D Slicer as an image computing platform for the Quantitative Imaging Network. Magn Reson Imaging, 2012. 30(9): p. 1323-41.
- Nioche, C., F. Orlhac, S. Boughdad, et al., LIFEx: A Freeware for Radiomic Feature Calculation in Multimodality Imaging to Accelerate Advances in the Characterization of Tumor Heterogeneity. Cancer Res, 2018. 78(16): p. 4786-4789.
- Lin, L.I., A concordance correlation coefficient to evaluate reproducibility. Biometrics, 1989. 45(1): p. 255-68.
- Balagurunathan, Y., V. Kumar, Y. Gu, et al., Test-retest reproducibility analysis of lung CT image features. J Digit Imaging, 2014. 27(6): p. 805-23.
- Zhao, B., Y. Tan, W.Y. Tsai, et al., Reproducibility of radiomics for deciphering tumor phenotype with imaging. Sci Rep, 2016. 6: p. 23428.
Figures
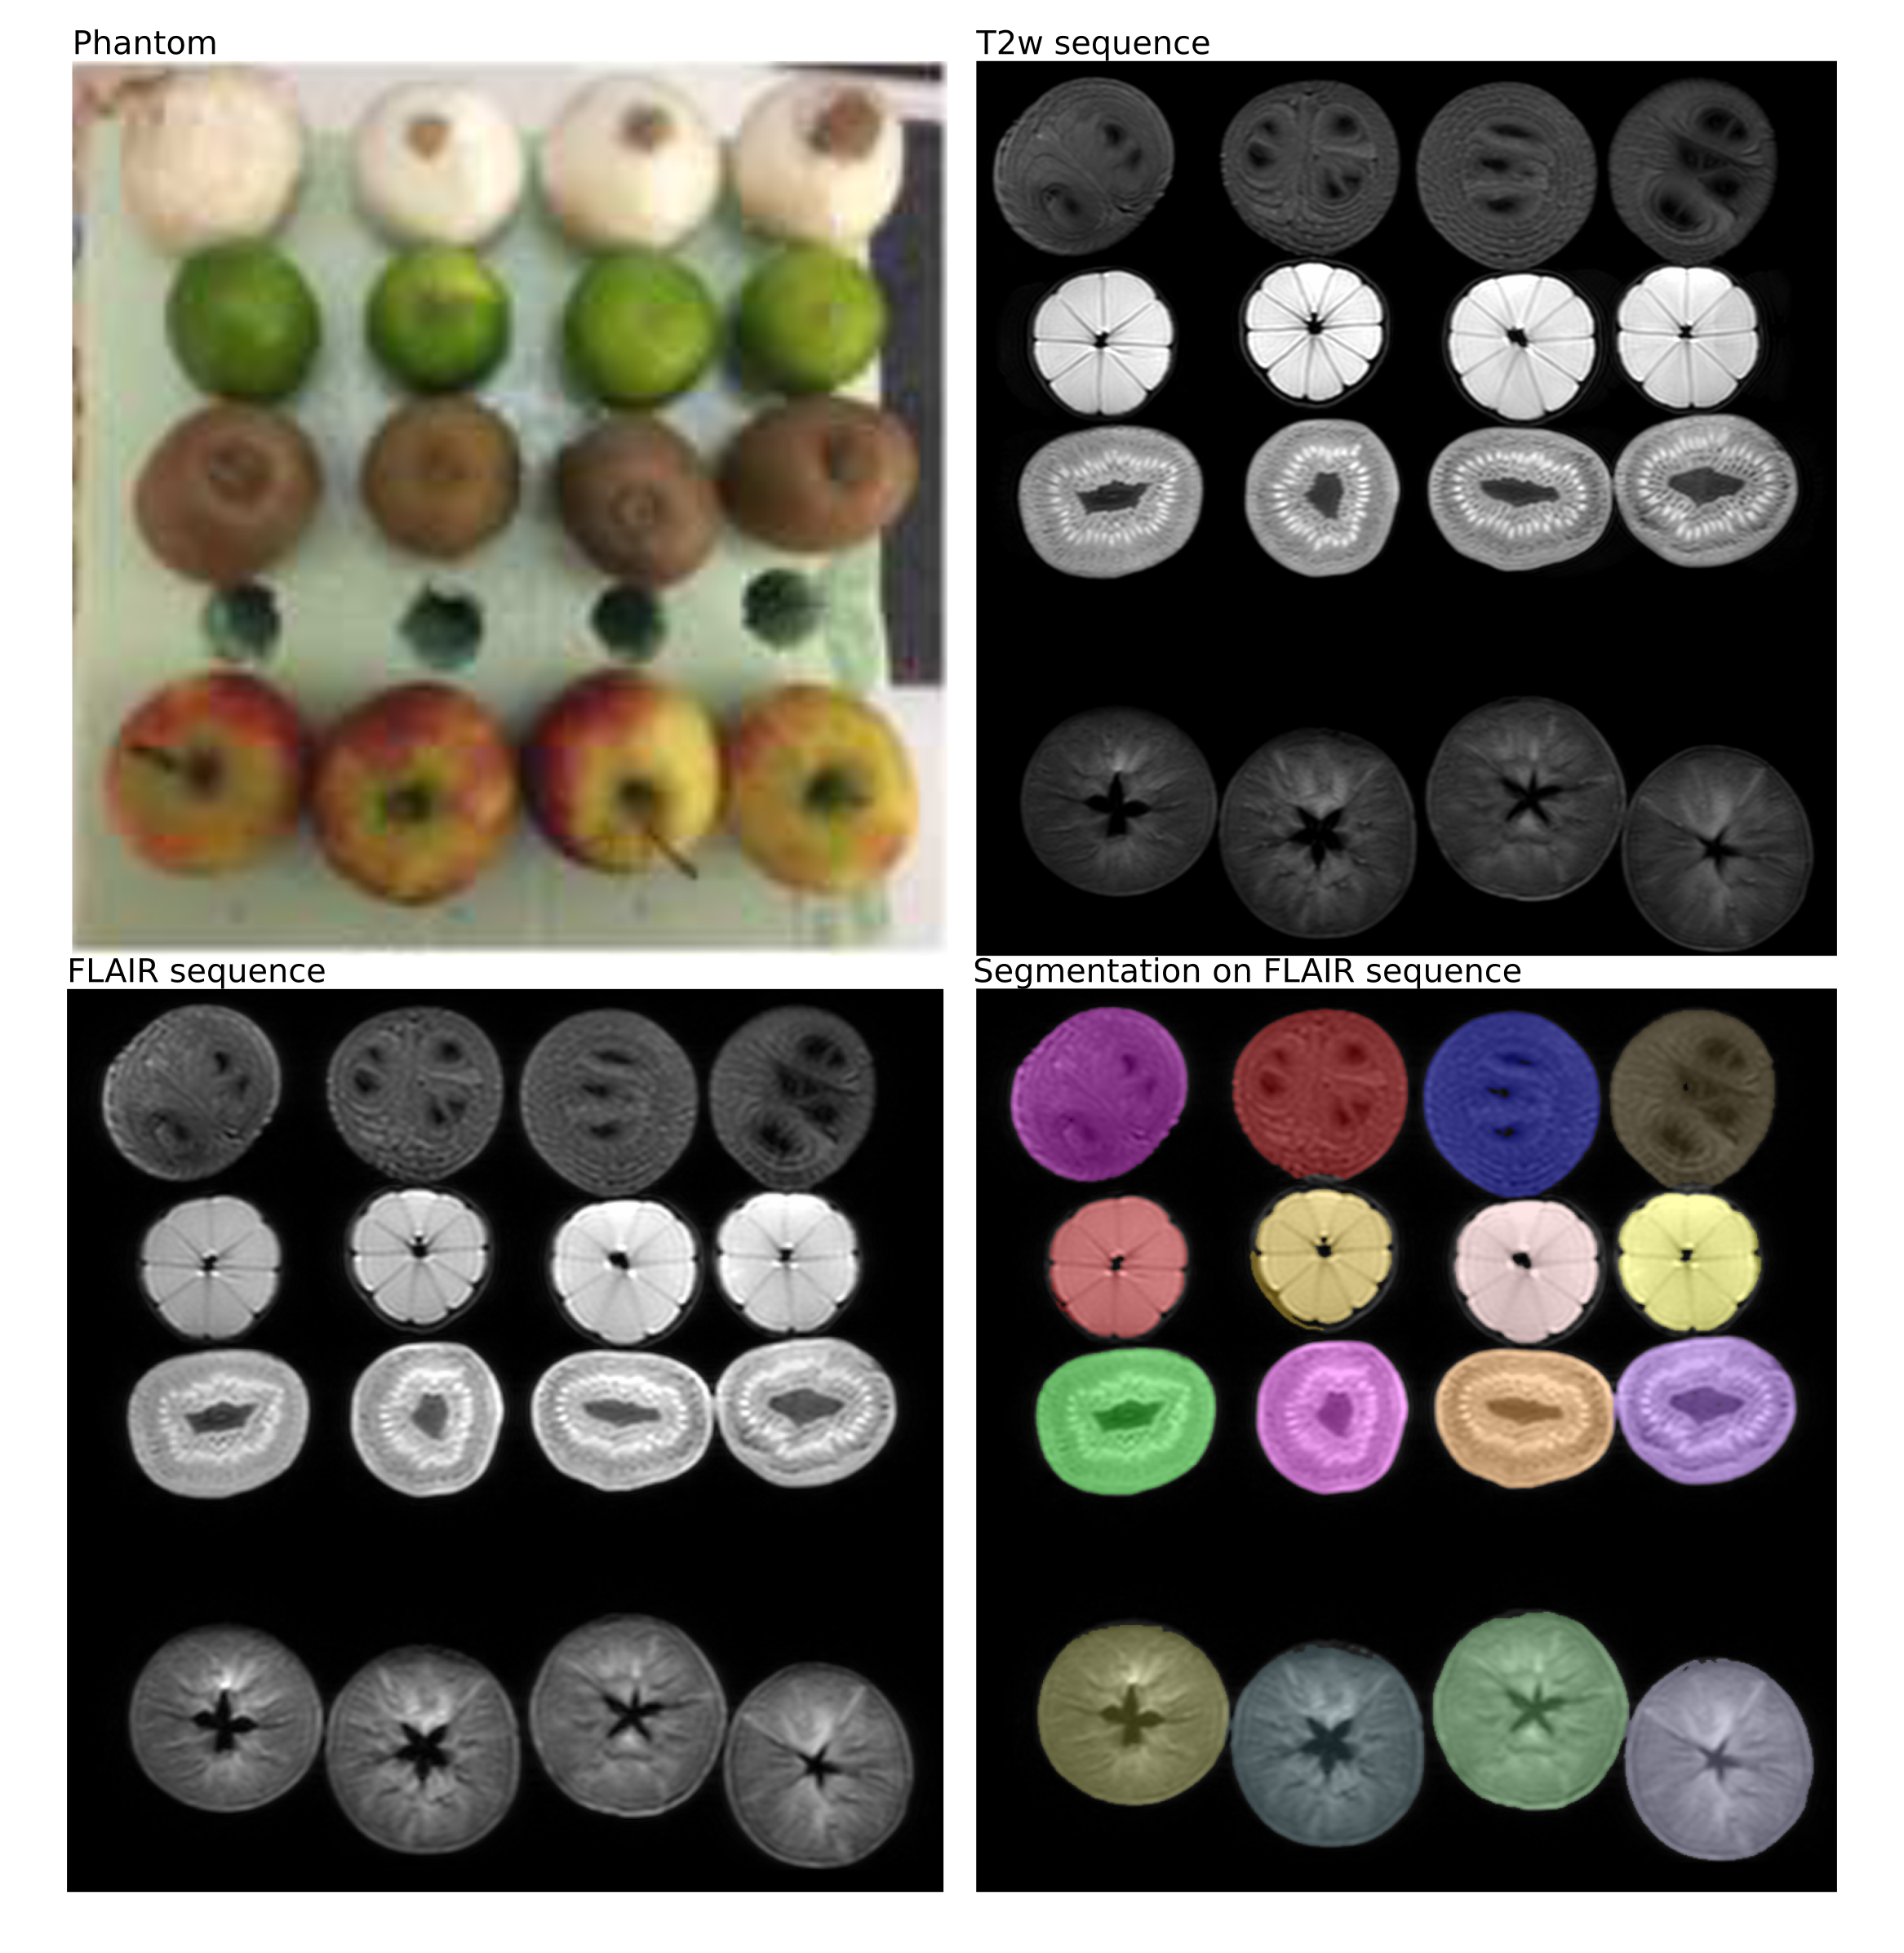
Figure 1 Representing different signal intensities, shapes, and tissue textures, a total of 4 onions, 4 limes, 4 kiwifruits, and 4 apples were scanned within a box made out of Styrofoam as our radiomics phantom. Shown are exemplary images of the phantom (upper left), acquired with a T2w sequence (upper right), a FLAIR sequence (lower left) and after segmentation (lower right).


Figure 2 Percentage of robust features for low-resolution FLAIR (above) and low-resolution T2w (below) for each resampling step. Robustness is shown for cut-off CCC and DR≥0.90.
The percentage of robust features tended to be higher for FLAIR than for T2w. For FLAIR imaging, image processing with spatial resampling of 1.25x1.25x1.25[mm], intensity discretization with 32 grey-levels and mean±3 standard deviations relative intensity rescaling delivered the highest percentage of robust features (n=34/45,76%), whereas for T2w imaging, highest robustness (n=36/45,80%) was achieved by using a spatial resampling of 1x1x1[mm], intensity discretization with 32 grey-levels and min<>max relative intensity rescaling as image processing settings.

Figure 3 Reproducibility of grey level run length based texture features for all 2-27 resampling steps. Varying image processing parameters leads to considerable differences of the individual features.
GLRLM grey level run length matrix, SRE–Short runs emphasis, LRE–Long runs emphasis, LGRE–Low grey level run emphasis, HGRE–High grey level run emphasis, SRLGE–Short run low grew level emphasis, SRHGE–Short run high grey level emphasis, LRLGE–Long run low grey level emphasis, LRHGE–Long run high grey level emphasis, GLNU–Grey level non-uniformity, RLNU–Run length non-uniformity, RP–Run percentage.