4469
The Effect of Membrane Lipids on qMT Exchange Constants1The Hebrew University, Jerusalem, Israel
Synopsis
Quantitative Magnetization Transfer(qMT) is a proposed method for deeper characterization of brain tissue. Yet, a connection between qMT parameters and the components of cellular tissue is required. Myelin is composed of various types of lipids, which their amount and composition are changed between brain areas, disease states and across the lifespan. In this work, we formulated liposomes to model the environment of abounded lipids in the human brain and systematically estimated their effect on qMT parameters. We found qMT technique useful to identify differences between lipids. This result can pave the way to future research the molecular environments of human tissue in-vivo.
Introduction
Myelin is a major component of the cell membrane and is known to highly affect the MRI contrast between grey and white matter areas1. Myelin is composed of various types of lipids, which their amount and composition are changed between brain areas, disease states and across the lifespan2. Quantitative Magnetization Transfer (qMT) is a proposed method for deeper characterization of brain tissue3. This method enables the separation between the free and bound water pools. It was found that qMT parameters are different between brain areas and across disease states. However, a direct connection between those qMT parameters to the components of cell tissue is required. In this work, we systematically measured the effect of membrane lipids on the qMT parameters. Does different lipids have distinguishable magnetization exchange constants? To answer this question, we used the four major SPGR qMT models (implemented in qMT lab software3) to fit our data . First, we compare the reliability and stability of the models. Second, we compare the lipids qMT parameters (F ,Kr and Kf) of each lipid and the dependency between them. Last, we compare the dependency between those qMT parameters to the quantitative MRI (qMRI) parameter WF.Methods
We manufactured phantoms, containing the most abundant lipids in the human brain4,5: Phosphatidylcholine(PC), Phosphatidylethanolamine(PE), Phosphatidylserine(PS), Phosphatidylinositol(PI), Sphingomyelin(Spg) and Cholesterol. Using the thin layer evaporation-hydration technique6,7 we prepared liposomes in order to model cellular lipid membranes. Cuvettes with liposomes samples were placed in a polystyrene container filled with Agarose+Gd (Gadopentetic) solution. To investigate the influence of those liposomes on relaxation, we scanned the container in a 3T field and estimated the following qMRI parameters: PD & T18,9, T210, MTnorm(defined as MTon/MToff) and multiple qMT parameters such as F, Kr and Kf with the use of qMT Lab software3. In order to validate the reliability of the fitting models, we performed cross-validation leave one out analysis.Results
First, we compare the cross-validation error and found that all four models were highly reliable (Figure 1). Comparing the stability of the qMT parameters estimation11 between scan-rescan experiments we found the parameters to be consistent (Figure 2). Next, we compare the dependence between the qMT parameters and found that Kr, Kf and F are highly correlated to each other (Figure 3). Last, we tested the dependency between the qMT parameters and the qMRI parameter WF (Figure 4). We expected that F, which reflect the bound and free pool fractions, will change directly with WF. Indeed, we found that F changes with WF, however, we also found that F is changing as a function of the lipid type (Figure 4a). We found that a strong dependency between MTnorm and WF is predictive for high estimated F value. Furthermore, we found that the qMT model parameters Kf and Kr are different between different lipids types. Surprisingly Kf and Kr were also changing as a function of the WF. Importantly, we noted that the variation of Kr and Kf between the lipids groups is higher than the variation within each lipids Kr and Kf to its WF. Here again, we found, that the Kr and Kf parameters values are higher for lipids that have a strong MTnorm to WF dependency.Discussion
In this work, we implemented a system that allows the control of lipids composition and as well their WF. We found the qMT models to be reliable and consistent. Furthermore, we found that different lipids have different exchange constant. Importantly, this difference is not independent of the WF of the lipids sample. This unexpected dependency raises a question in regard to the model assumptions such as the first-order rate equation for the exchange in the qMT models. We found that the qMT parameters are highly dependent. Furthermore, we found that the qMT parameters are highly correlated, and as well, depended on the WF.Conclusions
In this work, we highlight the power of qMT technique to identify differences between lipids. This result can pave the way to future research the molecular environments of human tissue in-vivo.Acknowledgements
No acknowledgement found.References
1. Cercignani, M., Dowell, N. G. & Tofts, P. S. Quantitative MRI of the Brain : Principles of Physical Measurement, Second edition.
2. Svennerholm, L., Boström, K., Jungbjer, B. & Olsson, L. Membrane lipids of adult human brain: lipid composition of frontal and temporal lobe in subjects of age 20 to 100 years. J. Neurochem. 63, 1802–1811 (1994).
3. Cabana, J.-F. et al. Quantitative magnetization transfer imaging made easy with qMTL ab : Software for data simulation, analysis, and visualization. Concepts Magn. Reson. Part A 44A, 263–277 (2015).
4. Veloso, A. et al. Distribution of lipids in human brain. Anal. Bioanal. Chem. 401, 89–101 (2011).
5. Krafft, C., Neudert, L., Simat, T. & Salzer, R. Near infrared Raman spectra of human brain lipids. Spectrochim. Acta - Part A Mol. Biomol. Spectrosc. 61, 1529–1535 (2005).
6. Akbarzadeh, A. et al. Review Article LIPOSOME : METHODS OF PREPARATION AND APPLICATIONS. Liposome Technol. 6, 102 (2013).
7. Monteiro, N., Martins, A., Reis, R. L. & Neves, N. M. Liposomes in tissue engineering and regenerative medicine. J. R. Soc. Interface 11, 20140459–20140459 (2014).
8. Mezer, A., Rokem, A., Berman, S., Hastie, T. & Wandell, B. A. Evaluating quantitative proton-density-mapping methods. Hum. Brain Mapp. 37, 3623–3635 (2016).
9. Mezer, A. et al. Quantifying the local tissue volume and composition in individual brains with magnetic resonance imaging. Nat. Med. 19, 1667–72 (2013).
10. Ben-Eliezer, N., Sodickson, D. K. & Block, K. T. Rapid and accurate T2 mapping from multi-spin-echo data using bloch-simulation-based reconstruction. Magn. Reson. Med. 73, 809–817 (2015).
11.Ramani, A., Dalton, C., Miller, D. H., Tofts, P. S. & Barker, G. J. Precise estimate of fundamental in-vivo MT parameters in human brain in clinically feasible times. Magn. Reson. Imaging 20, 721–731 (2002).
Figures
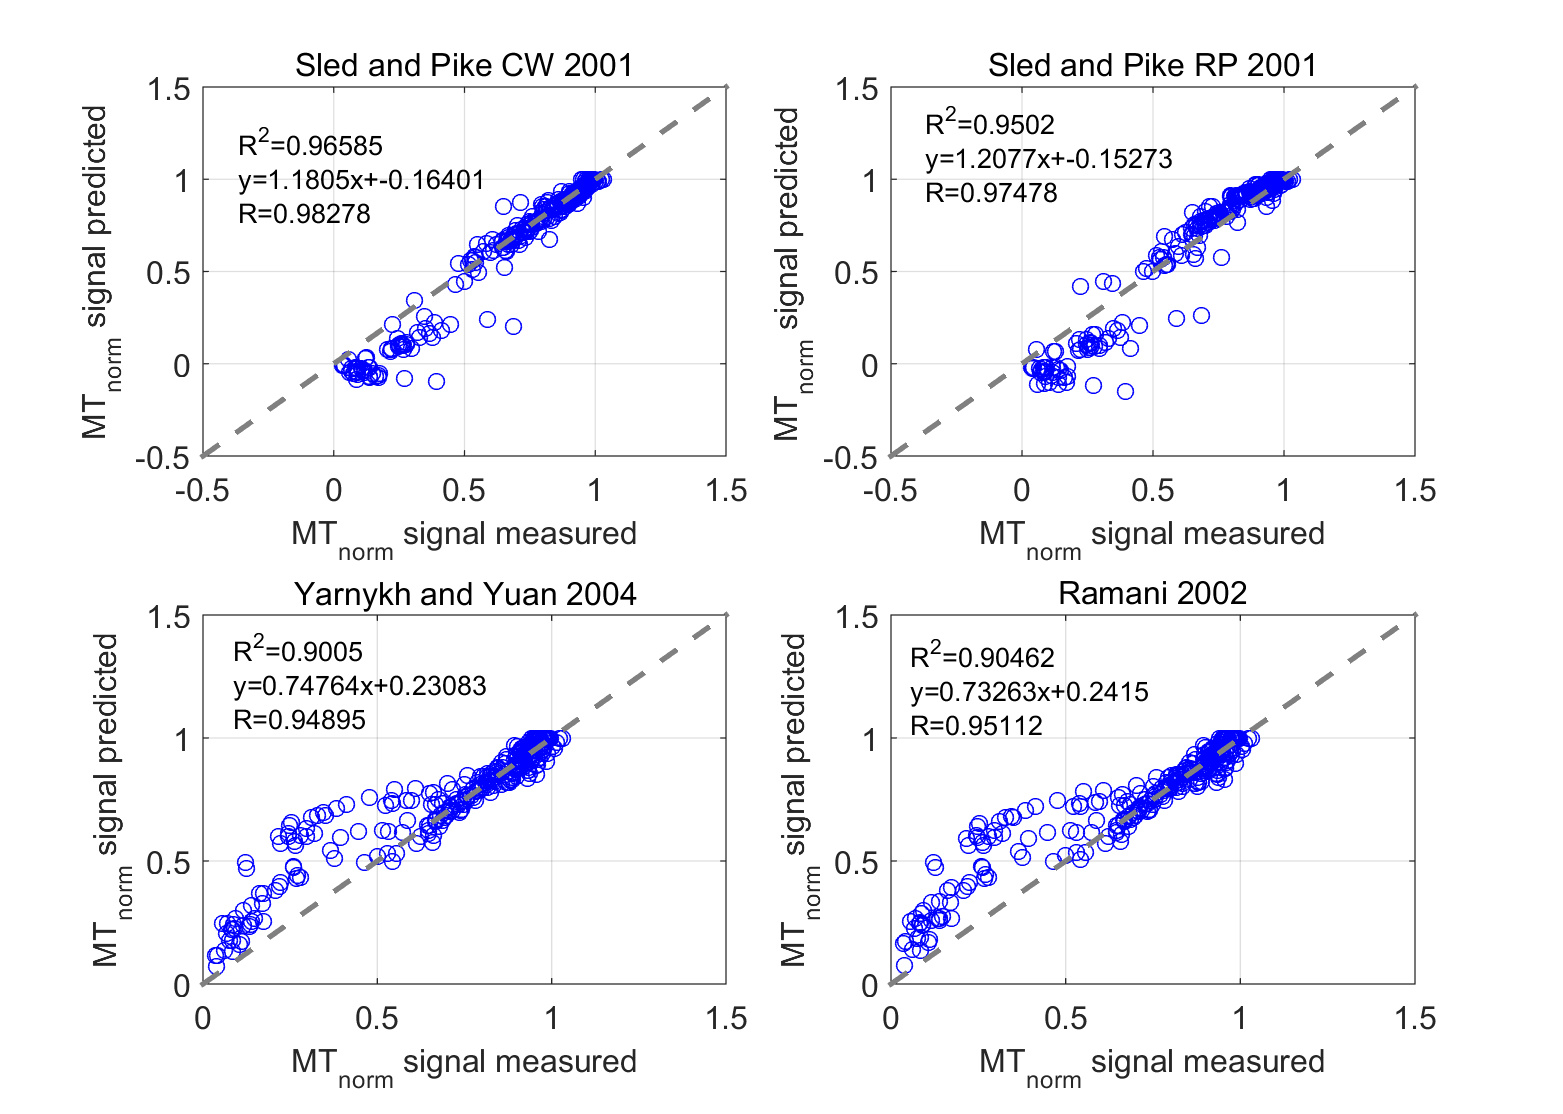
Cross validation:
A comparison between the predicted MTnorm values, with the use of leave one out cross validation technique, to the true MTnorm values for four chosen SPGR qMT models. The estimations were done for each RF pulse, within a given MT power flip angle. Each point represents the median of a sample lipid, in a specific RF pulse and MT power flip angle. The dashed line is the Identity line and R2 is the coefficient of determination for the linear fit(y).

Stability between days:
A comparison between the estimated F,Kr and Kf parameters between two different days of scan-rescan experiments using Ramani’s model. Each point represents different lipids in a various of WF values. The dashed line is the Identity line and R2 is the coefficient of determination for the linear fit(y). Similar results were obtained with other models
Dependency between qMT parameters:
The qMT parameters Kf,Kr and F
(using Ramani’s model) are depended. Each color represents different lipid and
each point within the same color represent a various samples median values. Similar results were obtained with other models
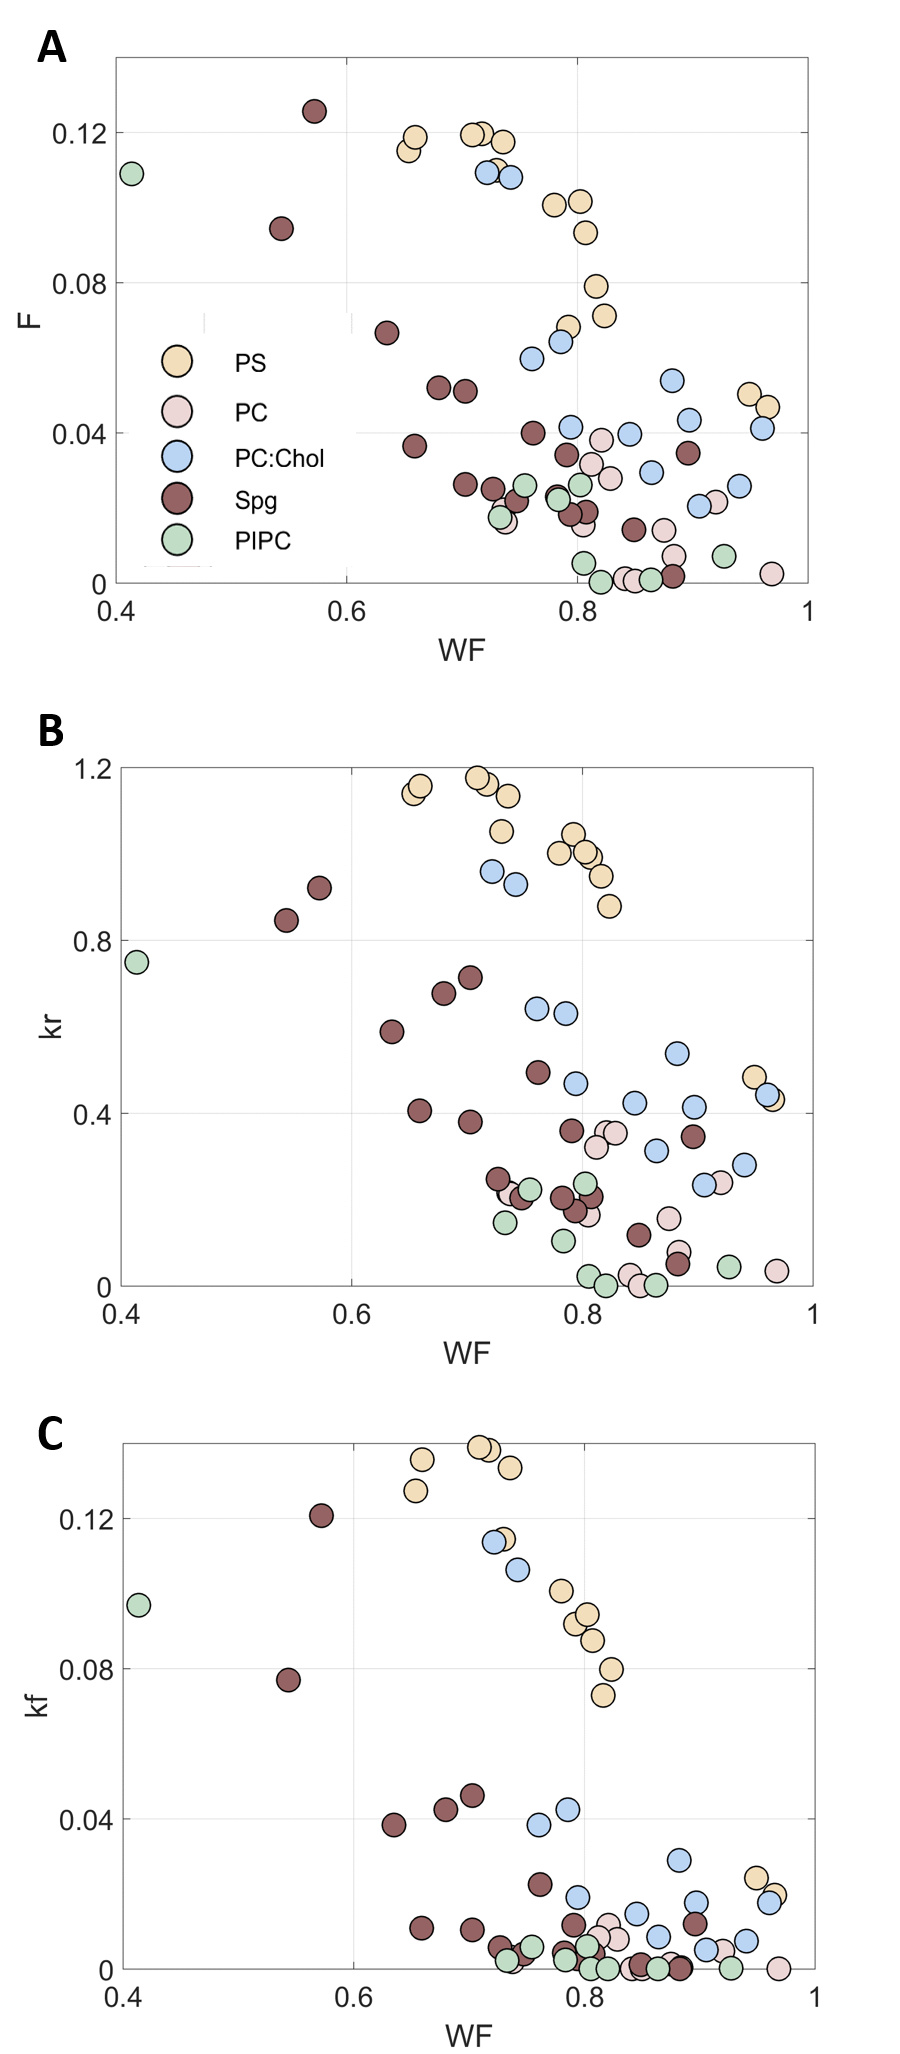
The qMT parameters F,Kr and Kf (using Ramani’s model) are plotted against WF. Each color represents different lipid, and each point within the same color represent the sample median values in various WF. Similar results were obtained with other models.