4467
In-vivo cardiac DTI using motion compensated optimized diffusion encoding (MODE): A reproducibility study1Radiology, Ohio State University Wexner Medical Center, Columbus, OH, United States, 2Center for Biostatistics, Ohio State University Wexner Medical Center, Columbus, OH, United States
Synopsis
Diffusion-weighted imaging (DWI) is used to identify heterogeneous infarcted region by calculating ADC(apparent diffusion coefficient) and FA(fractional anisotropy). However, performing DWI in heart is very challenging because of heart motion. Earlier method used convex optimized diffusion encoding (CODE) to optimize diffusion encoding gradients (DEG) waveform. However, due to limitations of CODE waveforms, earlier we proposed motion compensated diffusion encoding (MODE) to achieve higher b-value for a given DEG duration. The aim of this study is to validate and assess the reproducibility of MODE technique in computing ADC and FA maps in healthy subjects. Preliminary results demonstrated good reproducibility using MODE.
Background
Previous studies showed that the Diffusion-Weighted imaging (DWI) [1] is used to identify heterogeneous infarcted regions by calculating apparent diffusion constant (ADC) [2] and fractional anisotropy (FA) maps [3] without the need for contrast agent. ADC maps demonstrate the localization of inhomogeneous (diffusion) regions, and FA is an index to observe the degree of the deviation from the isotropic diffusion in the myocardium. However, performing diffusion imaging of the heart is very challenging because of the heart motion. Different DWI imaging techniques have been used to obtain more accurate DWI such as CODE (Convex Optimized Diffusion Encoding) method to optimize diffusion encoding gradients (DEGs) waveforms with first and second moments nulled [4]. However, due to the limitations of the CODE waveforms, earlier we proposed a technique called Motion Compensated Optimized Diffusion Encoding (MODE), to achieve a higher b-value for a given DEG duration, compared with CODE waveforms [5]. The aim of this study is to validate and assess the reproducibility of the MODE technique to calculate the ADC and FA maps in healthy subjects.Methods
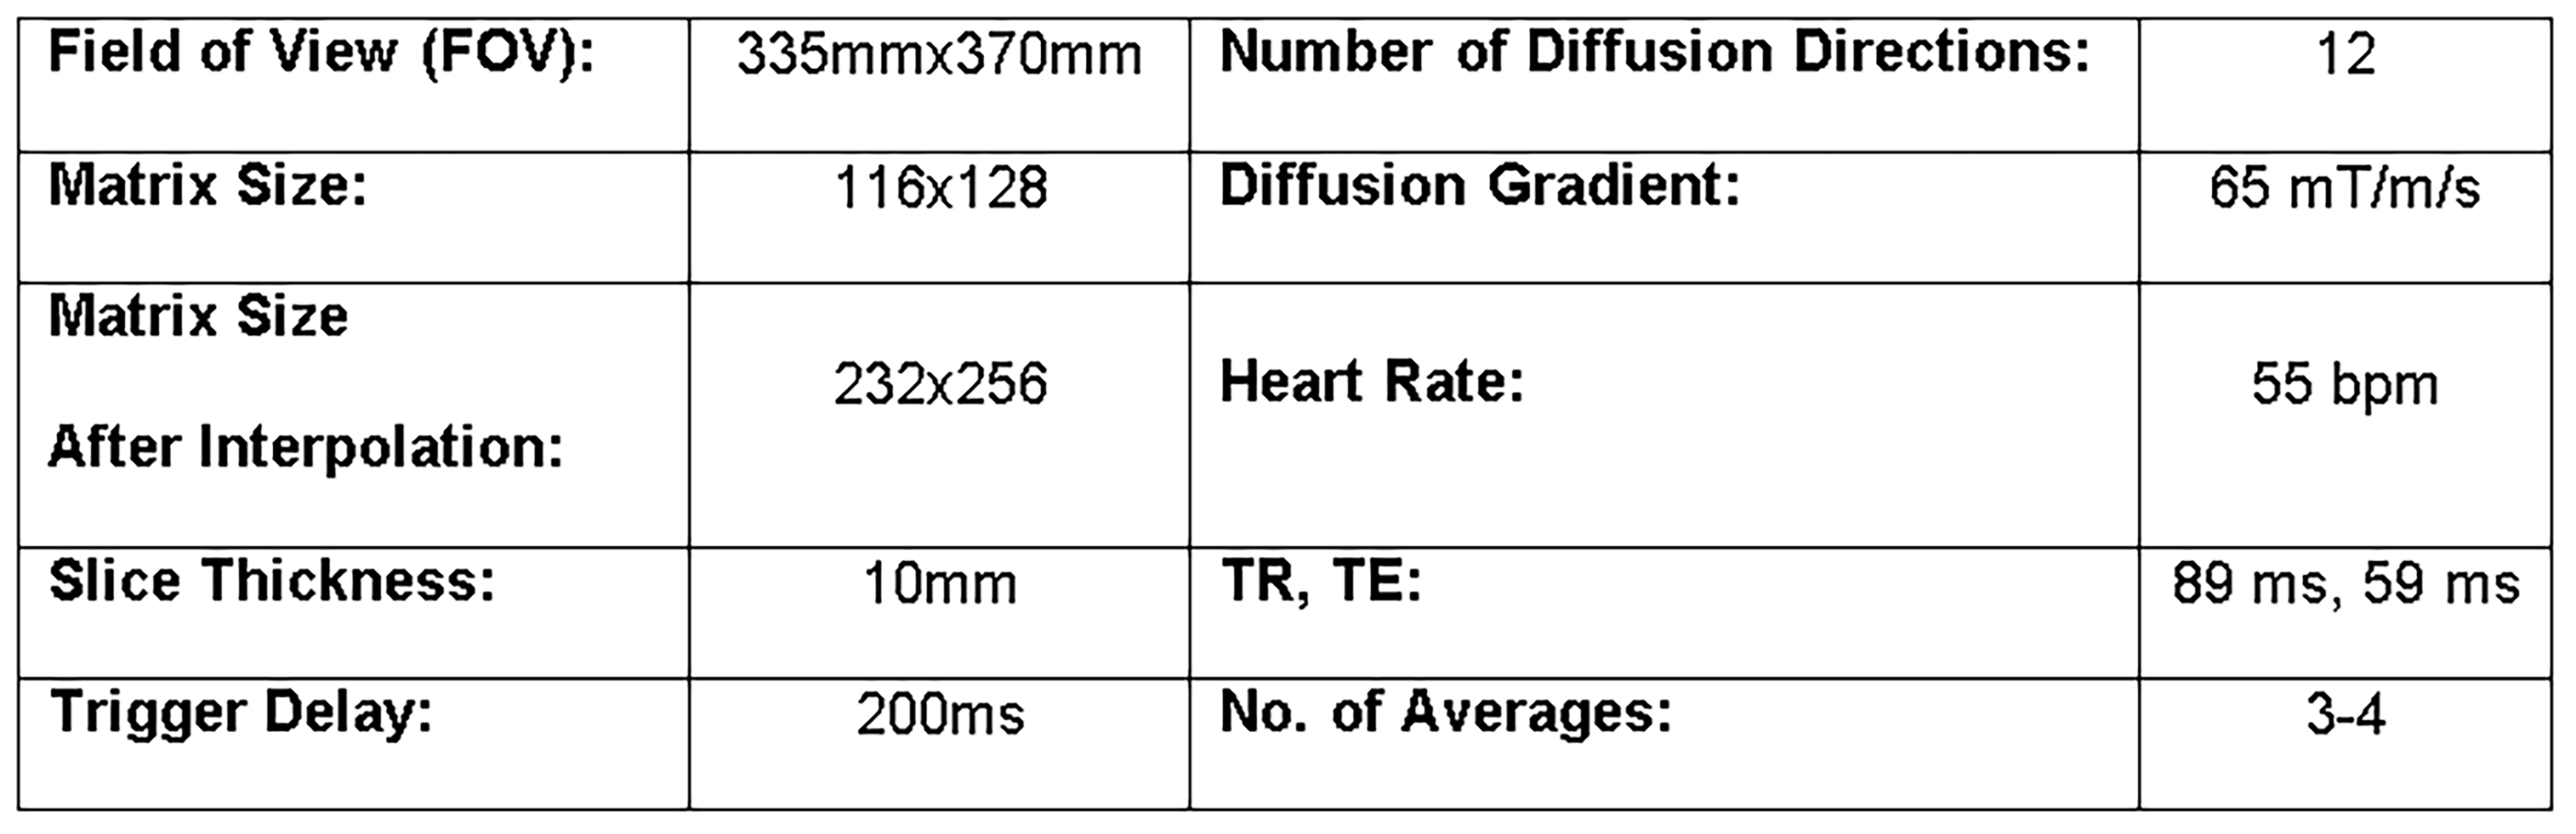
Images were acquired using a 3T MRI scanner (Prisma, Siemens Healthcare, Erlangen, Germany). Written informed consent was obtained from all volunteers (n=11; age range: 21-65 years). Mid left ventricular short-axis slice was acquired using in-vivo MODE sequence. Trigger delay was adjusted to somewhere around 200 ms to capture systolic phase. Imaging parameters are summarized in Table I. For reproducibility study, after first scan each volunteer was asked to step out of the scanner and repositioned for repeat scan keeping all imaging parameters the same. Perona-malik [6] filter was applied to the registered data to reduce the noise in raw diffusion directions data. Images were registered along diffusion direction and also among averages using MOCO (motion correction) from Siemens. Eigen values were computed using single value decomposition in MATLAB. Bland-Altman plot was generated to analyze the reproducibility in ADC and FA measurements.Results
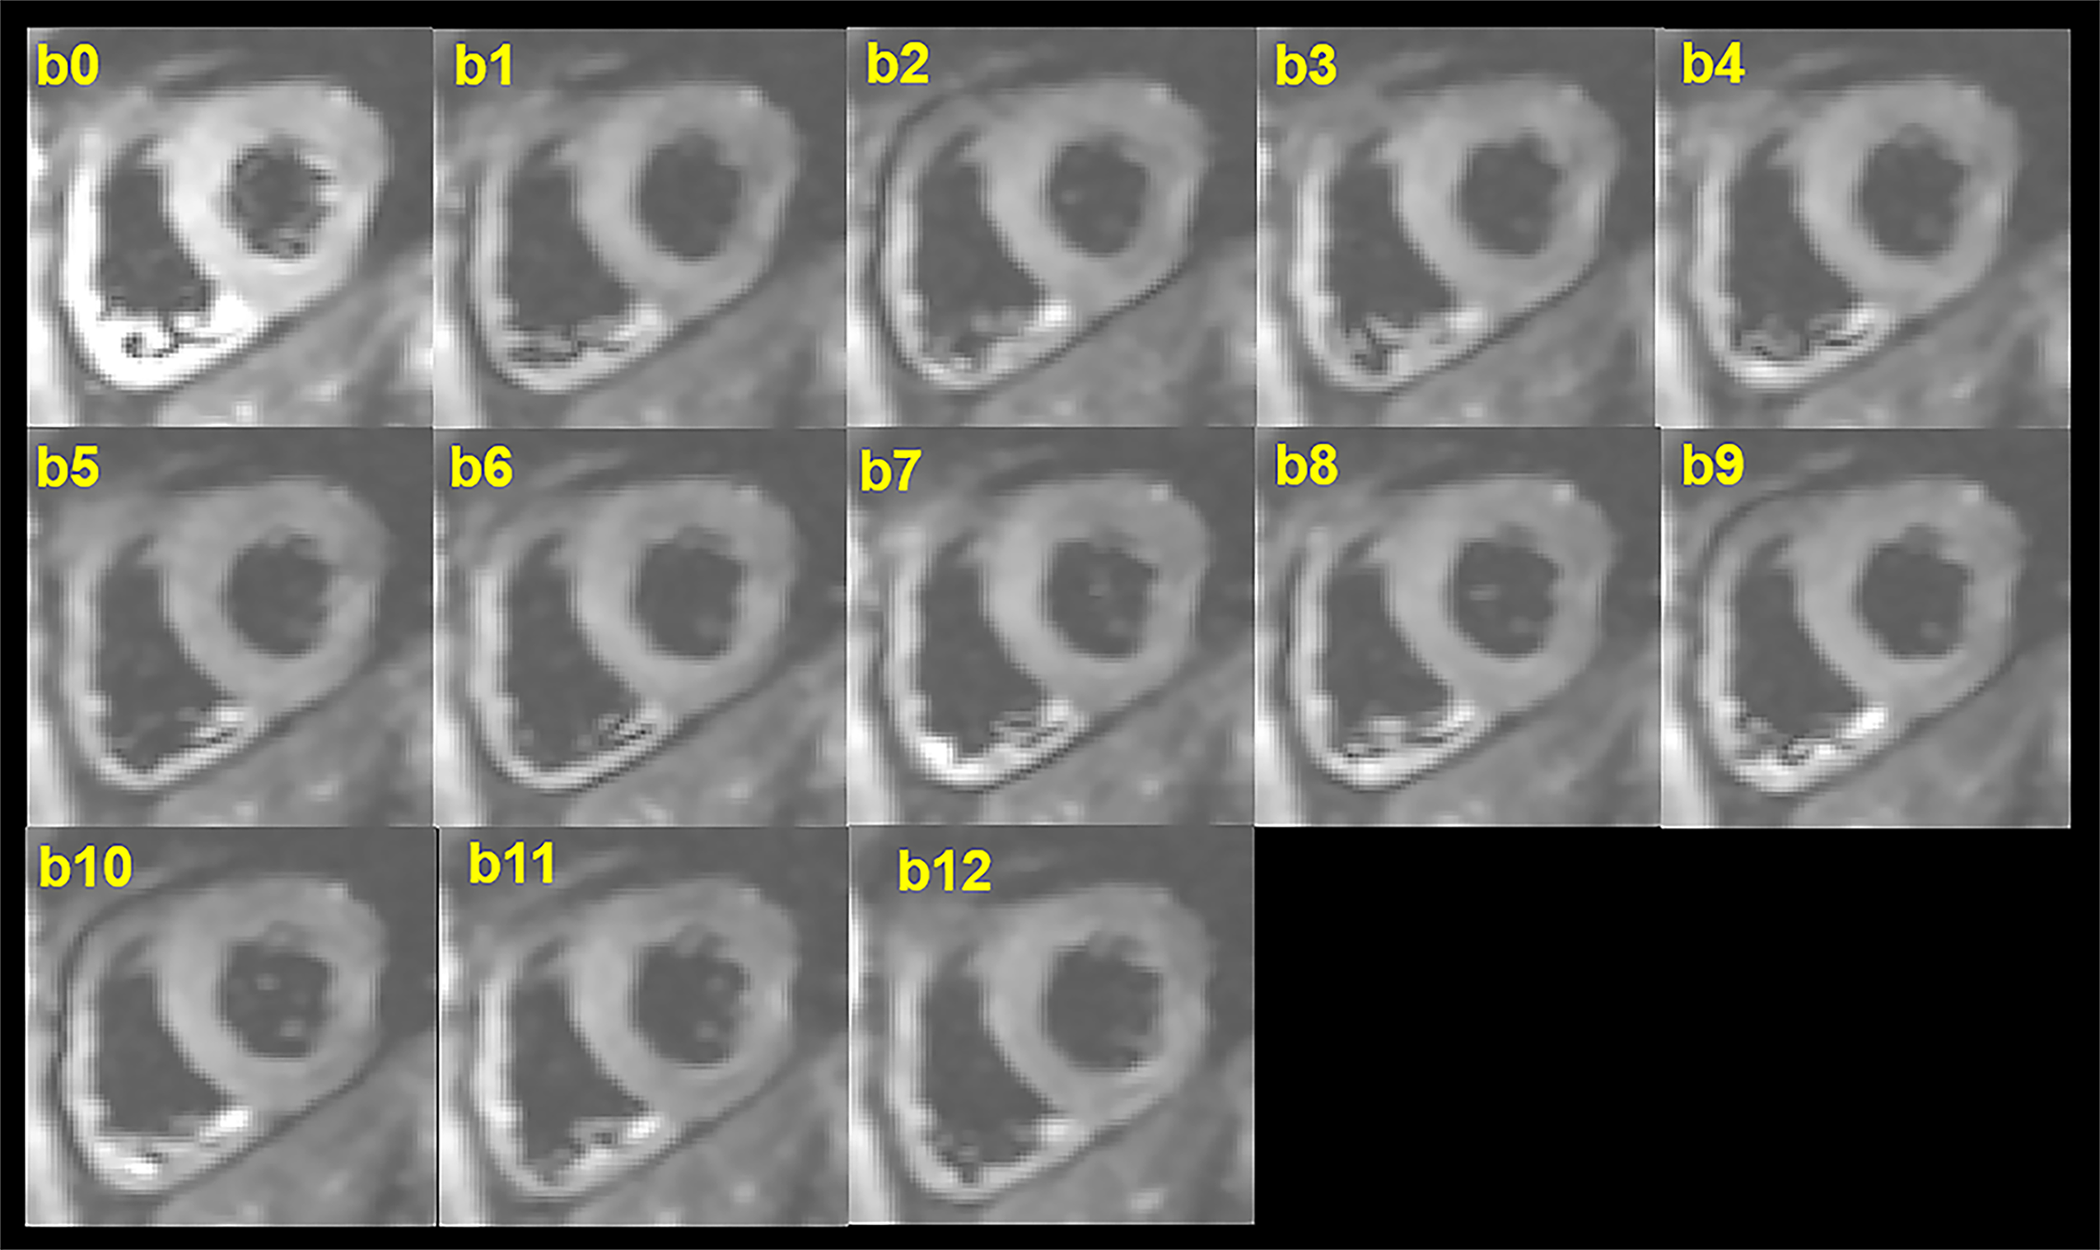
Figure 1 shows DWI images acquired using MODE demonstrating excellent image quality of images during systole.
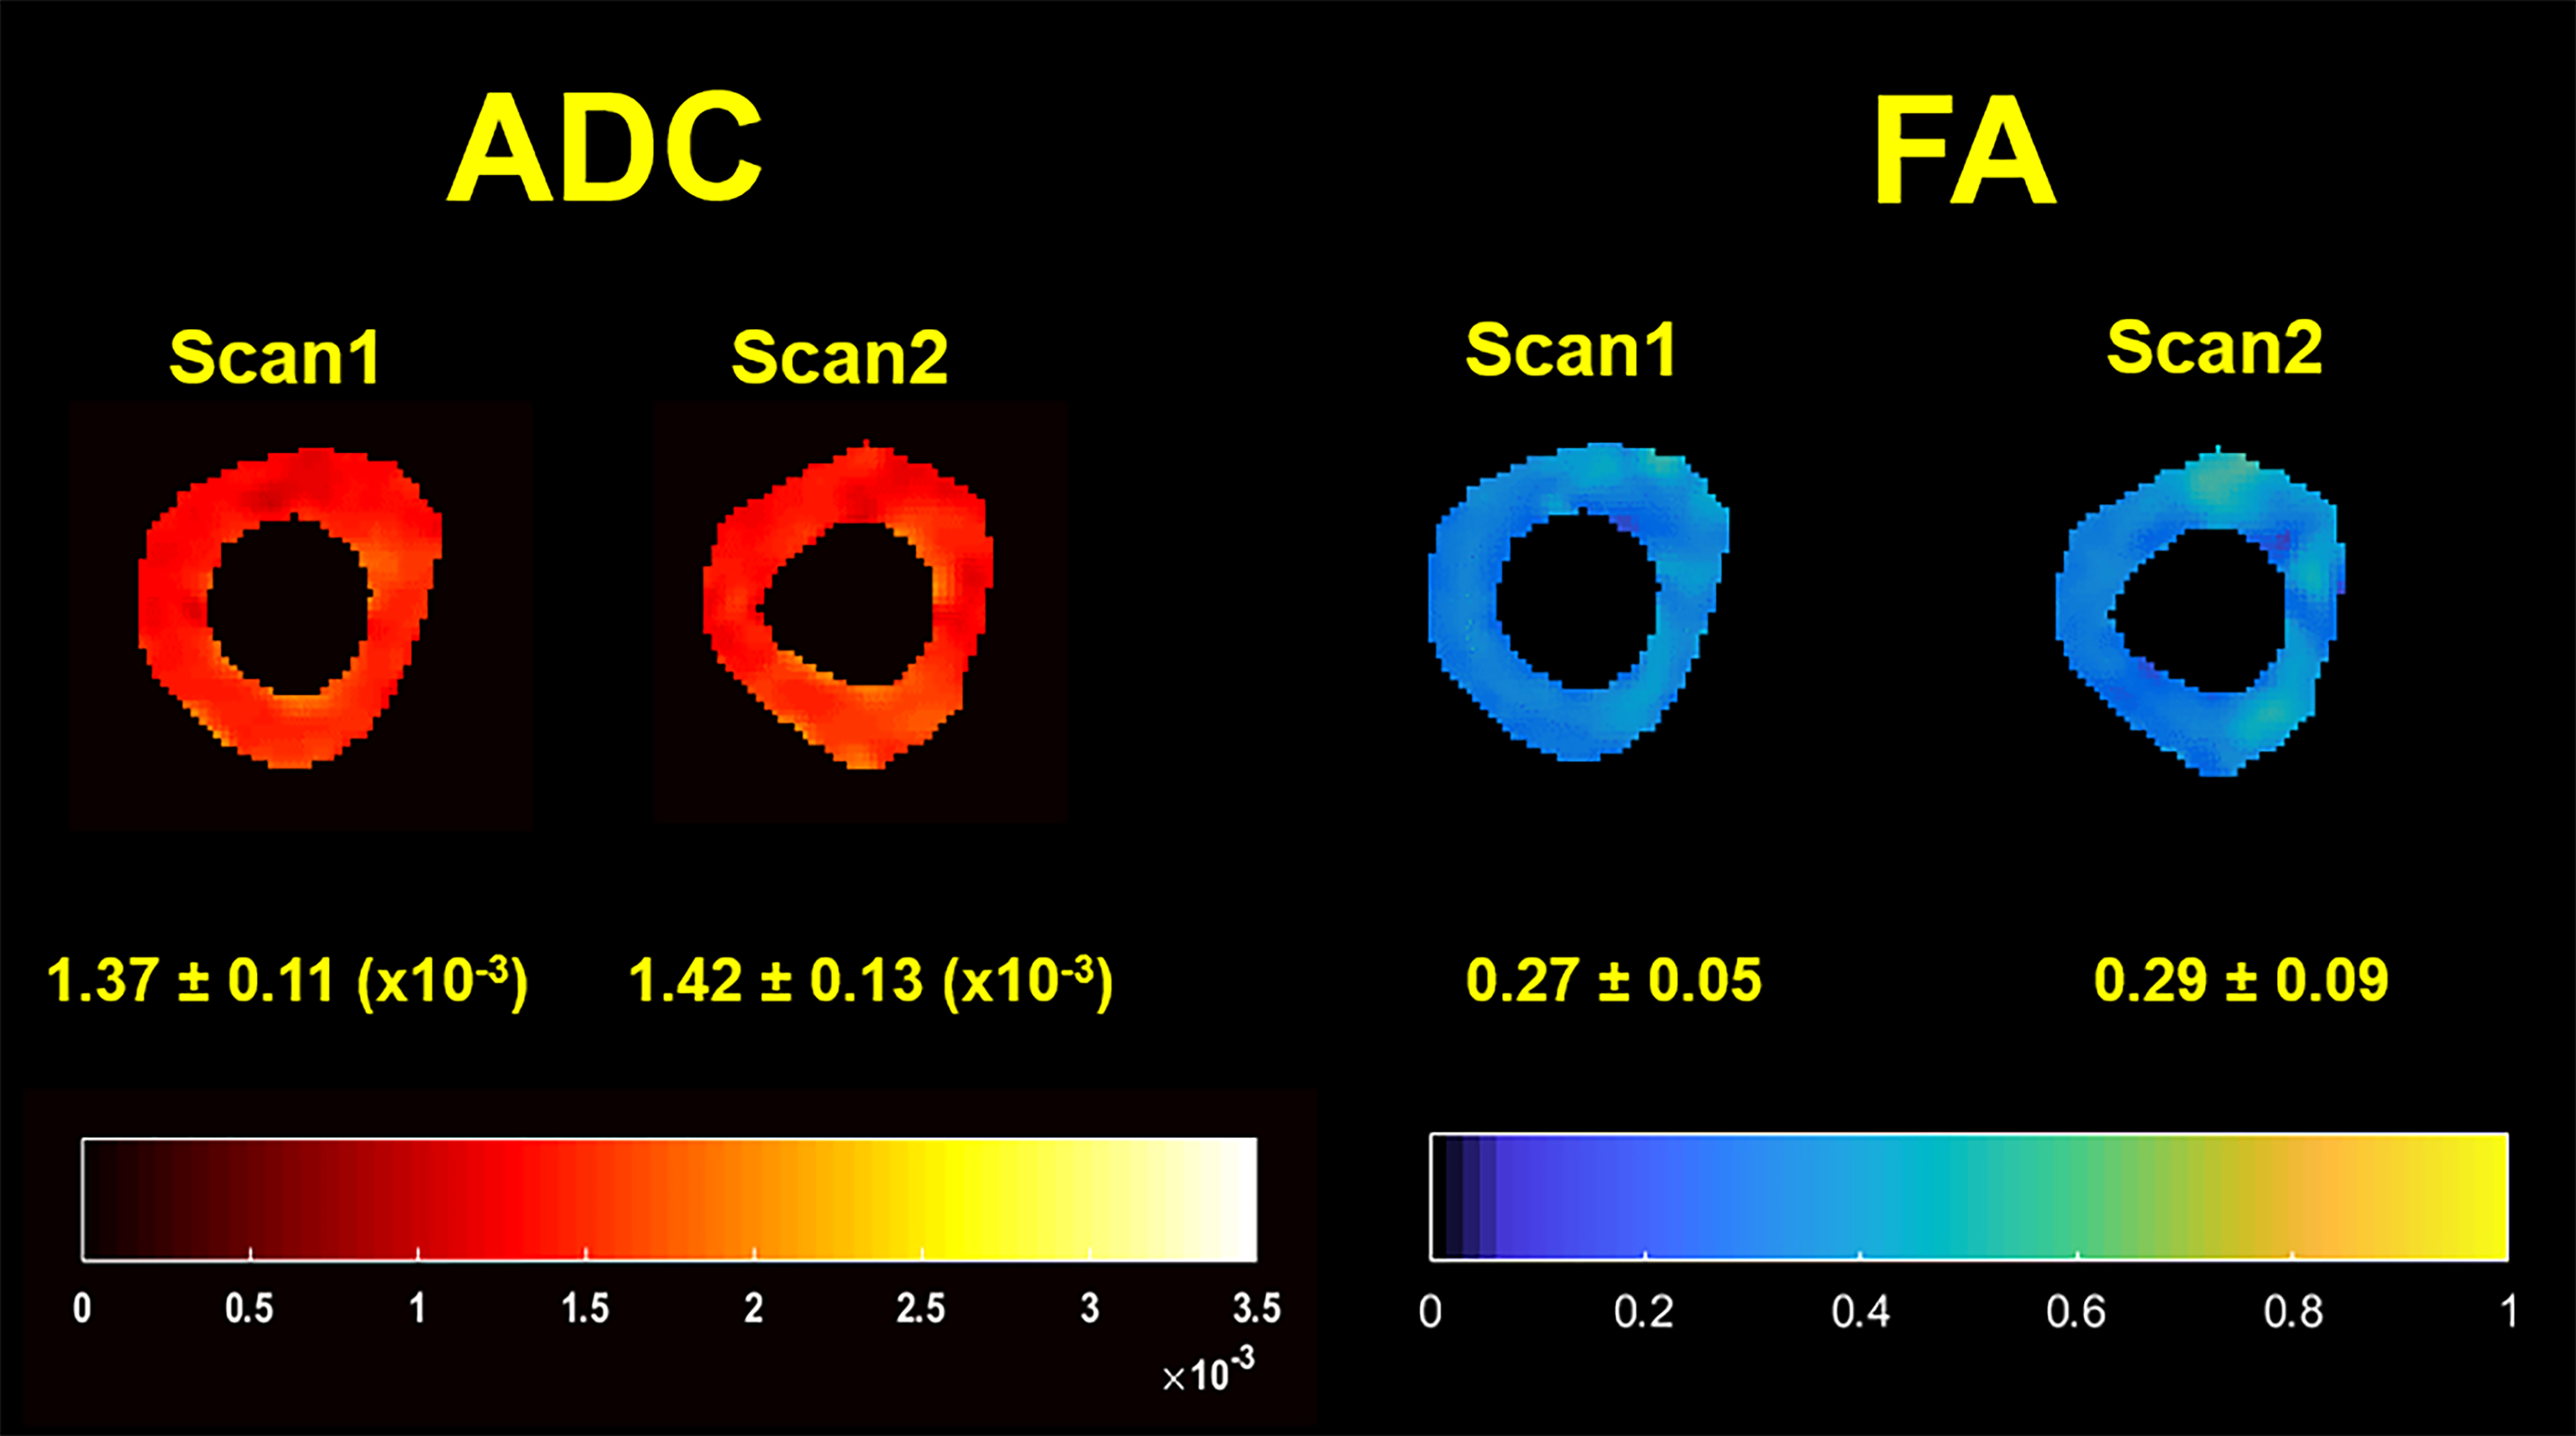
Figure 2 illustrates ADC and FA maps along with mean values in a healthy volunteer during scan 1 and scan 2.
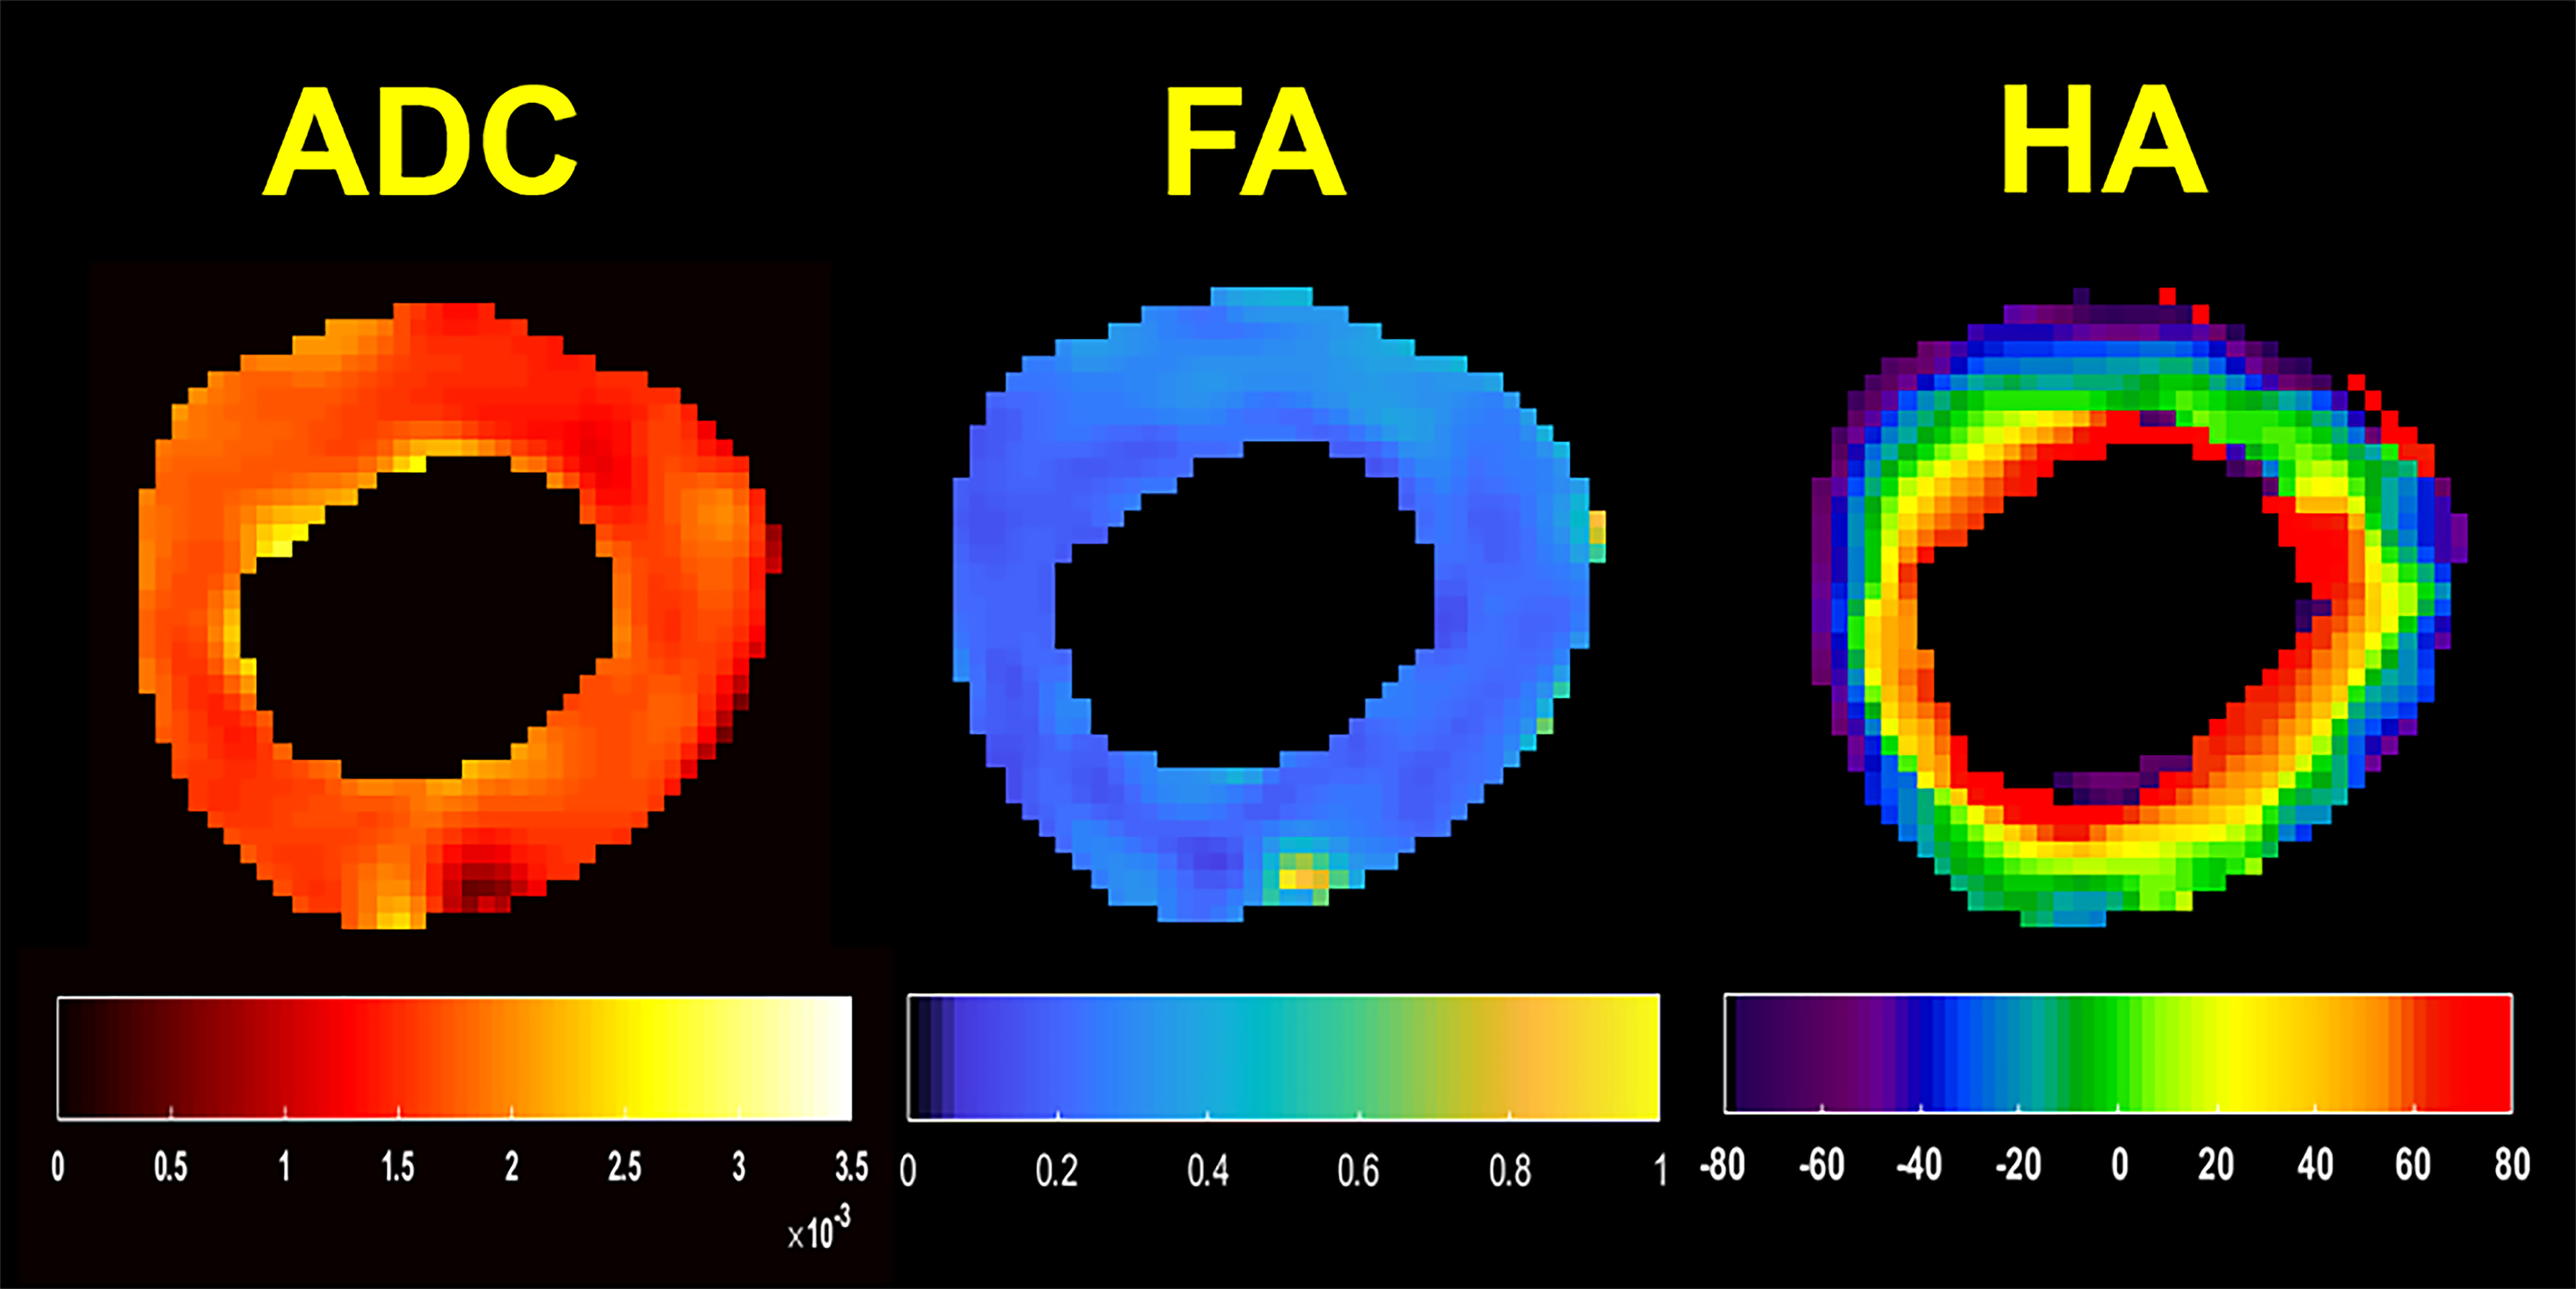
Figure 3 shows ADC, FA and Helical Angle (HA) map in a volunteer.
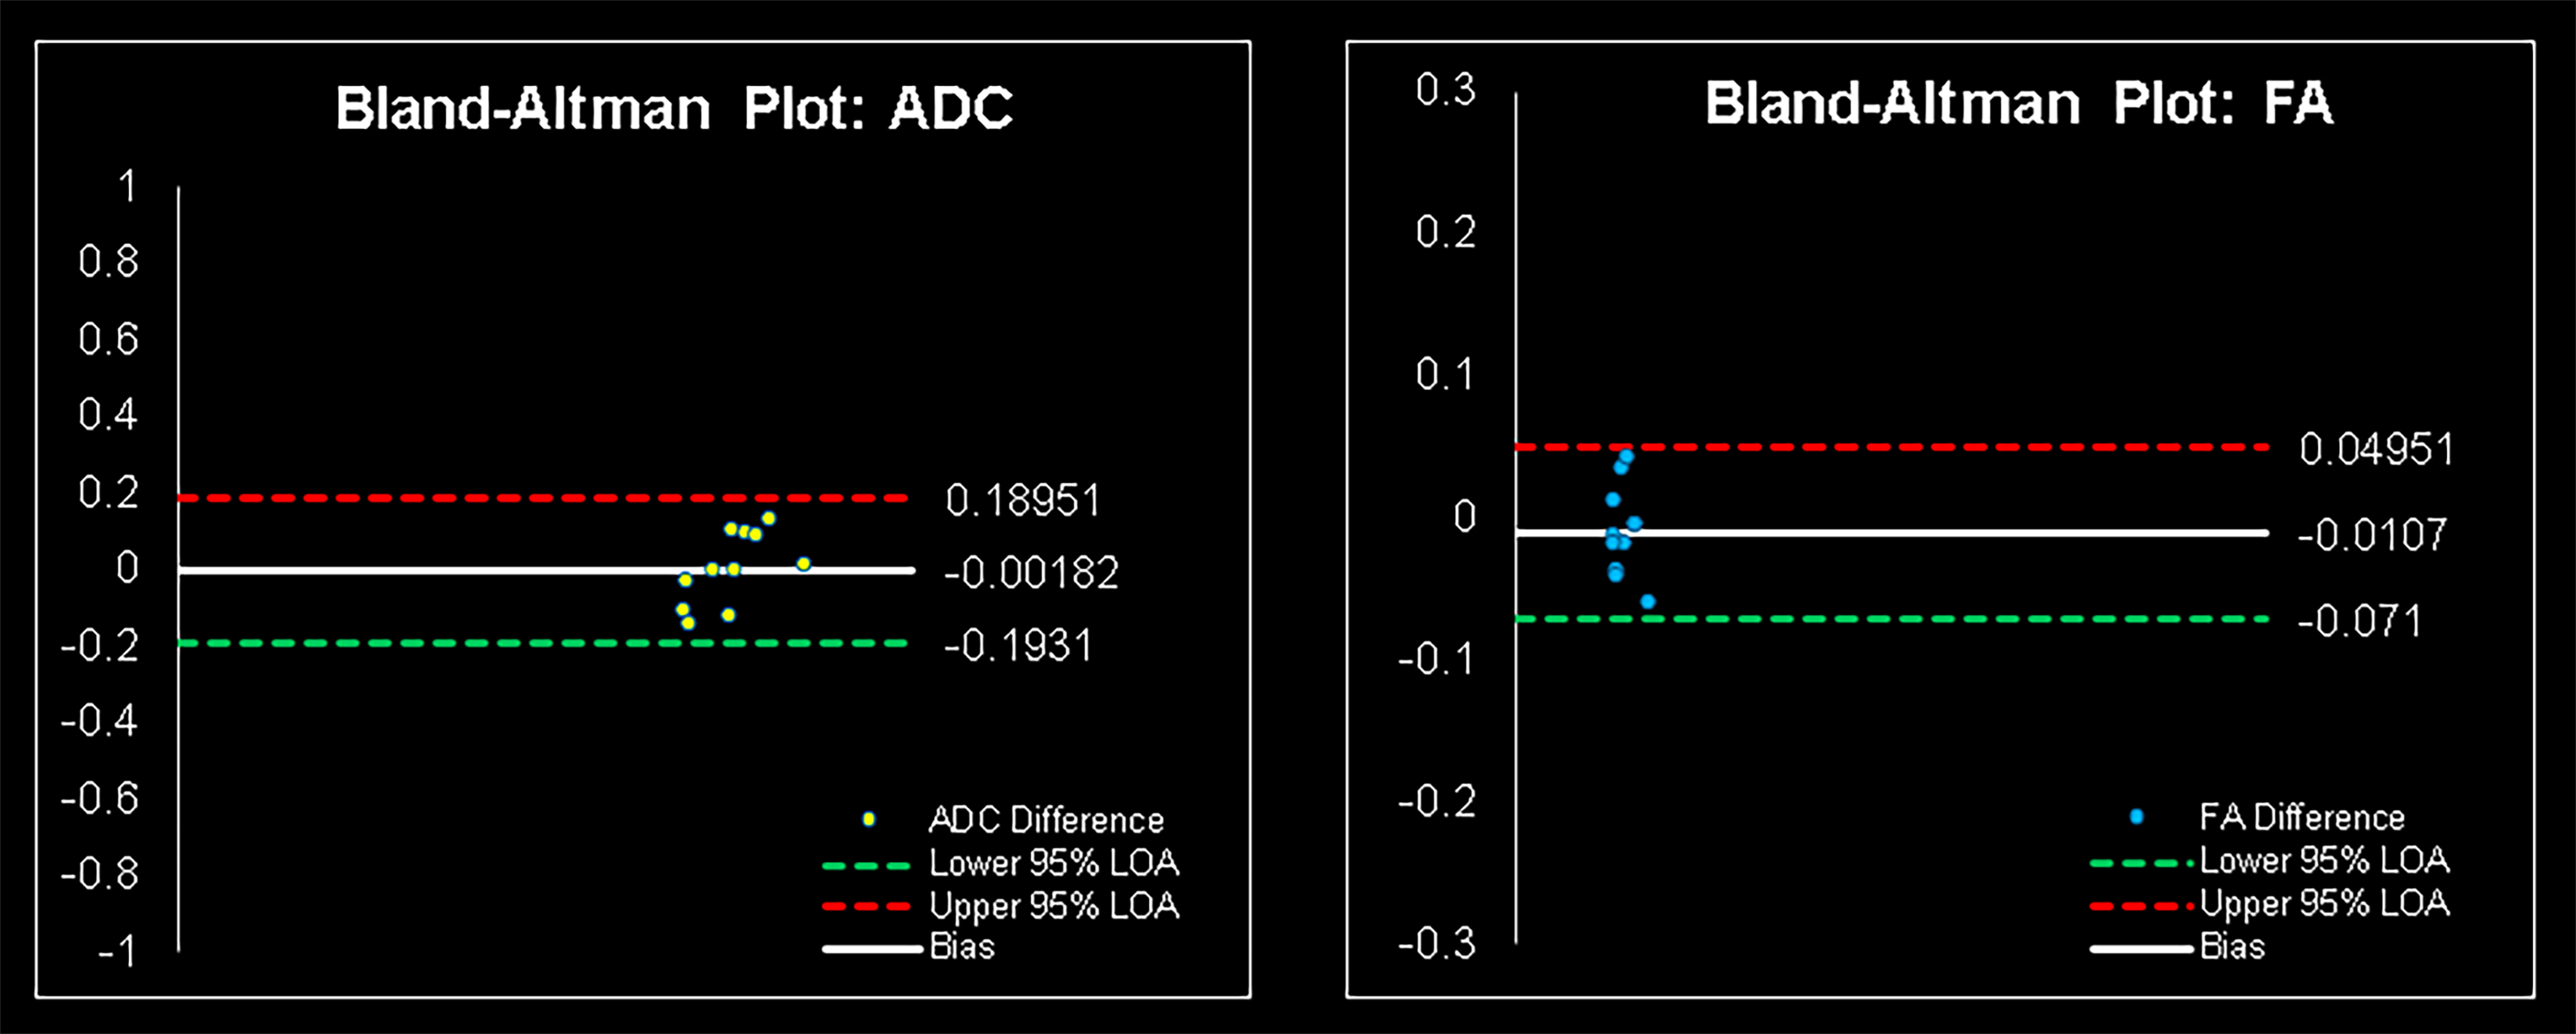
Figure 4 demonstrates Bland-Altman plots with 95% CI with mean difference of 0.002 and 0.01 for ADC and FA showing good reproducibility. Mean ADC across all healthy subjects was found to be 1.513 ± 0.140 (x10-3) mm2/s and 1.515 ± 0.083 (x10-3) mm2/s in scan 1 and scan 2 respectively. Similarly, mean FA across all healthy subjects was found to be 0.288 ± 0.030 and 0.298 ± 0.037 in scan1 and scan2, respectively.
Conclusion
Preliminary study demonstrates good reproducibility of MODE technique in estimating ADC and FA measurements within the left ventricle enabling further studies.Acknowledgements
This study is supported by National Institute of Health grant NIH-R01HL123096.References
[1] Sosnovik DE, Wang R, Dai G, Reese TG, Wedeen VJ. Diffusion MR tractography of the heart. Journal of Cardiovascular Magnetic Resonance. 2009 Dec;11(1):47.
[2] Mori S. Introduction to diffusion tensor imaging. Elsevier; 2007 May 17.
[3] Pop M, Ghugre NR, Ramanan V, Morikawa L, Stanisz G, Dick AJ, Wright GA. Quantification of fibrosis in infarcted swine hearts by ex vivo late gadolinium-enhancement and diffusion-weighted MRI methods. Physics in Medicine & Biology. 2013 Jul 8;58(15):5009.
[4] Aliotta E, Wu HH, Ennis DB. Convex optimized diffusion encoding (CODE) gradient waveforms for minimum echo time and bulk motion–compensated diffusion‐weighted MRI. Magnetic resonance in medicine. 2017 Feb;77(2):717-29.
[5] Waqas M , Kalra P, and Kolipaka A. Motion Compensated, Optimized Diffusion Encoding (MODE) Gradient Waveforms. 25th Sci Meet Int Soc Magn Reson Med; 2017.
[6] Perona P, Malik J. Scale-space and edge detection using anisotropic diffusion. IEEE Transactions on pattern analysis and machine intelligence. 1990 Jul;12(7):629-39.
Figures