4466
Correlating the measured fast/slow decay components of tissue sodium to the intra-/extra-cellular sodium concentrations1University of Iowa, Iowa City, IA, United States, 2GE Healthcare, Milwaukee, WI, United States
Synopsis
We have developed two models (anisotropic-anisotropic (AAS) vs. anisotropic-isotropic (AIS) models) to correlate the measured fast/slow decay components of tissue sodium to the intra-/extra-cellular sodium concentrations. The models were evaluated based on theoretical and experimental results. Our results indicate that AAS model fits experimental data much better than AIS model does.
Introduction
Sodium (23Na) plays a crucial role in cellular physiology. The distribution of intracellular sodium concentrations (ISC) and extracellular sodium concentrations (ESC) depend on cellular metabolism and cell membrane integrity. Quantitative measurements of ISC and ESC can provide critical information about energy metabolism and cell membrane integrity and have potential clinical applications in cancer diagnosis and cancer treatments.Methods
Data collection: Images were collected using a 1H/23Na dual tuned head coil (Rapid Biomedical, Germany) on a 7T human scanner (GE MR950, USA) from ten subjects. Data were acquired using a fast 3D multi-echo ultrashort TE radial free induction decay sequence with TR = 50ms, the minimum TE = 455µs, 8 echoes with a 2.176ms echo spacing, tip = 150, 200mm isotropic field-of-view, 7333 X 33 matrix, and total acquisition time of 6.07 minutes. The k-space data was re-gridded to a 48 x 48 x 48 isotropic matrix. Image reconstructions were performed off-line using Tikhonov based regularization [1, 2]. Two NaCl reference standards (51.3mM and 154.0mM saline solution) were imaged along with the subjects and used for normalization.
Image processing: A bi-exponential decay model was fit to the multi-echo 23Na signal, c(t), for each voxel to estimate sodium concentrations and R2* values for both fast decay component (FDC) and slow decay component (SDC).
$$c(t)=Cfe-R2ft+Cse-R2st $$ 1
where Cf and Cs correspond to FDC and SDC sodium signal, respectively; R2f* and R2s* are transverse relaxation rates of the FDC and SDC. A least square estimation was used for estimating sodium relaxation times and compartmental concentrations. Region of interest measures were obtained for the following tissue types: white matter, gray matter, and cerebral spinal fluid.
Modeling: In our anisotropic and isotropic systems (AIS) model, intra-cellular sodium ions have restricted motions, are characterized by a bi-exponential decay, and contribute to both FDC and SDC; extra-cellular sodium ions have a free motion, are characterized by a mono-exponential decay, and contribute to SDC only. The measured FDC and SDC should be related to ISC and ESC by:
$$Cf=ηαiCi $$ 2
$$Cs=(1-η)αiCi+αeCe $$ 3
Where Ci and Ce are ISC and ESC, respectively; αi and αe are the intra- and extra- cellular sodium volume fractions; η is the contribution of the restricted sodium ions to the fast T2 component.
In our anisotropic-anisotropic systems (AAS) model, macromolecular anions are actually present in both intra- and extra-cellular compartments [3, 4, 5]. Sodium ions in both compartments experience restricted motions and are characterized by bi-exponential T2 decay. The measured FDC and SDC should be related to ISC and ESC by:
$$Cf=η(αiCi+δαeCe) $$ 4
$$Cs=(1-η)(αiCi+δαeCe)+(1-δ)αeCe $$ 5
where δ is the fraction of extra-cellular sodium ions experiencing restricted motion. In our compartmental model, extra-cellular sodium compartment includes the interstitial and vascular spaces. The value of δ should vary according to fraction of spins restricted by macromolecules and range from 0 to 1.
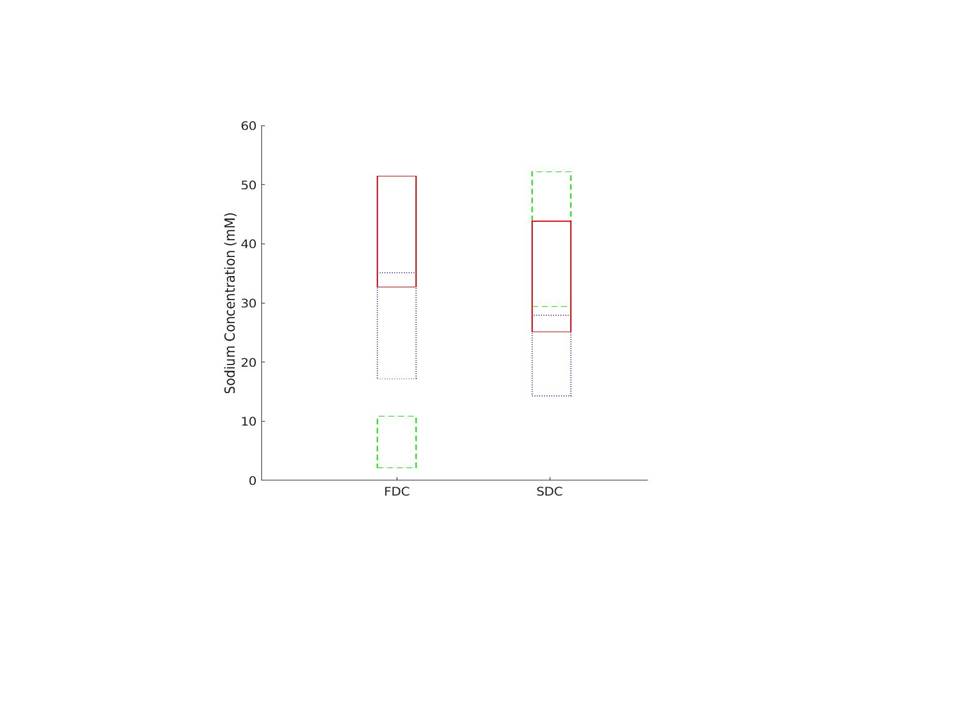
Both AIS and AAS models were evaluated based on theoretical and experimental results. First, ranges of the theoretical sodium concentrations of FDC and SDC were computed based on AIS and AAS models as well as theoretical values of ISC and ESC. The theoretical ranges were then compared to the measured Cf and Cs. Chi-square goodness of fit was performed to test which model fits our results better. Second, theoretical T2* decay curves were computed based on AIS and AAS model. The theoretical T2* decay curves were compared to experimental T2* decay curves to evaluate which model fits the curves better.
Results
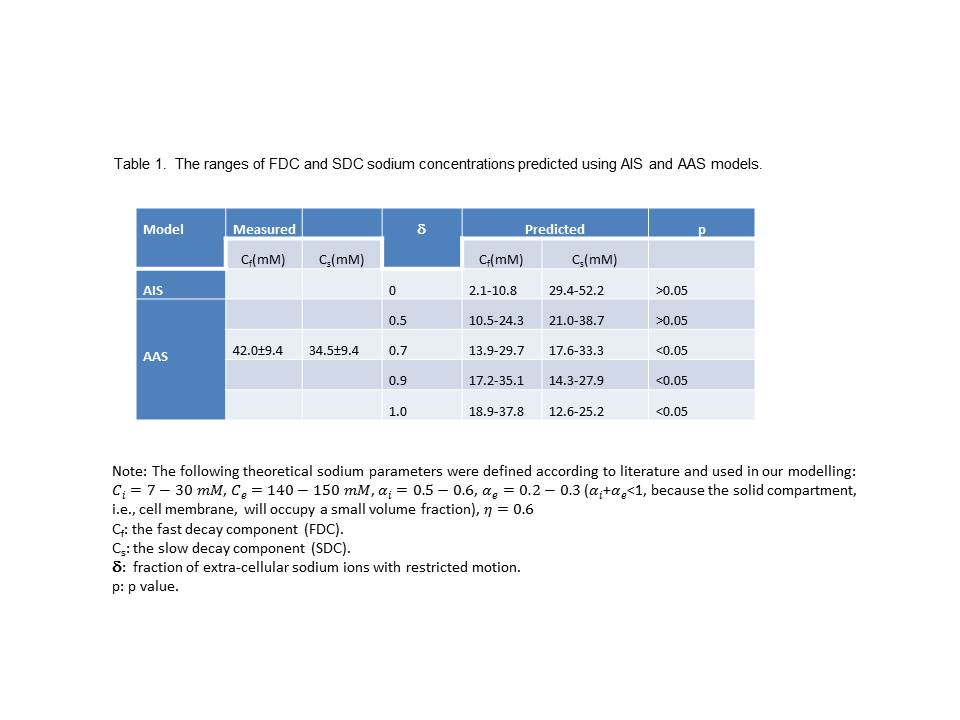
Table 1 summarizes the modeling results of AIS and AAS models, as well as experimental results. AIS predicts very low 23Na concentrations of FDC. AAS predicts higher FDC and lower SDC when compared to AIS. The predicted FDC and SDC 23Na concentrations by AAS partially overlap with the measured concentrations, as depicted in Figure 1. Based on our Chi-square goodness of fit test, the AAS model fit our experimental data better than the AIS model when d≥0.7.
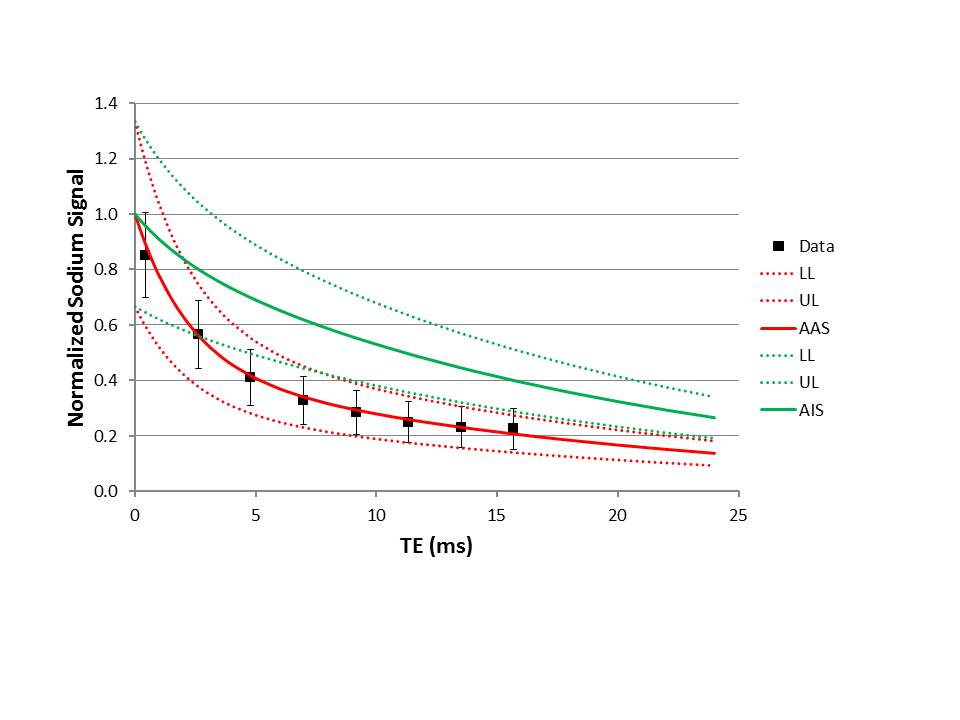
Theoretical T2* decay curves were computed based on Equation 1 and the predicted sodium concentrations by AIS and AAS. As shown in Figure 2, theoretical T2* decay curve of AAS fits our experimental data much better than AIS does.
Discussion and Conclusions
Based on multi-echo 3D radial acquisitions, the total acquisition time of our method is reasonably short (about 6 minutes). The estimated sodium concentrations and R2* relaxation rates are reasonable for gray matter and white matter. Our results indicate the AAS model is superior to the AIS model in explaining the multi-compartment 23Na relaxation measurements.Acknowledgements
No acknowledgement found.References
[1] A. Tikhonov and A. VI, Solutions of ill-posed problems, Washington/New York: Winston, distributed by Halsted Press, 1977.
[2] L. Ying, D. Xu and Z. Liang, "On tikhonov regularization for image reconstruction in parallel mri," Conf Proc IEEE Eng Med Biol Soc, pp. 2:1056-9, 2004.
[3] P. M. Winter and N. Bansal, "TmDOTP5– as a 23Na Shift Reagent for the Subcutaneously Implanted 9L Gliosarcoma in Rats," Magnetic Resonance in Medicine, p. 45:436–442, 2001.
[4] H. Naritomi, M. Kanashiro, M. Sasaki, Y. Kuribayashi and T. Sawada, "In vivo measurements of intra- and extracellular Na+ and water in the brain and muscle by nuclear magnetic resonance spectroscopy with shift reagent," Biophys. J, p. 52 (4):611–616, 1987.
[5] G. Navon, "Complete elimination of the extracellular Na-23 Nmr signal in triple quantum filtered spectra of rat hearts in the presence of shift-reagents," Magn. Reson Med, p. 30 (4): 503–506, 1993.
Figures