4464
Assessment and optimisation of bias field correction using N4ITK for PD mapping1UCL, London, United Kingdom, 2KCL, London, United Kingdom
Synopsis
Proton density (PD) maps measure the amount of free water molecules in the tissue and can be used in a range of neurological disorders. We previously developed a new approach for PD mapping based on a multi-contrast acquisition protocol, and a data-driven estimation method for inhomogeneity correction and map scaling. Here we evaluate the robustness of the inhomogeneity correction method and its effect on the PD value estimation using data acquired with different receiver coils. This allowed us to assess the impact of the spatial variability of the receiver coil profile on the PD map.
Introduction
MR proton density (PD) mapping requires the estimation and subsequent removal of factors influencing the signal intensity other than PD. These include the T1, T2* relaxation effects, transmit field inhomogeneities, receiver coil sensitivity profile (RP) and the spatially invariant factor required to scale the data. The RP estimation is usually based on image post-processing techniques due to limitations of its measurement at magnetic fields higher than 1.5T1,2. In this work we used a PD mapping approach previously described3, based on a multi-contrast variable flip angle (VFA) protocol4. After combining and correcting the multi-echo VFA images for relaxation effects, we determined the RP using a non-parametric algorithm based on N4ITK5, which can be applied to any organ or pathological data. Here we aimed at assessing the impact on the PD values of different radio-frequency receive coils with differing spatial variability. To this end we tested the PD values reproducibility provided by N4ITK when different coils were employed for acquiring the data. Finally, we assessed the stability of the PD maps estimated with RP correction obtained using different numbers of N4ITK iterations by quantifying the root mean square (RMS) of PD value changes with successive iterations.Method
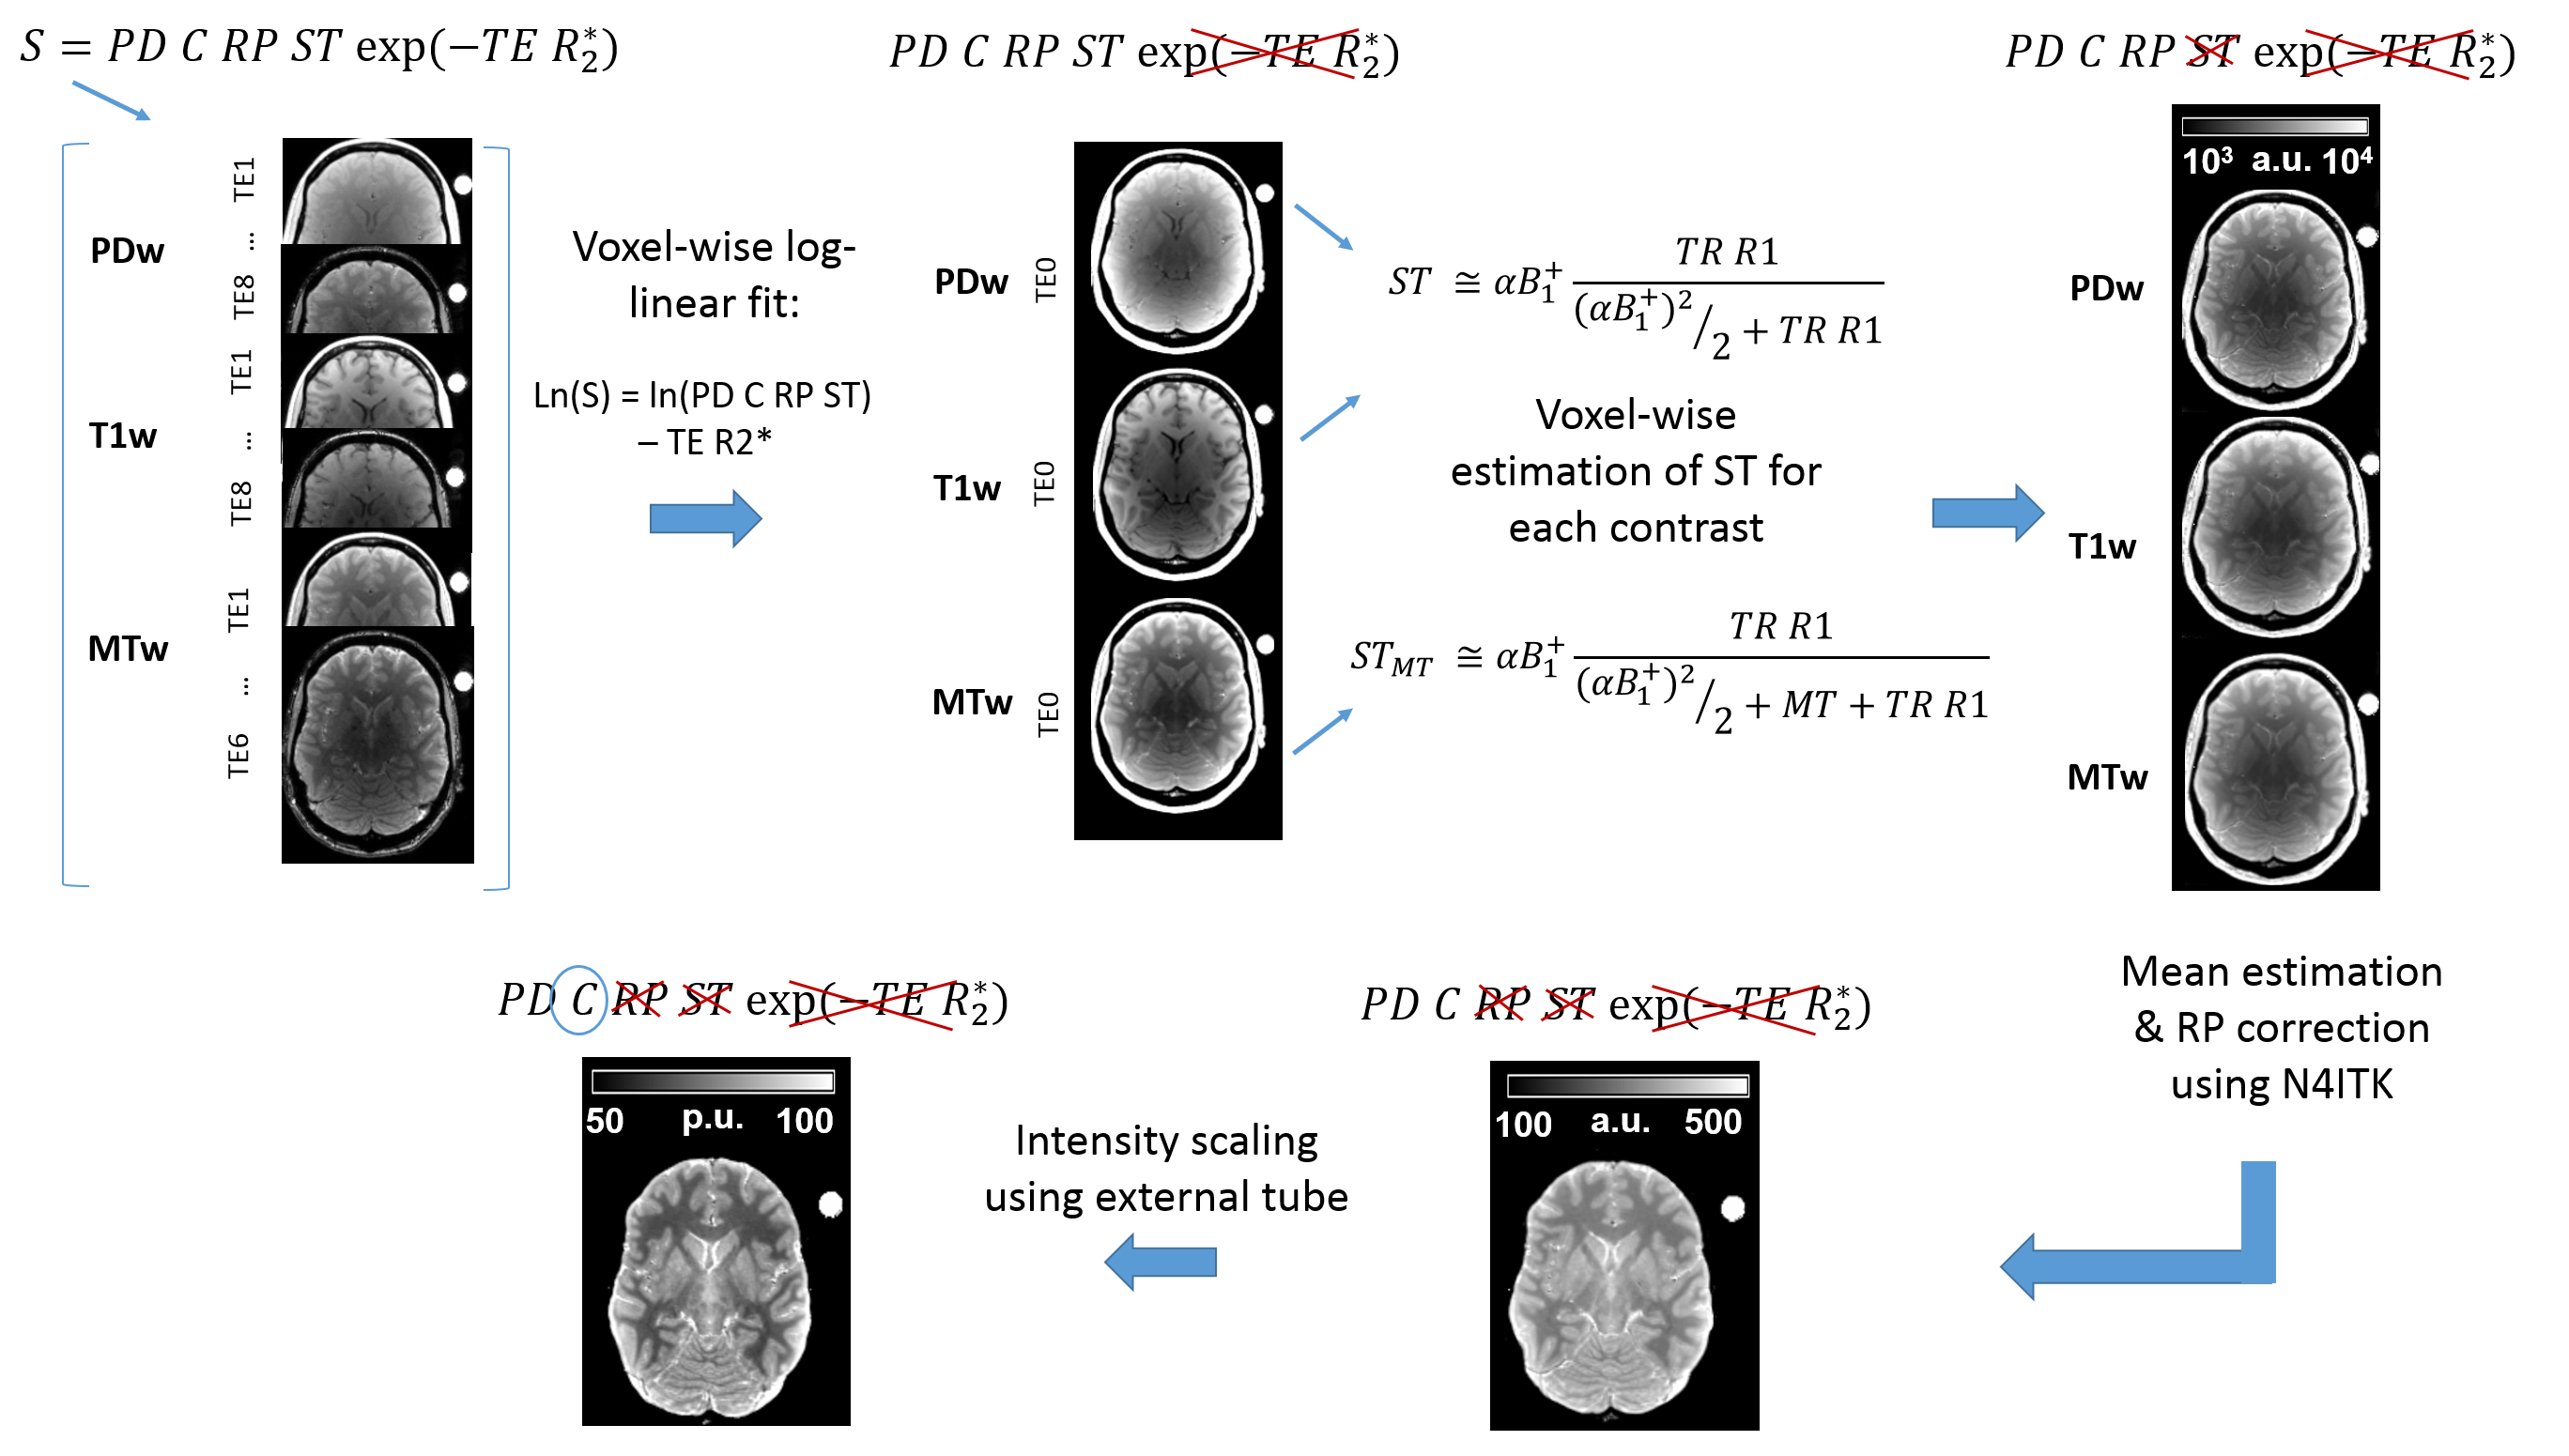
3 healthy subjects (29 ± 1.7years) were scanned twice on a 3T Siemens Prisma using a 64 and 20 channel head receiver coil, respectively. A plastic tube filled with Gadolinium solution (0.09mg/ml) was placed next to the subjects head for calibration purposes6. Three 3D multi-echo FLASH datasets with predominant PD-,T1- and MT-weighting (PDw,T1w,MTw) were acquired (1mm3 resolution), and B1+ maps were used to correct for transmit inhomogeneities4,7.For acquisition details see Lorio et al8. PD maps were estimated using our new multi-contrast approach for each receiver coil. To correct for R2* relaxation, all multi-contrast echo points were combined and a voxel-wise log-linear fit was used to extrapolate the TE=0 signal for PDw,T1w and MTw datasets9. Then each contrast was corrected for steady state (ST) term using previously calculated R1 and MT maps4,10 (see Fig.1). RP was determined from the corrected data applying iteratively N4ITK5, and the final maps were scaled by the median intensity of the plastic tube filled with Gadolinium solution in order to obtain PD values between 0 and 100%. To optimise the RP removal with N4ITK using different receiver coils, we applied a different number (1 to 10) of N4ITK iterations and generate multi-contrast PD maps. We assessed the stability of the RP removal for each coil by estimating voxel-wise the difference between PD maps computed with n and n+1 iterations of N4ITK (where n=1,2,…9) for the RP correction for each subject. Secondly, we calculated the RMS value within voxels belonging to the brain mask for each difference map. Finally, we quantified voxel-wise PD value changes across the two receiver coils for each number of N4ITK iterations and we estimated the RMS map within voxels belonging to the brain.Results
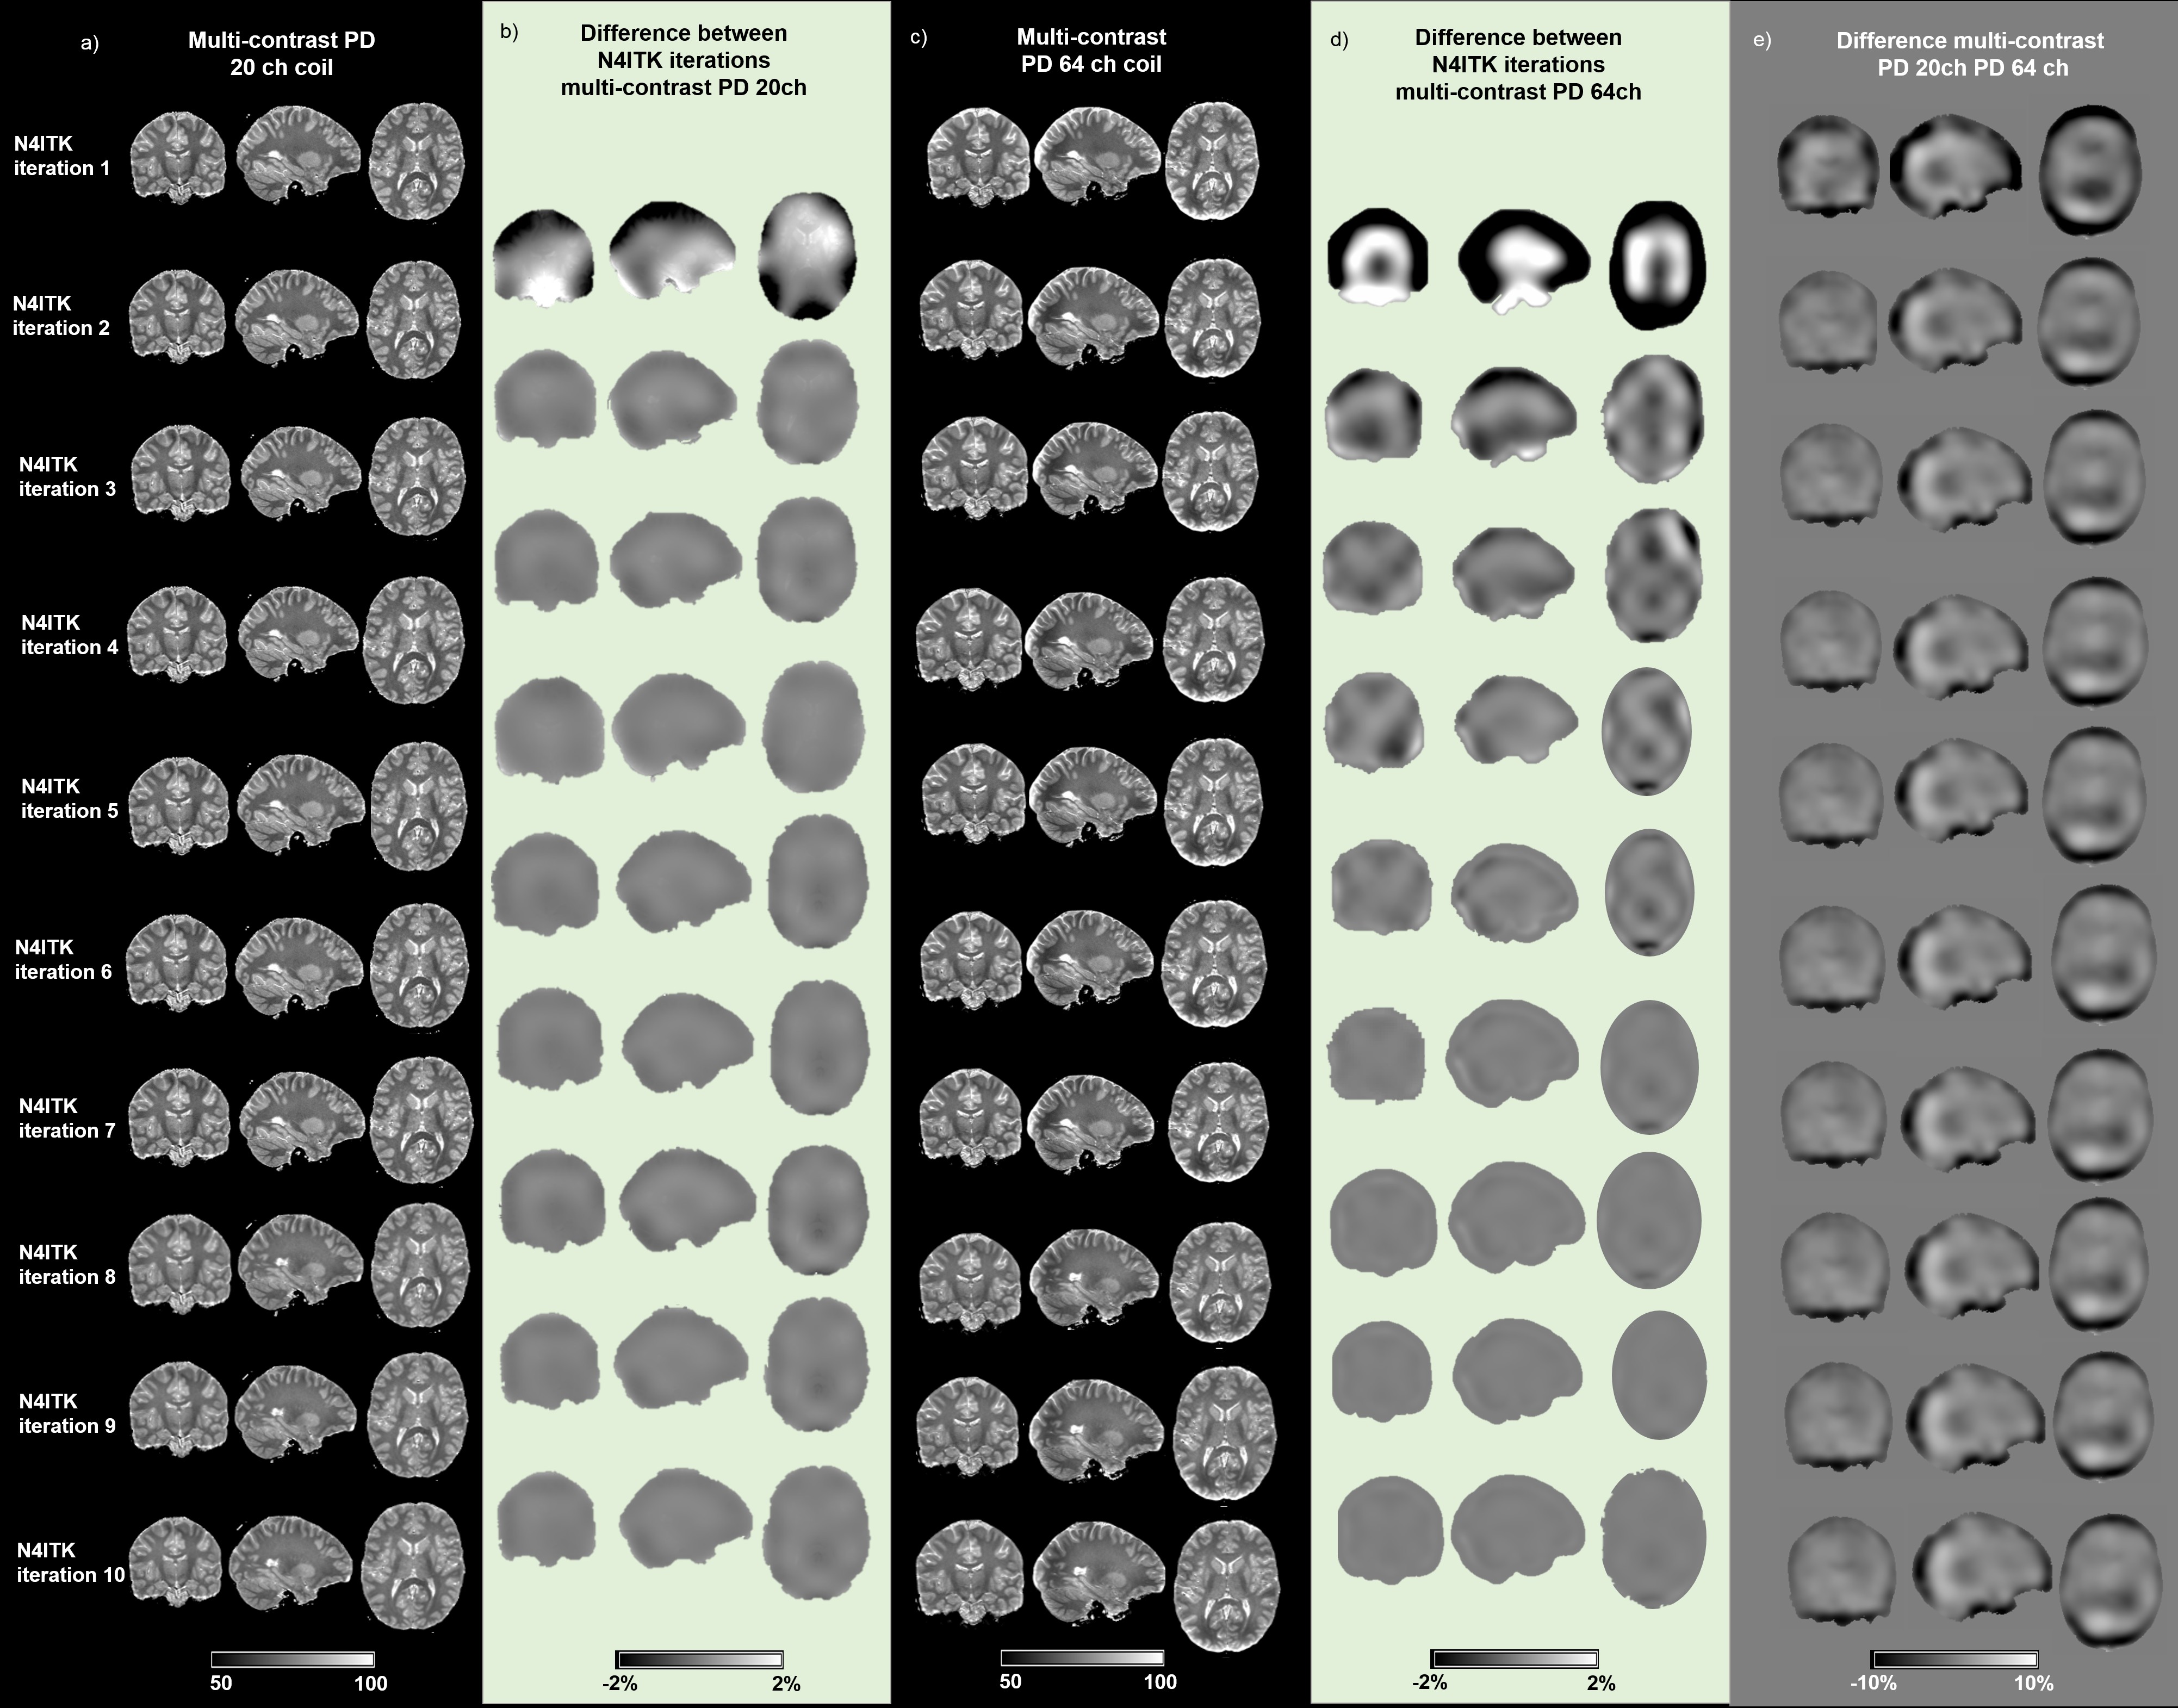
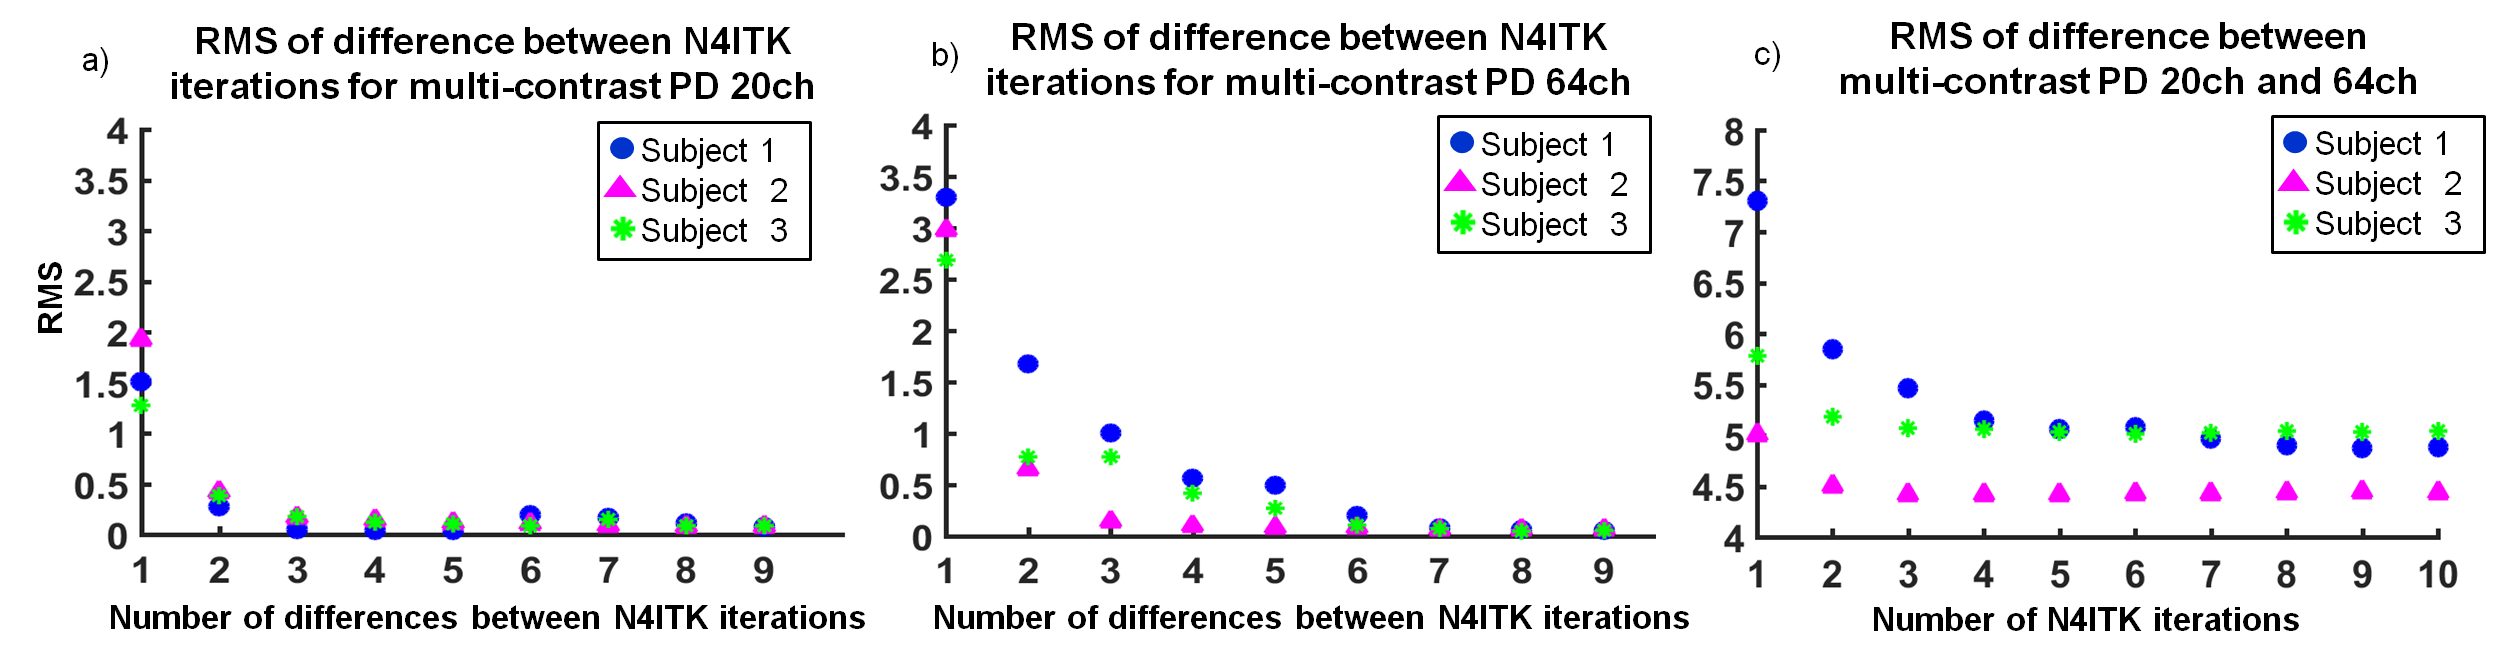
We obtained multi-contrast PD maps for the 20 and 64 channel coil datasets (see Fig. 2a,c) using different number of iterations for the RP removal. We observed that after the eight iteration the PD changes between successive number of iterations were smaller than 2% (see Fig. 2b), and there was minimal RMS variation for the multi-contrast maps estimated with the 20 channel coil data (see Fig. 3a) and with the 64 channel coil data (see Fig. 2d, Fig. 3b). The assessment of the RP removal across different receiver coils showed that the differences between PD maps obtained with the 20 and 64 channel coil were greatest in the occipital and frontal regions (see Fig. 2e). However those regional changes were stable after the forth iteration as measured by the RMS displayed on Figure 3c and by visual inspection of the spatial data in Figure 2e.Discussion
PD map differences estimated within the same coil showed that low density coils required less N4ITK iterations to remove the bulk of RP sensitivity profile with respect to the maps obtained from higher number of channels. This is expected due to the fact that higher density RF coils have more localised sensitivity profiles leading to an RP with increased spatial variation. However the same number of iterations was required for both the 20 and 64 channel multi-contrast PD maps in order to obtain negligible RP changes. Effective RP correction should reduce changes in PD maps estimated with different RF coils. The systematic PD value differences between receiver coils suggest that N4ITK provides a less robust RP correction when a larger number receiver channels or more highly localised coils are used.Acknowledgements
No acknowledgement found.References
1. Neeb H, Ermer V, Stocker T, Shah NJ: Fast quantitative mapping of absolute water content with full brain coverage. NeuroImage 2008; 42:1094–1109.
2. Volz S, Nöth U, Jurcoane A, Ziemann U, Hattingen E, Deichmann R: Quantitative proton density mapping: correcting the receiver sensitivity bias via pseudo proton densities. NeuroImage 2012; 63:540–552.
3. Lorio S, Tierney T, McDowell A, et al.: Robust PD mapping using multi-contrast variable flip angle (VFA) data. In Proc Jt Annu Meet ISMRM-ESMRMB; 2018.
4. Weiskopf N, Suckling J, Williams G, et al.: Quantitative multi-parameter mapping of R1, PD(*), MT, and R2(*) at 3T: a multi-center validation. Front Neurosci 2013; 7:95.
5. Tustison NJ, Avants BB, Cook PA, et al.: N4ITK: improved N3 bias correction. IEEE Trans Med Imaging 2010; 29:1310–1320.
6. Sasaki M, Shibata E, Kanbara Y, Ehara S: Enhancement effects and relaxivities of gadolinium-DTPA at 1.5 versus 3 Tesla: a phantom study. Magn Reson Med Sci MRMS Off J Jpn Soc Magn Reson Med 2005; 4:145–149.
7. Lutti A, Stadler J, Josephs O, et al.: Robust and fast whole brain mapping of the RF transmit field B1 at 7T. PloS One 2012; 7:e32379.
8. Lorio S, Kherif F, Ruef A, et al.: Neurobiological origin of spurious brain morphological changes: A quantitative MRI study. Hum Brain Mapp 2016; 37:1801–1815.
9. Weiskopf N, Callaghan MF, Josephs O, Lutti A, Mohammadi S: Estimating the apparent transverse relaxation time (R2*) from images with different contrasts (ESTATICS) reduces motion artifacts. Front Neurosci 2014; 8.
10. Preibisch C, Deichmann R: Influence of RF spoiling on the stability and accuracy of T1 mapping based on spoiled FLASH with varying flip angles. Magn Reson Med Off J Soc Magn Reson Med Soc Magn Reson Med 2009; 61:125–135.
Figures