4462
Robust quantitative T1rho imaging in the presence of B1 RF and B0 field inhomogeneities1Department of Imaging and Interventional Radiology, The Chinese University of Hong Kong, Hong Kong, Hong Kong, 2Philips Healthcare, Hong Kong, China
Synopsis
T1rho is a valuable biomarker to probe macromolecular environment of tissue. However, T1rho imaging suffers from B1 RF and B0 field inhomogeneities. In this work, we present an approach to address this problem. The performance of our proposed method was demonstrated by simulations, phantom and in vivo experiments.
Purpose
T1rho is a valuable biomarker to probe macromolecular environment of tissue. However, T1rho imaging suffers from B1 RF and B0 field inhomogeneities. Recently, methods using adiabatic RF pulses are reported for simultaneous compensation of B1 RF and B0 field inhomogeneities during continuous-wave constant-amplitude spin-lock1,2 . We term these methods Adiabatic Continuous-wave Constant amplitude Spin-Lock (ACCSL). When using ACCSL, spins are locked along the effective spin-lock field with an angle deviated from the transverse plane, which can result in contamination to the measured T1rho value when this angle is significant1. In this work, we present an approach to correct this effect. The performance of our proposed method was demonstrated by simulations, phantom and in vivo experiments.Method
When performing ACCSL, the maximum amplitude of the adiabatic pulse is set to the frequency of spin-lock (FSL). Consequently, the spins are effectively locked by the effective spin-lock field at the orientation θ stated in the previous work1. Here θ is determined by B0 inhomogeneity and the actual FSL. According to Trott and Palmer3, $$$R_{1\rho}(1/T_{1\rho})$$$ can be represented as follow: $$R_{1\rho}=R_{1}\cdot cos^{2}(\theta)+R_{1\rho}^{0}\cdot sin^{2}(\theta), [1]$$ Based on Eq [1], we have:$$T_{1\rho}^{0} =sin^{2}\theta / (1/T_{1\rho}-cos^{2}\theta/T_{1}), [2]$$ Here $$$T_{1\rho}^{0}$$$ is the $$$T_{1\rho}$$$ value when the spins are locked in the transverse plane, which has no contamination from field inhomogeneities. The θ can be calibrated with acquisition of B1 and B0 map. It has been shown that $$$R_{1\rho}$$$ is insensitive to changes in $$$R_{1}(1/T_{1})$$$1. Therefore, we can choose a prior T1 for the correction.
We simulated magnetization movement during the entire spin-lock process, including AHP, spin-lock, and reverse AHP using Bloch equations. T1rho values at a range of B1 and B0 field inhomogeneities are obtained by fitting the simulated data at different TSLs (0, 10, 20, 30, 40, 50, 60, 70) with model reported in2. Phantom and in vivo data sets were acquired using a Philips Achieva 3.0T scanner. An eight-channel head coil was used as the receiver. Four bottles of 2%, 3%, 4% and 5% agarose were used. A single transverse slice was scanned with the imaging parameters: field of view (FOV) 250mm×220mm, slice thickness 5mm, resolution1.5mm ×1.5mm, TE/TR 15.1ms/2200.0ms, 8 TSLs for 0, 10, 20, 30, 40, 50, 60, 70ms, spin-lock frequency 500, 400, 300, 200, 150Hz. Volunteer scan was performed under the approval of the institutional review board. An eight-channel T/R knee coil (Invivo, Gaineville, FL, USA) was used for right knee scan. Imaging parameters include FOV 160mm ×160mm, slice thickness 5mm, resolution1 mm ×1mm, 5 TSLs 0, 10, 30, 50, 75ms, spin-lock frequency 500, 400, 300, 200, 150Hz. T1rho maps under adiabatic and conventional spin-lock were acquired for both phantom and in vivo scan. The B1 and B0 maps were also acquired.
Results and Discussion
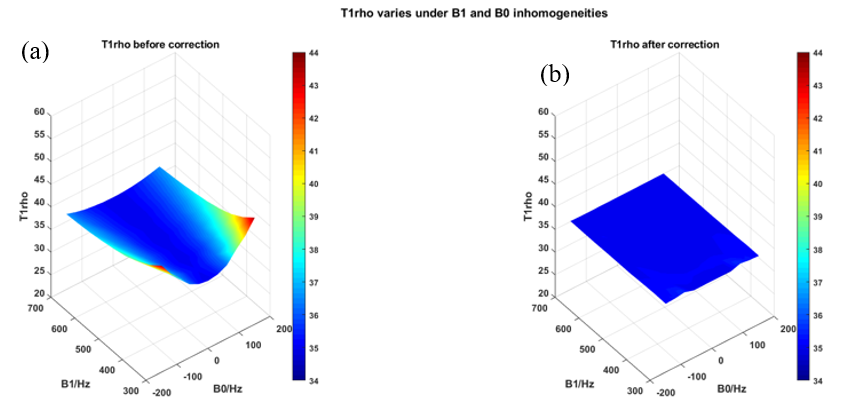
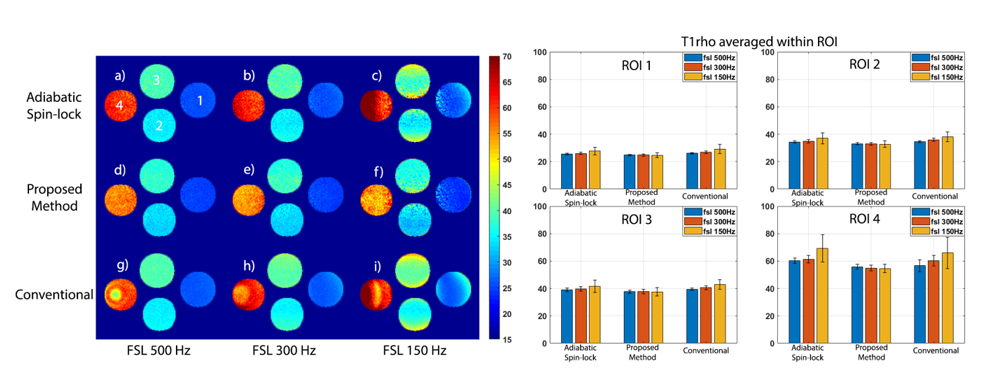
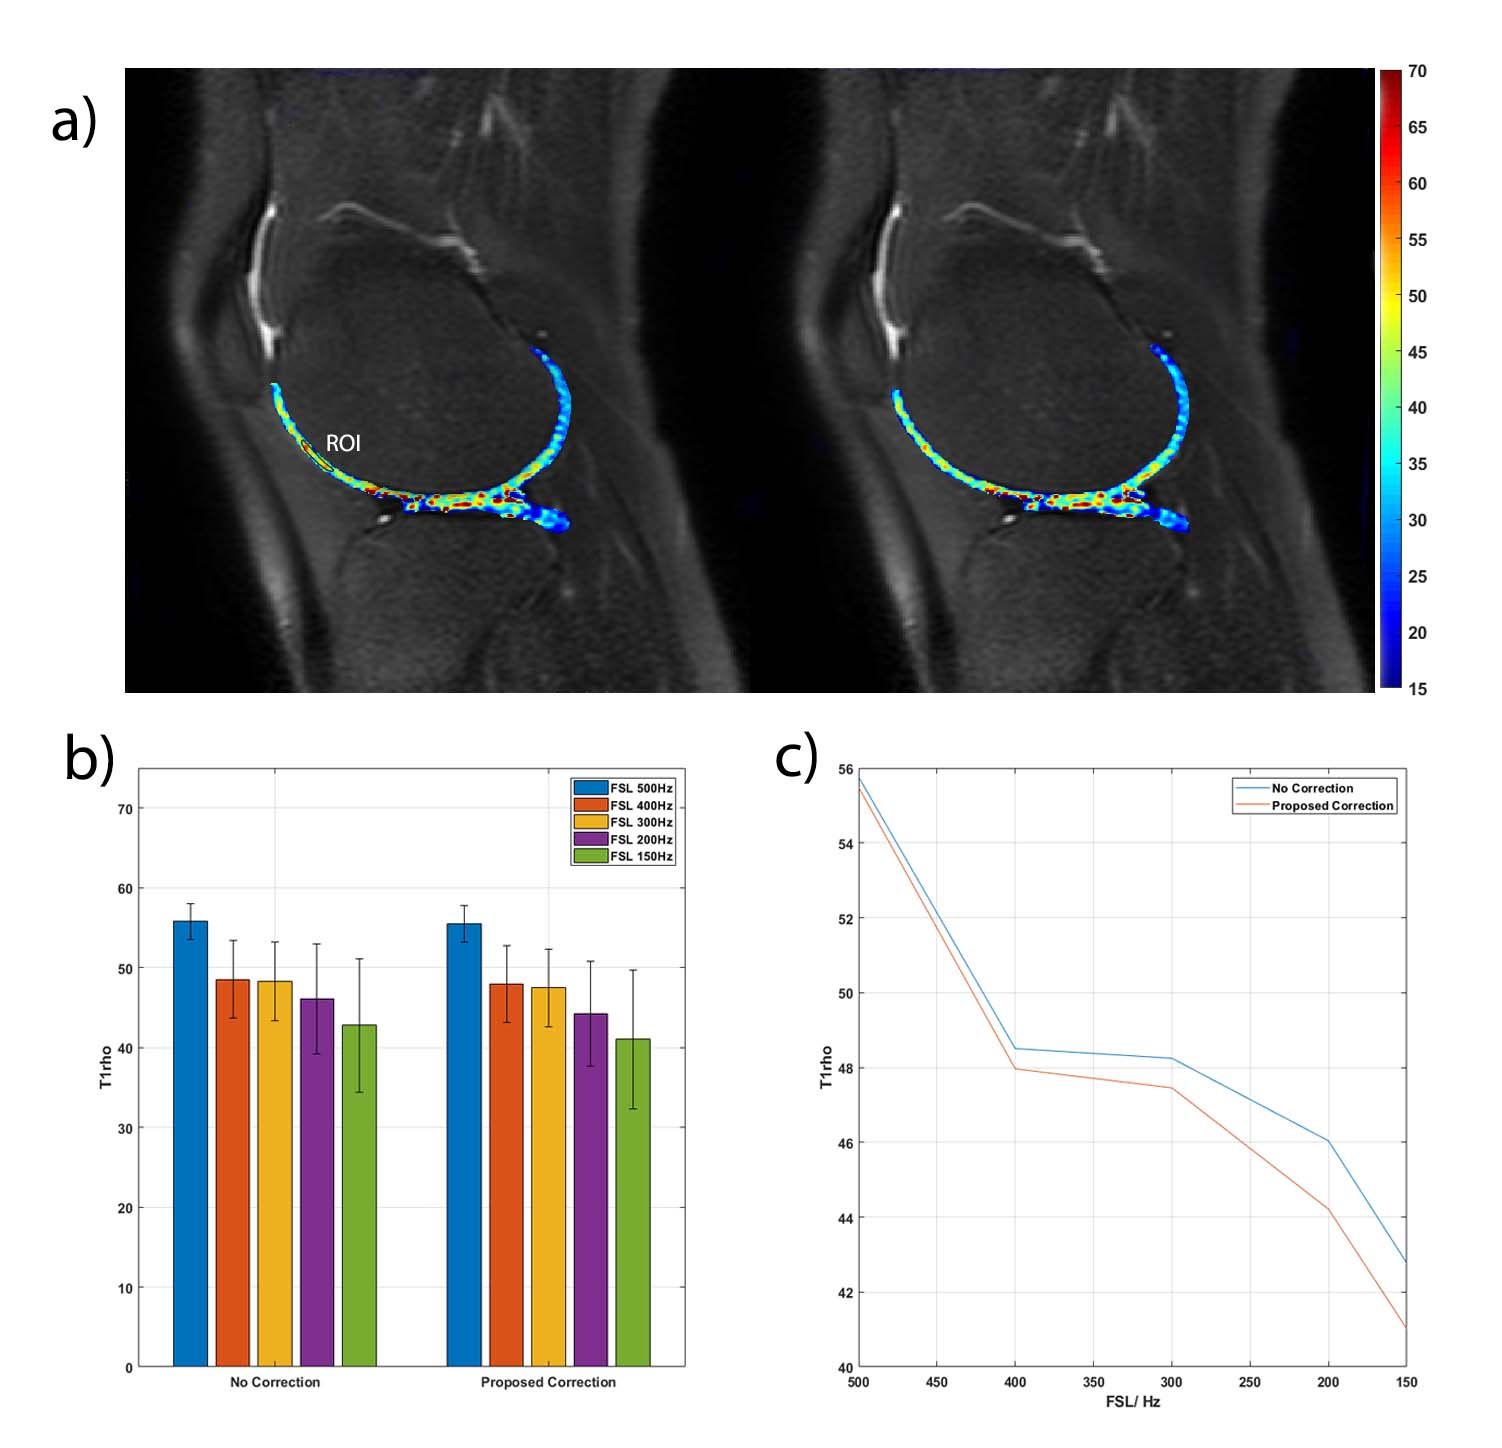
Figure 1 shows the simulated T1rho maps before and after correction. Note the proposed method provides efficient correction to the T1rho map. Figure 2 compares the corrected T1rho maps of the phantom at different FSLs to the maps with no correction and the maps acquired with conventional spin-lock. The corrected T1rhos within ROIs have improved uniformity. The phantom does not contain metabolites which can result in chemical exchange. Therefore, there is no T1rho dispersion effect on this phantom, which is consistent with the results after the correction. Figure 3 shows results from in vivo experiment. Improved T1rho dispersion is observed in vivo after the proposed correction method.
Conclusion
We reported a method to improve the robustness of T1rho quantification in presence of B1 RF and B0 field inhomogeneities. The in vivo results show a potential application of the proposed method to explore the T1rho dispersion.Acknowledgements
This study is supported by a grant from the Innovation and Technology Commission of the government of Hong Kong SAR (Project ITS/469/16) and a grant from the Research Grants Council of the Hong Kong SAR (Project SEG CUHK02).References
- Chen, W. (2017). Artifacts correction for T1rho imaging with constant amplitude spin-lock. Journal of Magnetic Resonance, 274, 13-23.
- Jiang, B., & Chen, W. (2018). On‐resonance and off‐resonance continuous wave constant amplitude spin‐lock and T1ρ quantification in the presence of B1 and B0 inhomogeneities. NMR in Biomedicine, e3928.
- Trott, O., & Palmer III, A. G. (2002). R1ρ relaxation outside of the fast-exchange limit. Journal of Magnetic Resonance
Figures