4455
Knee T2 relaxometry using quantitative DESS: reproducibility across imaging vendors1Philips Healthcare North America, Gainesville, FL, United States, 2Radiology, Stanford University, Stanford, CA, United States, 3Electrical Engineering, Stanford University, Stanford, CA, United States, 4Bioengineering, Stanford University, Stanford, CA, United States
Synopsis
T2 is a promising MR-based biomarkers for early diagnosis of osteoarthritis (OA). Studies have shown that quantitative DESS (qDESS) is capable of performing simultaneous knee morphometry and T2 relaxometry. In this study, we investigate the cross-vendor reproducibility of knee T2 relaxometry using qDESS. By comparing measured cartilage and meniscus T2 values in volunteers scanned on both Philips 3T and GE 3T scanners, we show that qDESS has good intra-vendor scan-rescan repeatability (CCC = 99.2% and 98.8% ) and cross-vendor reproducibility (CCC=96.3%). With continued effort, we hope to show that qDESS T2 relaxometry can serve as a reliable clinical biomarker for early OA diagnosis.
INTRODUCTION
Osteoarthritis (OA) affects millions of adults worldwide and is the leading cause for disability in older population. Early detection of the onset of the disease is key to OA management and prognosis. Many studies have shown that MRI is sensitive to changes in both cartilage morphometry and collagen matrix, and may facilitate development of non-invasive biomarkers for OA. One of the most promising and frequently investigated biomarkers is cartilage T2 which can be measured using quantitative double-echo in steady-state (qDESS) sequence1 where separate echo signals are recorded as was proposed decades ago 2,3,4 and revisited more recently5. qDESS has the advantage of acquiring 3D high-resolution images of the knee and simultaneous performing quantitative morphometry and T2 relaxometry. While qDESS has been explored in a research setting for T2 relaxometry on different imaging systems6,7, it will benefit from evaluation and standardization in cross-vendor studies. In this pilot study, we aim to investigate cross-vendor reproducibility of knee T2 relaxometry using qDESS. We start with comparison between GE and Philips 3T MRI with planned extension to include Siemens 3T.
METHODS
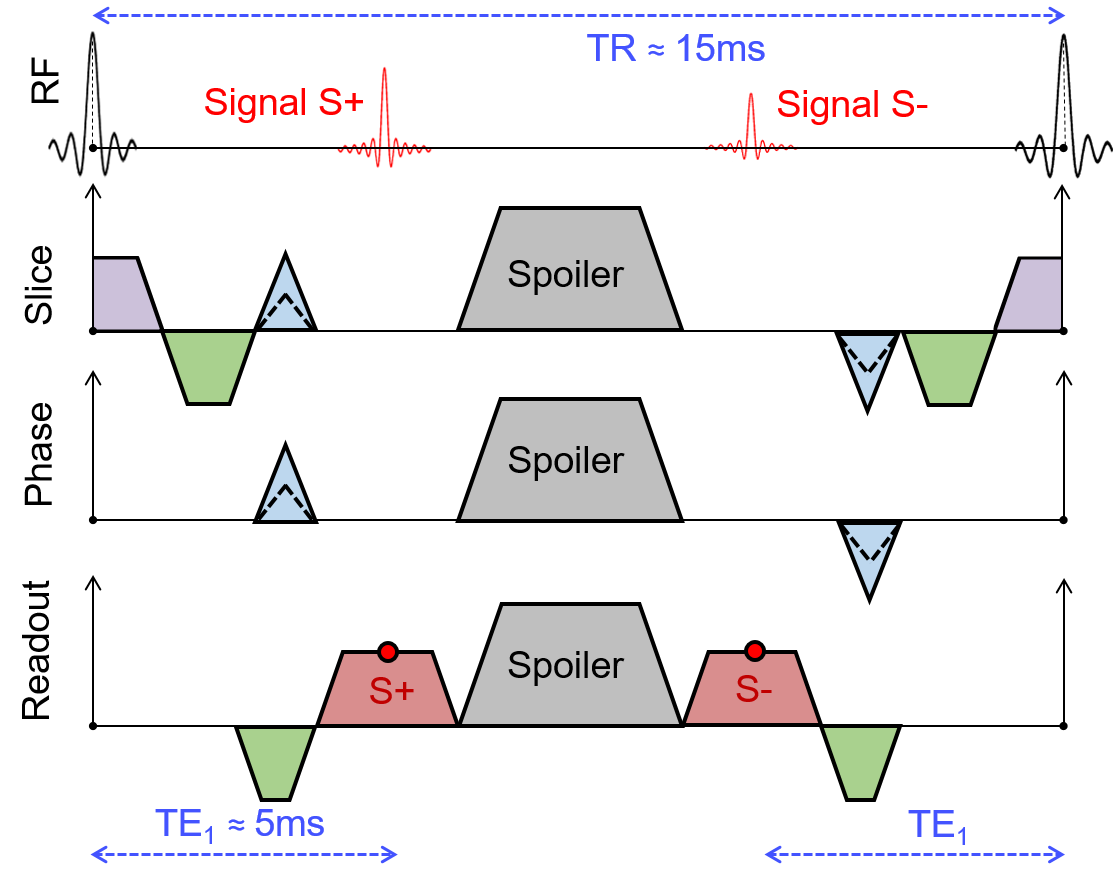
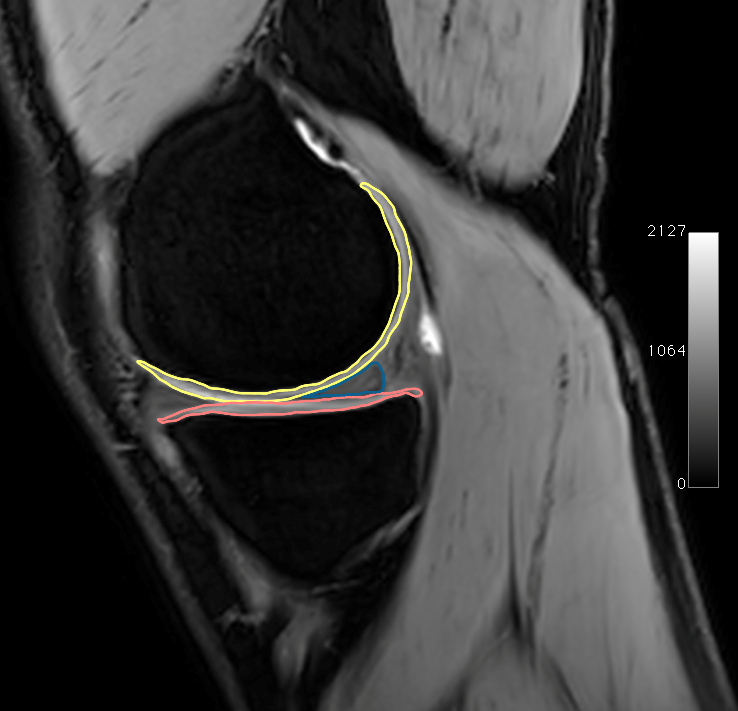
A qDESS sequence was implemented with water-only excitation RF waveforms on both GE and Philips scanners as shown in Figure 1. Small spoiler gradients were added on all three axis between the two qDESS echoes. The spoiler time was 1.0 ms, and gradient area was 15.7 mT*ms/m to produce two cycles of phase dispersion across the slice thickness. Efforts were made to match all sequence parameters between the two vendor systems as much as possible. The following common parameters were used: FOV 16cm, matrix 256x256, slice thickness 3mm, no SENSE , flip angle = 20o, BW = 31kHz. The resulting TR and TE were 16.4ms and 5.1ms for Philips, and 15.6ms and 5.2ms for GE. A 16ch T/R knee coil was used on Philips, and 18ch T/R knee coil was used on GE. T2 quantification was performed by inverting the qDESS signal model8. Two healthy volunteers were scanned on a GE Signa Premier 3T and a Philips Ingenia 3T scanner. Both knees were scanned with each knee imaged twice to assess intra and inter-vendor repeatability for a total of 4 knees analyzed across both scanners. Cartilage and meniscus were manually segmented from the first echo qDESS images by an experienced OA researcher with 5 years of experience. The T2 relaxation times in the medial femoral and tibial cartilage and the posterior horn of the medial meniscus were calculated in the most medial slice in the medial femoral condyle (Figure 2). The reported T2 values were averages of all pixel T2 values in the entire segmented region of interest (ROI). RMSE coefficients of variation (%CV) were used to assess the extent of variability in the measurements for both intra-and inter-vendor comparisons. Concordance correlation coefficients (CCC) and their confidence intervals (CI) were calculated to assess agreement and repeatability. Statistical significance of the comparisons was assessed by Wilcoxon rank sum test (alpha=0.05).RESULTS
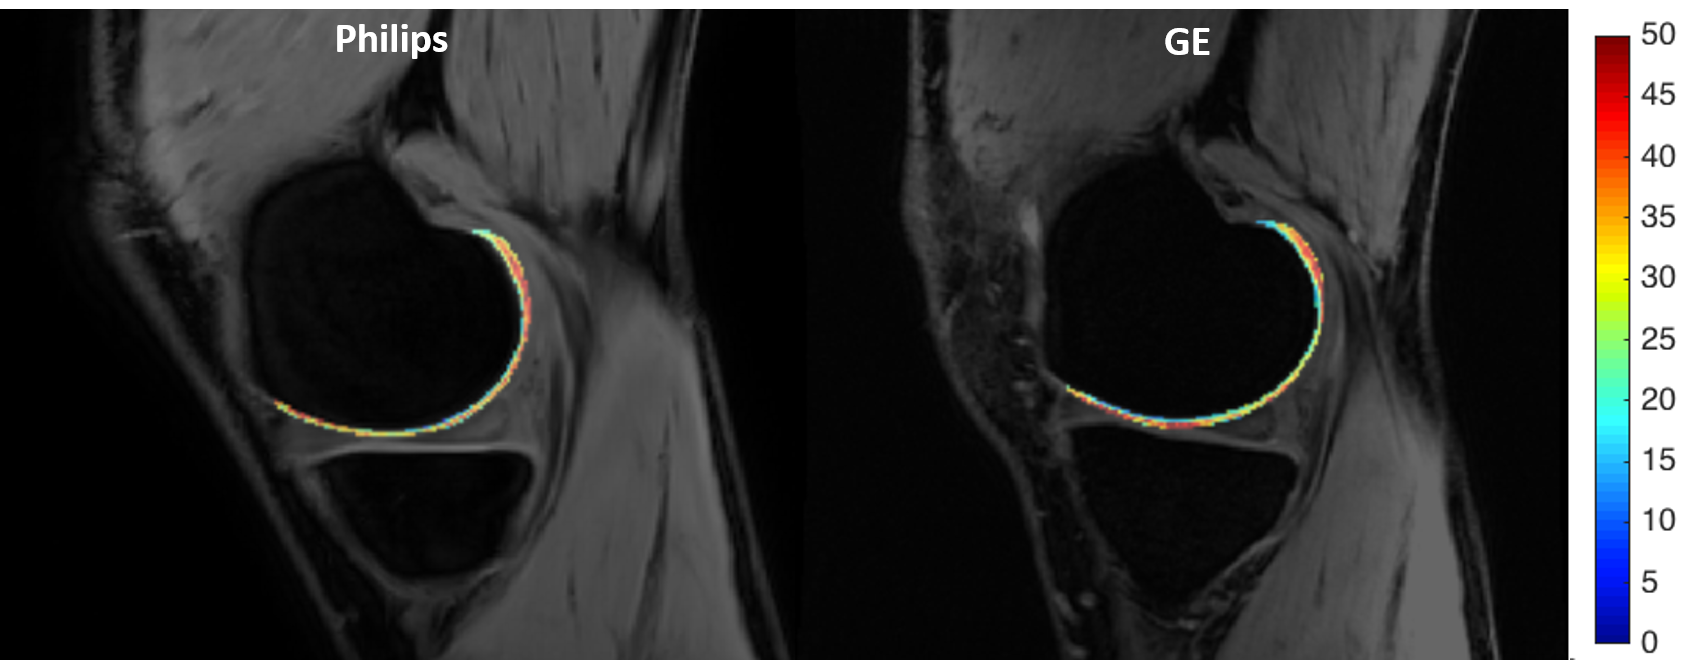
Figure 3 shows sample images of femoral cartilage T2 maps of one knee overlaid on the first echo images of qDESS from the two vendor systems. Table 1 lists the mean and standard deviation of T2 values in femoral cartilage, tibial cartilage and meniscus measured by qDESS. Comparison between GE and Philips (Table 2) indicates good cross-vendor reproducibility (%CV= 5.05 and CCC = 96.3%), and no statistically significant differences (p=0.10) between the vendors. The scan-rescan repeatability within each vendor system was also excellent (Table 2, CCC = 99.2% and 98.8% for Philips and GE, respectively).DISCUSSION
We have shown good cross-vendor reproducibility and intra-vendor scan-rescan repeatability of T2 relaxometry of human knees using qDESS, even in short T2 species such as meniscus. In our experimental setup, we brought scanner table out between scan and rescan but did not reposition the subject and coil. This may have led to the lower observed scan-rescan variability within vendor (%CV = 2.2 and 2.5) compared to the cross-vendor variability (%CV =5.1). Additionally, inherent B0 and B1 differences between the two imaging systems could have also contributed to the cross-vendor variability. A larger sample size will improve the accuracy of our current findings. The manual cartilage segmentation, especially in areas adjoining fluid, likely introduced additional variabilities, where incorporating deep-learning based automated knee segmentation tools may help.CONCLUSION
Our preliminary results showed good agreement in T2 measurement using qDESS between Philips and GE 3T scanners. With additional data, we hope to show that qDESS T2 relaxometry can serve as a reliable clinical biomarker for early OA diagnosis.Acknowledgements
This study was supported by Philips Healthcare and NIH R01 AR0063643.References
1. Chaudhari AS, Black MS, Eijgenraam S, Wirth W, Maschek S, Sveinsson B, Eckstein F, Oei EHG, Gold GE, Hargreaves BA. Five-minute knee MRI for simultaneous morphometry and T2 relaxometry of cartilage and meniscus and for semiquantitative radiological assessment using double-echo in steady-state at 3T.J Magn Reson Imaging. 2018 May;47(5):1328-1341. doi: 10.1002/jmri.25883. Epub 2017 Nov 1.
2. H. Bruder, H. Fischer, R. Graumann, and M. Deimling. A new steady-state imaging sequence for simultaneous acquisition of two MR images with clearly different contrasts. Magnetic resonance in medicine, 7(1):35–42, 1988.
3. S. Y. Lee and Z. H. Cho. Fast SSFP gradient echo sequence for simultaneous acquisitions of FID and echo signals. Magn Reson Med, 8(2):142–150, 1988.
4. T. W. Redpath and R. A. Jones. FADE - a new fast imaging sequence. Magn Reson Med, 6(2):224–234, 1988.
5. Welsch GH, Scheffler K, Mamisch TC, Hughes T, Millington S, Deimling M, et al. Rapid estimation of cartilage T2 based on double echo at steady state (DESS) with 3 Tesla. Magn Reson Med 2009;62:544–9.
6. Matzat, S. J., McWalter, E. J., Kogan, F. , Chen, W. and Gold, G. E. (2015), T2 Relaxation time quantitation differs between pulse sequences in articular cartilage. J. Magn. Reson. Imaging, 42: 105-113. doi:10.1002/jmri.24757
7. Abraham, C. L., Bangerter, N. K., McGavin, L. S., Peters, C. L., Drew, A. J., Hanrahan, C. J. and Anderson, A. E. (2015), Accuracy of 3D dual echo steady state (DESS) MR arthrography to quantify acetabular cartilage thickness. J. Magn. Reson. Imaging, 42: 1329-1338. doi:10.1002/jmri.24902
8. Sveinsson B, Chaudhari AS, Gold GE, Hargreaves BA. A simple analytic method for estimating T2 in the knee from DESS. Magn Reson Imaging. 2016;38:63-70.
Figures