4454
The traveling heads 2.0: Reproducibility of quantitative imaging methods at 7 Tesla1Erwin L. Hahn Institute for Magnetic Resonance Imaging, University Duisburg-Essen, Essen, Germany, 2High-Field and Hybrid MR Imaging, University Hospital Essen, Essen, Germany, 3Division of Medical Physics in Radiology, German Cancer Research Center (DKFZ), Heidelberg, Germany, 4Institute of Radiology, University Hospital Erlangen, Friedrich-Alexander-Universität Erlangen-Nürnberg (FAU), Erlangen, Germany, 5Department of Neurophysics, Max Planck Institute for Human Cognitive and Brain Sciences, Leipzig, Germany, 6German Center for Neurodegenerative Diseases (DZNE), Bonn, Germany, 7Max Planck Institute for Biological Cybernetics, Tübingen, Germany, 8High Field MR Center, Department for Biomedical Imaging and Image-guided Therapy, Medical University of Vienna, Vienna, Austria, 9Otto-von-Guericke-University Magdeburg, Magdeburg, Germany, 10Leibniz Institute for Neurobiology, Magdeburg, Germany
Synopsis
The “traveling heads” is a study to assess the comparability and reproducibility of multicenter human brain imaging at 7T. In previous experiments, we compared typical UHF sequences for structural brain imaging. In this study, we focus on the reproducibility of quantitative imaging and compare methods for volumetry, relaxometry, QSM and CEST between different sites. In addition, three generations of 7T MR systems are compared, i.e. the older installed base consisting of passively and actively shielded magnets of the first and second generation, respectively, as well as the most recent generation which has been approved as a medical device.
Purpose
In this study we compared the reproducibility of state-of-the-art quantitative imaging methods at 7T measuring the same two subjects, termed the “traveling heads”, at three different sites that exemplarily represent three generations of 7T MR systems.Methods
Two male subjects (40 and 36 yrs.) were imaged at three UHF sites, all operating a 7T whole-body MR system from the same vendor (Siemens Healthcare GmbH, Germany). The systems represent three different generations of 7T with two different software platforms and differences in basic imaging components that might influence image quality. The oldest device is a passively shielded magnet (Agilent, UK) equipped with a 38 mT/m gradient coil (PS site). Site 2 uses an actively shielded Agilent magnet of the second generation with a 70 mT/m gradient coil (AS site). Both sites run the same (discontinued) software platform (VB17). At Site 3 (Terra site) the newest (CE-labeled) generation of an actively shielded, compact magnet and an 80 mT/m gradient coil as well as a different software platform (VE11) are installed. All sites are equipped with a commercially available RF head coil (Nova Medical) with 1 TX and 32 RX channels that was used for the measurements.
The imaging protocol started with a calibration part (Fig. 1) consisting of DREAM(1) B1 mapping (TA: 0:05 min, 5 mm isotropic) for transmitter calibration followed by a GRE B0 field map (TA: 2:03, 3 mm isotropic) to measure the reproducibility of the adjustment routines.
A MP2RAGE (TA: 9:38 min, 0.75 mm isotropic) sequence was used for volumetric measurement, and FSL(2) was used for image processing / registration (Fig. 2) and to compare the gathered data with previous traveling heads experiments(3).
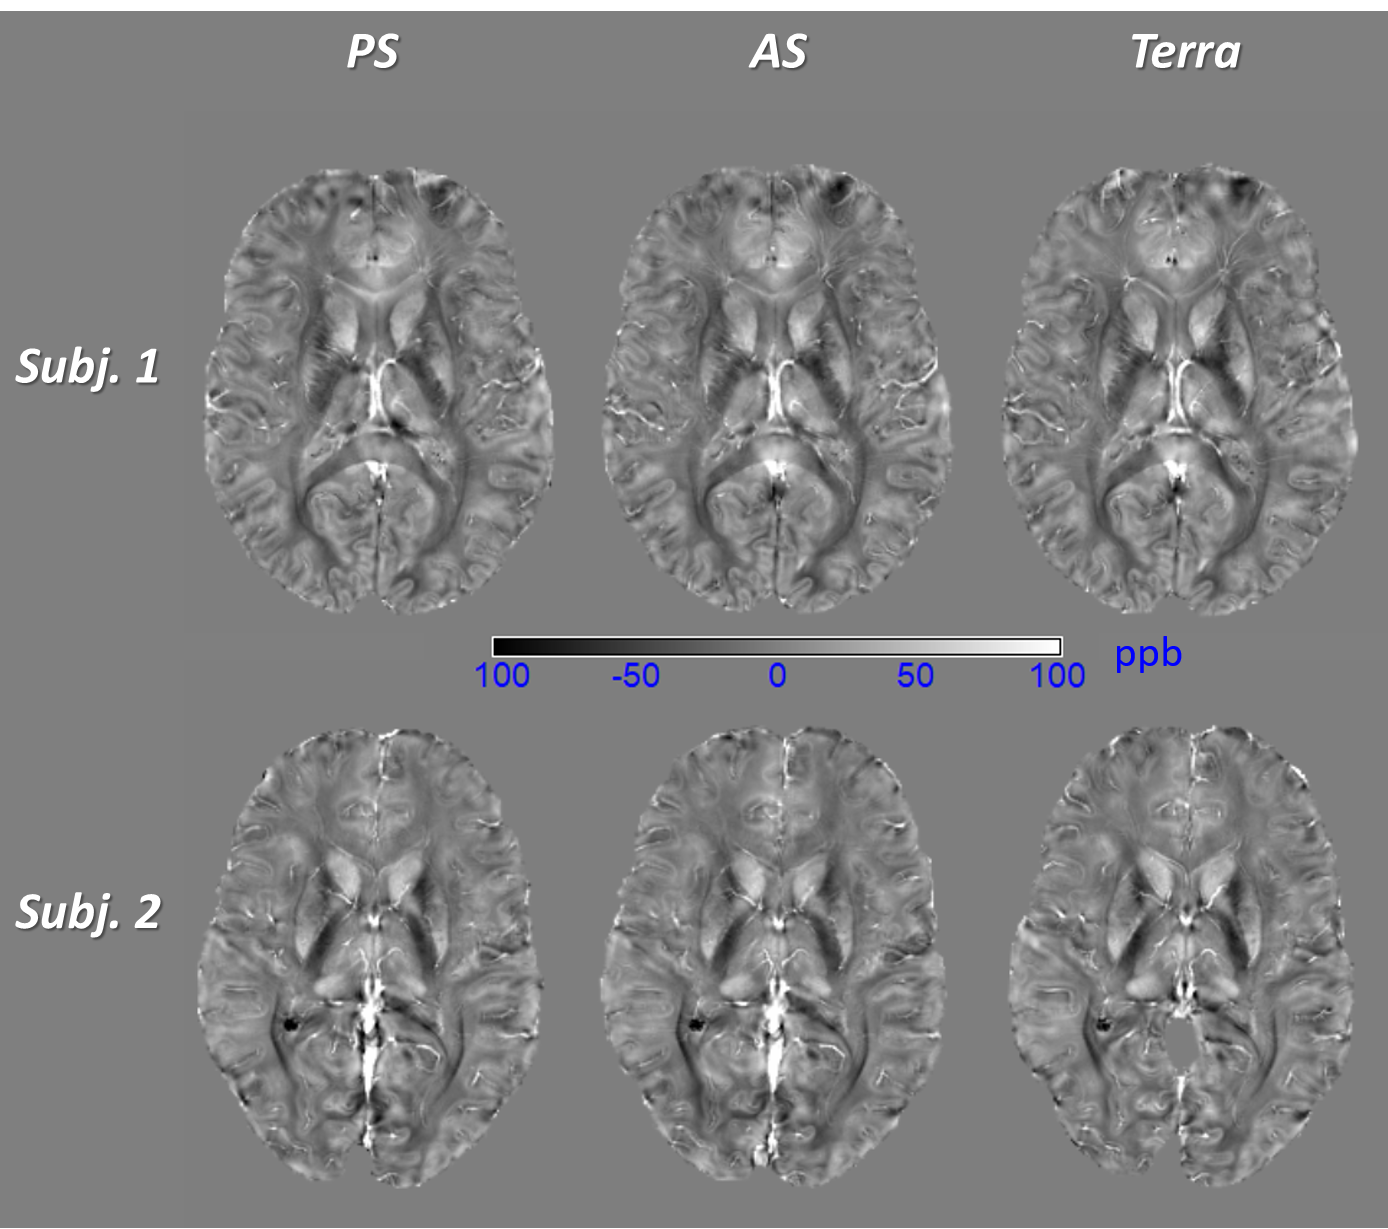
For QSM (Fig. 3) a multi-echo (ME) GRE sequence (TA: 10:11 min, 5 echoes, 0.7 mm isotropic) was acquired that uses ASPIRE(4) for phase combination of the acquisition. The phase maps of each echo time were processed with a Laplacian-based phase unwrapping algorithm(5,6) to remove phase wraps and V-SHARP to eliminate background fields(7). Finally, the susceptibility map was obtained by using STAR-QSM(8). An echo-time-averaged susceptibility map was created by using the squared echo time and the squared signal magnitude as a weight(9).
CEST MRI (Fig. 4) was realized based on a previously optimized acquisition protocol for 7T(10). The protocol comprises a low-power pre-saturation, a 5-pool Lorentzian-fit analysis, and a correction for B0 and B1 inhomogeneities. However, in contrast to the previous protocol, the image readout was extended to three dimensions (1.7×1.7×3 mm3, 18 slices, TA: 16 min) using the snapshot-CEST approach(11) with adapted imaging parameters. In addition, Z-spectra were de-noised using a principal component analysis. The final CEST contrasts (APT and rNOE) were calculated by the inverse metric(12).
Quantitative maps of R1, R2* and PD (Fig. 5) were acquired using a multi-parametric mapping technique(13) further adapted for 7T and for increased isotropic resolution. The protocol consisted of two 3D ME GRE scans with T1 and proton density (PD) weightings (TA: 2x 9:51 min, FA: 21/5°, 6 echoes, 0.65 mm isotropic). Maps were calculated with the hMRI toolbox (http://hmri.info) within the SPM 12 framework.
The total measurement time was 60 min per subject.
Results
The transmitter voltage of the different systems was successfully calibrated with DREAM B1 mapping, resulting in less than ±2° difference in the mean whole-brain flip angle between sites (Fig. 1). MP2RAGE showed very high agreement in contrast, measured T1 values and volumetric measurements (Fig. 2). The quantitative measurements were highly comparable to previous traveling heads measurements. QSM also showed excellent agreement between sites except for inferior brain regions where cavities led to small artifacts in the calculated susceptibility (Fig. 3). The CEST maps showed good agreement between sites; however, quantitative differences occurred, leading to increased rNOE signal at the Terra site and decreased APT signal at the PS site (Fig. 4). The relaxometry maps showed very high agreement between sites, but similar to QSM, small differences in measured T2* values were found between sites (Fig. 5).Discussion and Conclusion
Quantitative MR imaging techniques offer unique possibilities to evaluate normal tissue and assess the severity of and stage diseases. Standardization and harmonization of these imaging methods is highly needed for diagnostic reliability. Individual UHF systems, even from the same vendor, have differences in hardware and software that might potentially influence quantification of image data. In our initial results, this study showed that harmonized state-of-the-art quantitative imaging methods between different generations of 7T MR systems lead to comparable results for inter-site measurements in the same subjects. Further measurements including repeatability are planned at all eleven 7T sites within the German Ultrahigh Field imaging network (www.mr-gufi.de) to analyze and quantify possible differences between different generations of MRI scannersAcknowledgements
This work was supported by a grant from the German Research Foundation (DFG) / project German Ultrahigh Field Imaging / Grant n. LA 1325/7-1, QU 154/5-1. UHF-adapted imaging sequences were provided by Siemens Healthcare.References
1. Brenner et al., Proc. Intl. Soc. Mag. Reson. Med. 22, 1455 (2014)
2. Patenaude B. et al. A Bayesian Model of Shape and Appearance for Subcortical Brain NeuroImage, 56(3):907-922, 2011.
3. Voelker MN et al. The traveling heads: multicentre brain imaging at 7 Tesla, MAGMA. 2016;29(3):399-415)
4. Eckstein K et al. Computationally Efficient Combination of Multi-channel Phase Data From Multi-echo Acquisitions (ASPIRE)..Magn Reson Med. 2018 Jun;79(6):2996-3006. doi: 10.1002/mrm.26963. Epub 2017 Oct 16.
5. Li W et al. Integrated Laplacian-based phase unwrapping and background phase removal for quantitative susceptibility mapping. Nmr Biomed 2014;27(2):219-227.
6. Schofield MA et al. „Fast phase unwrapping algorithm for interferometric applications“,Optics Letters (14), 1194–1196 (2003).
7. Wu B et al. „Whole Brain Susceptibility Mapping Using Compressed Sensing“, Magnetic Resonance in Medicine (1), 137–147 (2012).
8. Wei H et al. „Streaking Artifact Reduction for Quantitative Susceptibility Mapping of Sources with Large Dynamic Range“, NMR in Biomedicine (10), 1294–1303 (2015).
9. Chen Y et al. „STrategically Acquired Gradient Echo (STAGE) imaging, part I: Creating enhanced T1 contrast and standardized susceptibility weighted imaging and quantitative susceptibility mapping“, Magnetic Resonance Imaging, 130–139 (2018).
10. Zaiss M et al. Relaxation-compensated CEST-MRI of the human brain at 7 T: Unbiased insight into NOE and amide signal changes in human glioblastoma. NeuroImage 2015; 112:180-188
11. Zaiss M et al. Snapshot-CEST: Optimizing spiral-centric-reordered gradient echo acquisition for fast and robust 3D CEST MRI at 9.4 T. NMR Biomed 2018; 31:e3879
12. Zaiss M et al. Inverse Z-spectrum analysis for spillover-, MT-, and T1-corrected steady-state pulsed CEST-MRI – application to pH-weighted MRI of acute stroke. NMR Biomed 2014; 27(3):240-252
13. Weiskopf N et al. Quantitative multi-parameter mapping of R1, PD(*), MT, and R2(*) at 3T: a multi-center validation. Front Neurosci. 2013 Jun 10;7:95. doi: 10.3389/fnins.2013.00095. eCollection 2013.
Figures