4453
Repeatability of T2 Relaxation Measurements over a Four-Year PeriodXing Wang1,2, Cheryl R McCreary2,3, Marina Salluzzi3,4, and Richard Frayne1,2
1Medical Sciences, Radiology and Clinical Neurosciences, Hotchkiss Brain Institute, University of Calgary, Calgary, AB, Canada, 2Seaman Family MR Centre, Foothills Medical Centre, Alberta Health Services, Calgary, AB, Canada, 3Radiology and Clinical Neurosciences, Hotchkiss Brain Institute, University of Calgary, Calgary, AB, Canada, 4Calgary Image Processing and Analysis Centre (CIPAC), Seaman Family MR Centre, Calgary, AB, Canada
Synopsis
The reliability of a T2 relaxation quantification technique was assessed by repeatedly scanning four subjects (total of 12 scans at 4 time points over 4 years). Both total, biological and scanner variability were assessed across the whole brain and in the frontal, occipital, parietal temporal lobes. Total variability (coefficient-of-variation CoV < 10.3%) was dominated by biological variation (CoV < 10.3%). Scanner variability was low (CoV < 1.6%) despite scanner software and hardware upgrades during this interval. These results suggest that quantitative T2 estimates are reproducible over 4 years and robust to scanner upgrades.
Introduction
Natural and pathological aging causes changes to the brain. Natural changes are often hard to separate from pathologic changes. Compounding this relationship is the fact that aging is a risk factor for many neurodegenerative diseases.[1] Quantitative magnetic resonance (qMR) imaging methods may provide biomarkers that could help distinguish natural versus pathological brain changes with age. The Calgary Normative Study (CNS) uses qMR imaging to assess brain changes in presumed normal subjects. Over 320 subjects from 18 to over 90 years of age have been enrolled in this ongoing study; with 99 subjects returning for a follow-up scan after approximately 3.5 years. Each subject has been imaged with a comprehensive battery of quantitative MR imaging techniques.An important aspect of potential biomarker evaluation is understanding the repeatability and variability of the biomarker measurement. To address this, the CNS included repeated imaging sessions of 4 participants. The repeatability of the T2 relaxation quantification techniques used in CNS was assessed. The coefficient-of-variation (CoV) was used as a measure of variability and is defined as ratio of the measurement standard deviation to the mean and is expressed as a percentage. A small CoV is desirable as it indicates measurements that are close to the mean of the measurements.Methods
Volunteers were eligibile to partipate in the CNS if they did not report any significant neurological or psychiatric disease or disorder, did not have contraindications to MR imaging at 3T, and were willing to provide informed consent in accordance with our institutional research ethics board. Participants also provided a brief medical history and had a Montreal Cognitive Assessment (MoCA). Individuals scoring <26 were excluded from analyses. For repeatability assessment, four normal subjects (36.3 ± 11.5 years) were scanned at four time points: t0=2.3 ± 3.6 weeks, t1=14.5 ± 1.2 months, t2=20.0 ± 0.9 months, and t3=48.9 ± 1.0 months. At each time point, three separate scans on were obtained for each individual on a 3 T scanner (Discovery MR750; General Electric Healthcare, Waukesha, WI). Minor (software) and major (hardware) changes occurred at 12 months and 19 months from baseline, respectively. A 2D fast spin-echo sequence was used to acquire T2 relaxation data (TR = 3,000 ms, TE = ~9ms, inter-echo spacing ~9ms, 16 echoes, in-plane resolution = 0.94 mm × 0.94 mm, 5 mm slices, acquisition matrix = 256 × 256). T2 maps were calculated after applying a stimulated echo correction algorithm.[2] Bothwhole brain and regional analyses (temporal, TL; frontal, FL; parietal, PL; and occipital, OL, lobes) were conducted using an atlas (MNI152 in FSL [3]). Total, biological and scanner variability were assessed using the CoV. CoV calculated based on the T2 values over all subjects at each point was considered to reflect the biological variability (i.e., between subject variability). CoV calculated based on the T2 values of all points in each subject was considered to reflect the scan variability (i.e., within subject). Total variability was the CoV over all subjects and time points.Results
The whole brain and regional gray matter T2 results are shown in Figure 1 as box plots. For each box plot, the box represents the interquartile range, the error bars represent the 5th and 95th percentile, the line within the box represents the median. The points outside the box are considered outliners, but have not been excluded from the analysis. The total, biological and scanner variabilities are summarized in Table 1. The CoV across time points for all brain regions within each individual was < 1.6%. CoV (Table 1). Across subjects for all brain regions CoV ranged from 5.7% to 10.3%. CoV pooled across both time points and subjects for all brain regions was between 6.8% and 10.3%.
Conclusion
The scanner variability was CoV < 1.6%. The variability within each subject (i.e., what we assume to be scanner variability) is smaller than the between subject variability (i.e., biological variability).Our results show that the scanner variability across all subjects were small despite two scanner upgrades during the course of the study. These results suggest that quantitative estimation of T2 is repeatable and robust to scanner upgrades. These measurements of T2 variability data will be useful in sample size and power calculations for future studies.Acknowledgements
The Calgary Normative Study is funded by the Canadian Institute for Health Research (CIHR).References
- Peters R. Ageing and the brain.Postgrad Med J. 2006, 82: 84-8
- Uddin MN, Lebel RM, Wilman AH. Transverse relaxometry with reduced echo train lengths via stimulated echo compensation. Magn Reson Med. 2013, 70: 1340-6
- https://fsl.fmrib.ox.ac.uk/fsl/fslwiki
Figures
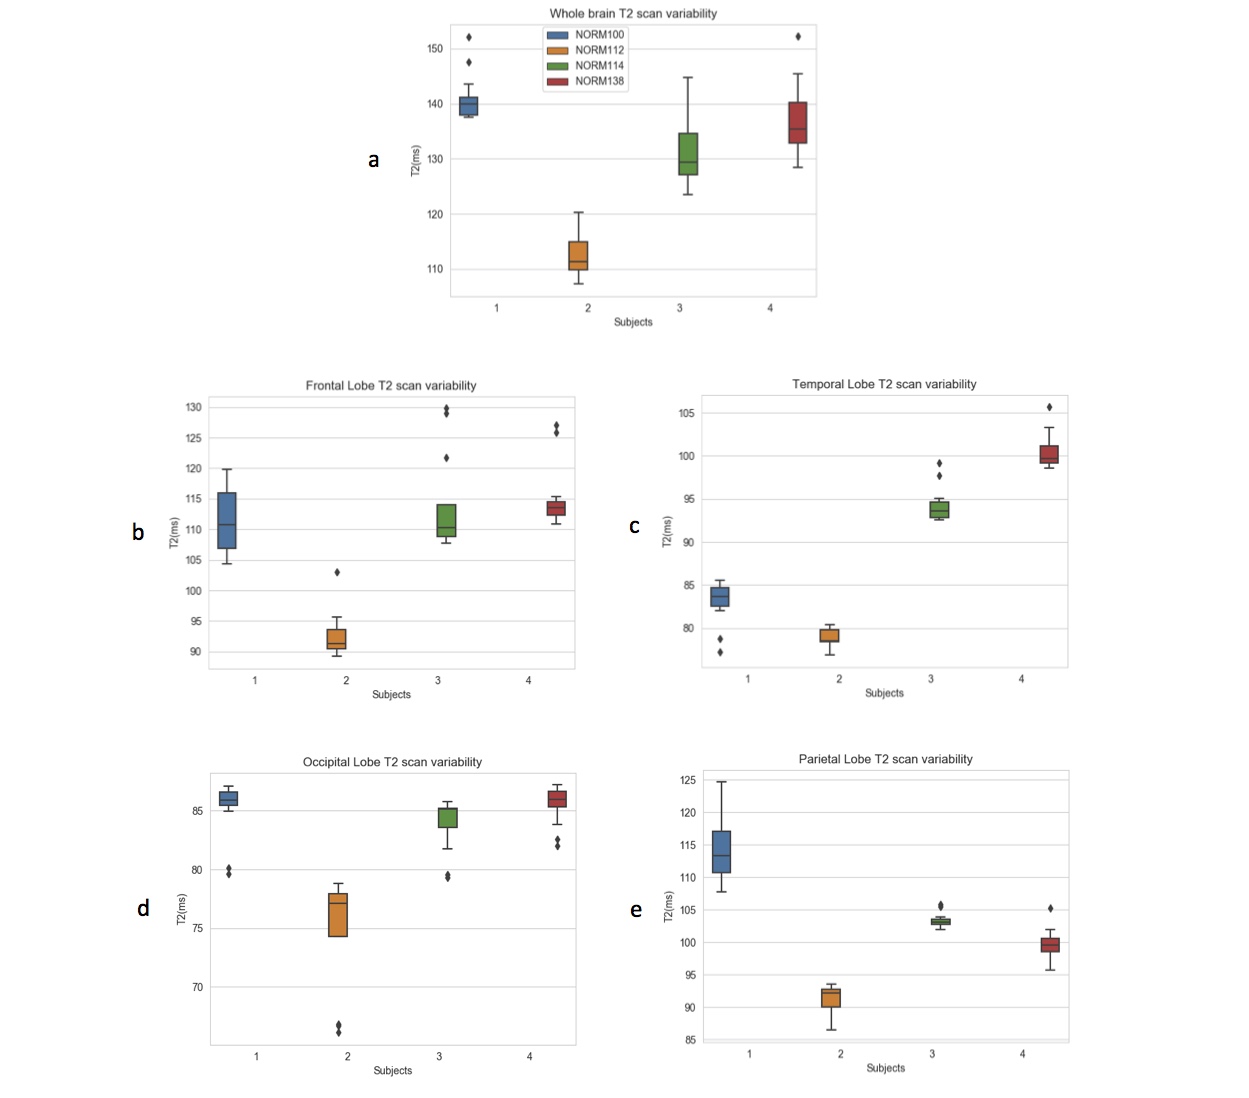
Figure 1: Box plot of scan variability in brain regions (a: whole brain, b: frontal lobe, c: temporal lobe, d: occipital lobe and e: parietal lobe). The length of each box represents the interquartile range (defined as the distribution from 25% to 75% of the data). Colours denote scans for subjects 1 to 4.
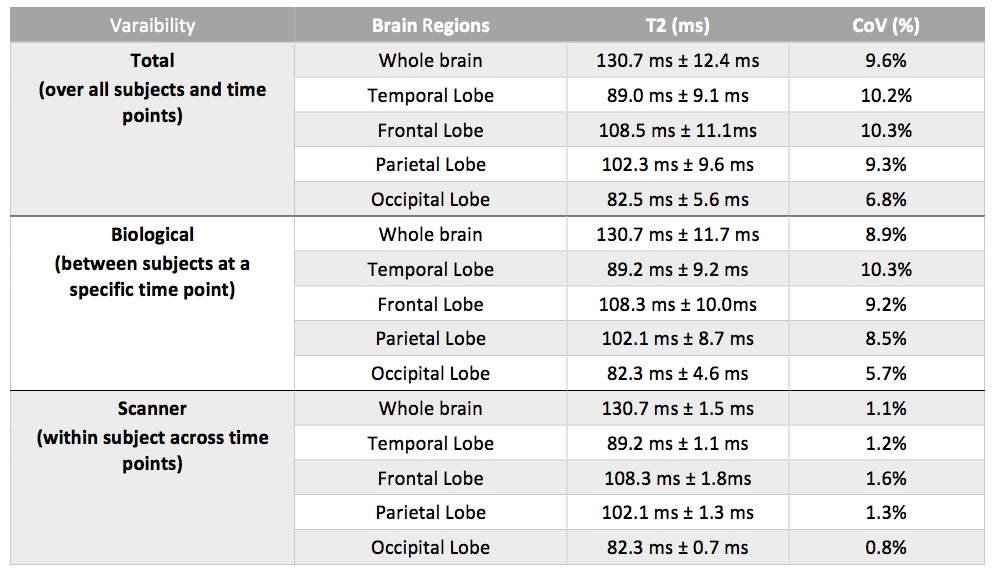
Table 1: Measured T2 relaxation times and calculated CoV for total brain and brain regions. Shown are total, biological, and scanner variability. Reported are mean ± standard deviation.