4452
Cross-system reliability for rapid quantitative MRI1SyntheticMR AB, Linköping, Sweden, 2Center for Medical Image Science and Visualization, Linköping, Sweden
Synopsis
Absolute quantification of R1 and R2 relaxation rates and proton density PD has been gaining considerable attention in recent years. It is of utmost importance that these measurements entirely reflect patient properties and no influence is detectable on which specific MRI scanner system the quantitative maps were obtained. The SyMRI software was verified on Philips, GE and Siemens scanners at both 1.5T and 3T showing cross-system reliability.
Purpose
Absolute quantification of MR properties such as R1 and R2 relaxation rates and proton density PD can provide objective measures in MRI, which conventionally relies on variable scanner settings in combination with subjective image interpretation. For cross-system reliability the R1, R2 and PD maps have to show the same values (within a small tolerance interval) for an individual who was scanned on different systems. Quantified R1, R2 and PD can be used for automatic tissue identification and segmentation[1]. Such a method requires reliable results to ensure diagnostic stability.
The purpose of this work was to verify the volumetric quantification of brain tissue using the SyMRI software[2] on Philips, GE and Siemens at field strengths 1.5T and 3T.
Method
A group of 12 subjects were scanned on a Philips Ingenia 1.5T, Philips Ingenia 3T, GE Optima MR450w 1.5T, GE Discovery MR750 3T, Siemens MAGNETOM Aera 1.5T and Siemens MAGNETOM Prisma 3T. The scan time was 6 minutes.
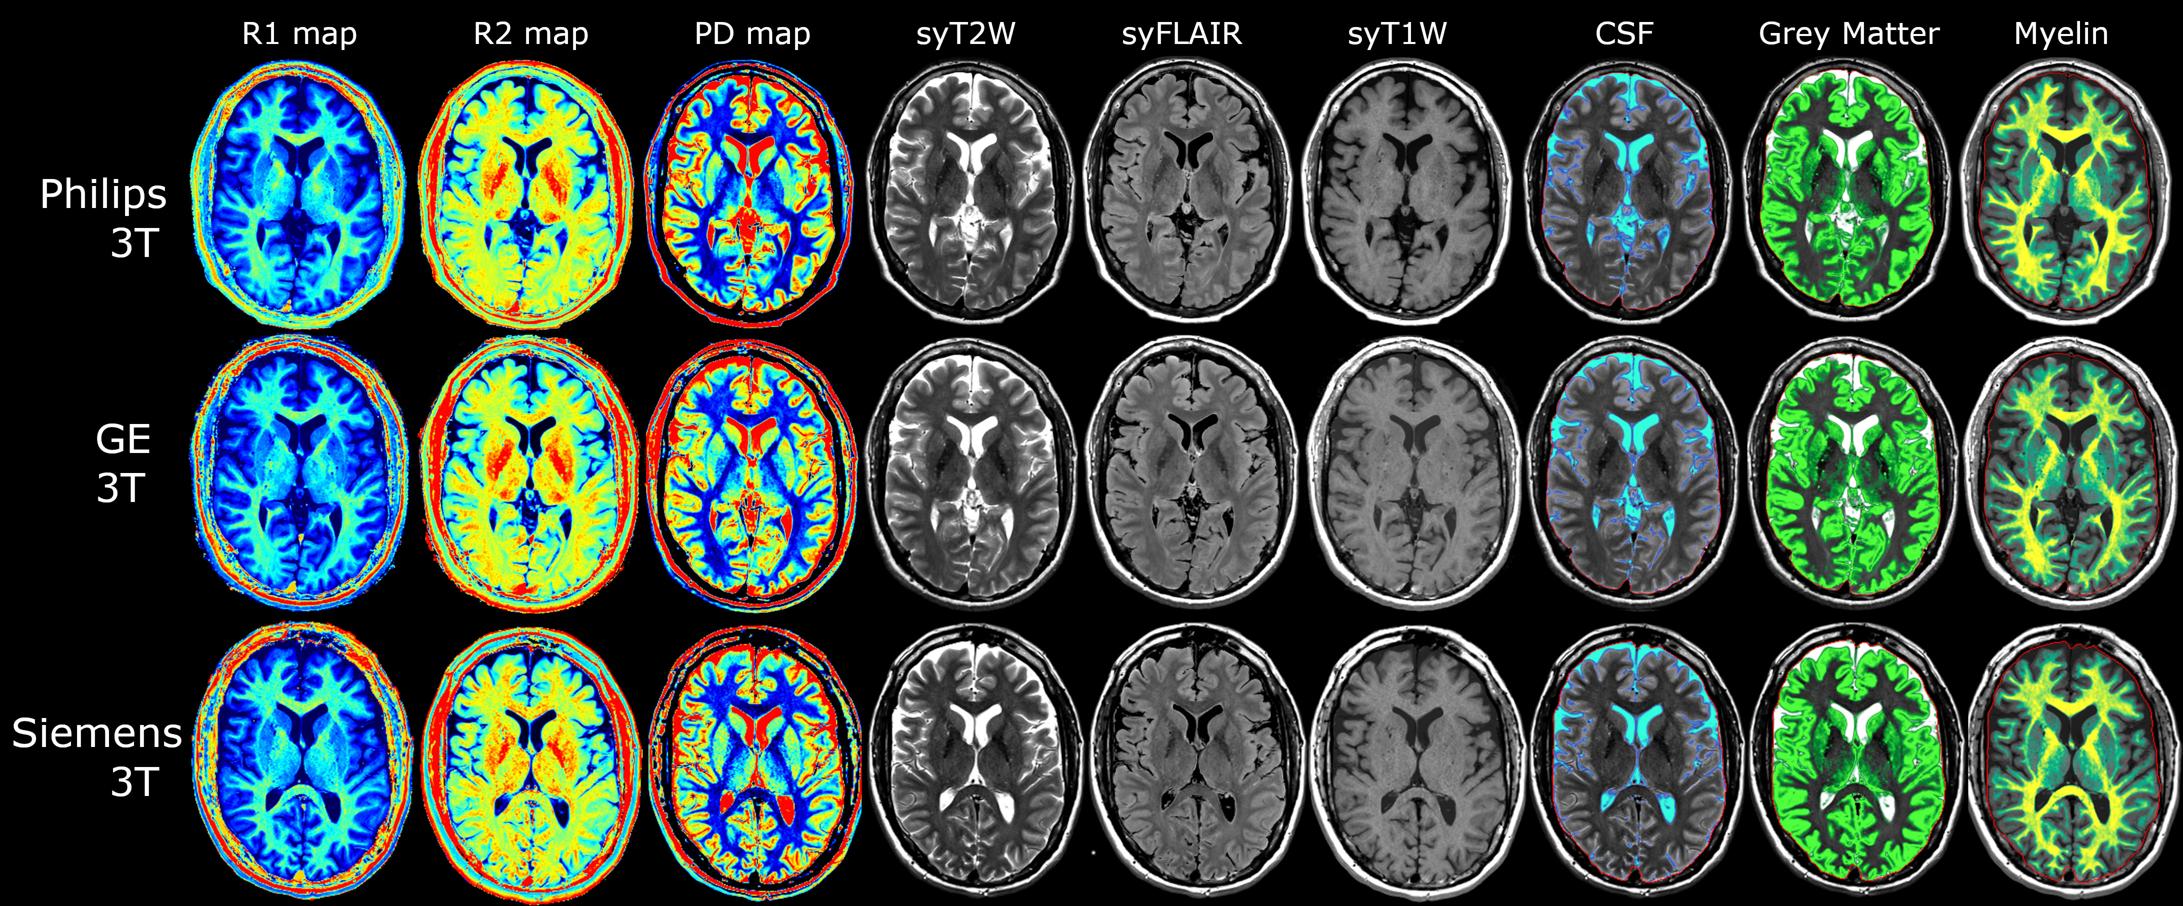
The quantification sequence is based on a multi-saturation delay, multi-echo TSE acquisition [3], providing R1, R2 and PD maps. Based on these maps contrast weighted images such as T2W, FLAIR and T1W can be synthesized [4]. The maps also provide robust input data to generate volume estimations of white matter, grey matter and CSF, as well as for myelin [5]. All post-processing was performed by a beta version of
SyMRI 11.1 (SyntheticMR AB, Sweden). Postprocessing time was 10 seconds on a
regular laptop.
Statistical analysis were performed using the software R version 3.4.0, where fitting to a linear mixed effects model were performed using the function lme from nlme package. MRI scanner field strength and manufacturer were used as nested fixed effect factors and subject were used as a random effect factor. The tissue volumes were normalized for different geometric distortion on different systems, by evaluating them as fractions of the intracranial volume.
Results
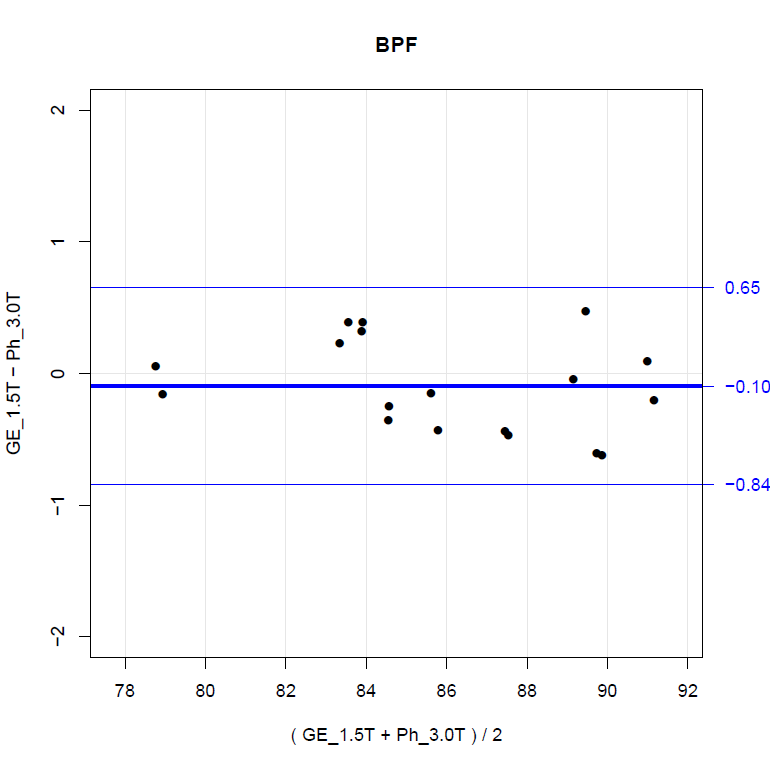
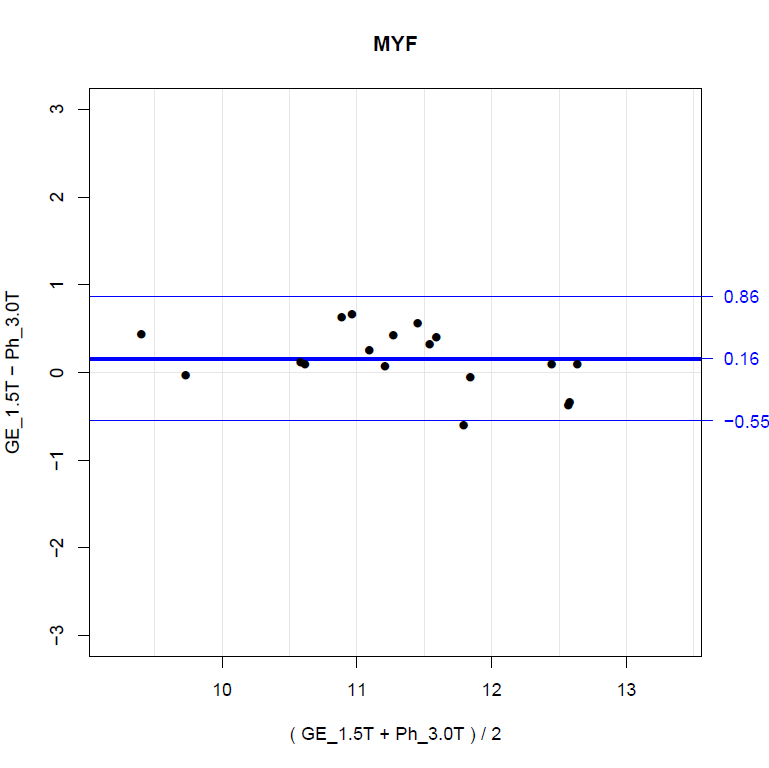
The the volumetric difference of white matter, grey matter, CSF, brain parenchyma and myelin, as a fraction of the intracranial volume, were on average within 0.8% between systems. This can be related to the repeatability error as within subject standard deviation which ranges between 0.2-0.8%, which means that the bias between different systems are smaller than or on the same order as the difference between scan and re-scan on the same system.
With contrast deviation coding of the fixed effects (system as difference from grand mean), the fixed effects for BPF (brain parenchyma volume as fraction of intracranial volume) ranged from -0.24% to +0.24%. This can be related to the average annual decrease in BPF, which is about 0.4 % for healthy adults [6].
With only manufacturer as fixed effect, the fixed effect for BPF ranged from -0.19% to 0.14%.
With only field strength as fixed effect, the fixed effect for BPF ranged from -0.02% to 0.02%.
With manufacturer and field strength as fixed effect, the fixed effect for MYF ranged from -0.09% to 0.07%.
With only manufacturer as fixed effect, the fixed effect for MYF ranged from -0.02% to 0.01%.
With only field strength as fixed effect, the fixed effect for MYF ranged from -0.06% to 0.06%.
Conclusion
The study showed reliability of volumetric quantification of brain tissue when acquiring image data of a patient on 6 different systems and post-processing it using SyMRI. This indicates good repeatability of R1, R2 and PD quantification, and reliability across systems leads to more objective decision support. MR quantification has an additional advantage that also contrast weighted images, such as T2W, FLAIR and T1W can be synthesized on the same data, providing abundant information in a very short scan time.
Acknowledgements
No acknowledgement found.References
1. West et al. Novel whole brain segmentation and volume estimation using quantitative MRI. Eur Radiol. 2012;22:998-1007.
2. Hagiwara et al. SyMRI of the Brain: Rapid Quantification of Relaxation Rates and Proton Density, With Synthetic MRI, Automatic Brain Segmentation, and Myelin Measurement. Invest Radiol. 2017;52:647-65.
3. Warntjes et al. Rapid magnetic resonance quantification on the brain: Optimization for clinical usage. Magn Reson Med 2008;60:320-329.
4. Tanenbaum LN, Tsiouris AJ, Johnson AN, Naidich TP, DeLano MC, Melhem ER, Quarterman P, Parameswaran SX, Shankaranarayanan A, Goyen M, Field AS. Synthetic MRI for Clinical Neuroimaging: Results of the Magnetic Resonance Image Compilation (MAGiC) Prospective, Multicenter, Multireader Trial. AJNR Am J Neuroradiol. 2017;38:1103-1110.
5. Warntjes et al. Myelin Detection Using Rapid Quantitative MR Imaging Correlated to Macroscopically Registered Luxol Fast Blue-Stained Brain Specimens. AJNR Am J Neuroradiol. 2017;38:1096-1102.
6. Vågberg et al. Brain Parenchymal Fraction in Healthy Adults—A Systematic Review of the Literature. PLoS ONE. 2017;12(1):e0170018
Figures