4446
Improvement of Glutamate Chemical Exchange Saturation Transfer (GluCEST) Imaging in a Rat Model of Epileptic Seizure Using Retrospective Motion Correction1Faculty of Health Sciences and Brain & Mind Centre, The University of Sydney, Sydney, Australia, 2Center for Bioimaging of New Drug Development, and MR Core Laboratory, Asan Institute for Life Sciences, Asan Medical Center, Seoul, Korea, Republic of, 3MR Core Laboratory, Asan Institute for Life Sciences, Asan Medical Center, Seoul, Korea, Republic of, 4Department of Radiology, Asan Medical Center, University of Ulsan College of Medicine, Seoul, Korea, Republic of, 5Department of Convergence Medicine, Asan Medical Center, University of Ulsan College of Medicine, Seoul, Korea, Republic of
Synopsis
GluCEST is a novel molecular MR imaging technique to detect glutamate in the brain parenchyma by measuring the exchange of glutamate amine protons with bulk water. However, a disadvantage of CEST imaging is the relatively long scan time required to collect the data while varying the resonance frequency around the water. In this abstract, we describe the application of a retrospective motion correction approach using a gradient-based motion correction (GradMC) algorithm to CEST data for investigating the feasibility of motion correction, using an epileptic seizure rat model with head motion. Our results clearly show that the GradMC can be used in CEST imaging to efficiently correct for motion.
Purpose
Glutamate CEST (GluCEST) is a method for imaging parenchymal glutamate levels by measuring the exchange of glutamate amine protons with bulk water, currently applied to epilepsy and neurodegenerative brain diseases.1,2 A disadvantage of CEST imaging is the relatively long scan time required to collect the data while varying the resonance frequency around the water, resulting in image degradation due to subject motion. The purpose of this study is to apply the retrospective gradient-based motion correction (GradMC) algorithm3,4 to CEST data for correcting brain motion induced by arbitrary head motion inside the head coil, using an epileptic seizure rat model.Methods
CEST experiment: Epileptic seizure was induced in six male Wistar rats by 15 mg/kg intraperitoneal injection of kainic acid (KA).5 CEST data were obtained using a 7T Bruker MRI scanner before and 3 hours after KA injection. CEST data were acquired using a turbo-RARE pulse sequence with the following parameters: S0 image and -3.67~+3.67ppm at 0.33ppm intervals, TR/TE=4200/36.4ms, RARE factor=16, and a continuous-wave RF saturation pulse (power/time=5.6μT/1s). A B0 map with double echo-times (1.9 and 2.6ms) and a B1 map with double flip-angles (30° and 60°) were acquired to correct field inhomogeneities.1 The GluCEST signal was calculated at 3.0ppm using the following equation: [Ssat(-3.0ppm) - Ssat(+3.0ppm)]/Ssat(-3.0ppm)1,2 based on the manually drawn ROI in the hippocampus region.
Motion correction procedures: The cost function based on the image gradient entropy metric was constructed as follows: Φ(u)=H(Dxu)+H(Dyu), H(u)=-vTln v, v=√(u○ū/uHu), where Dx and Dy are horizontal and vertical finite difference matrices, H(∙) is a pixel entropy, u is an unknown image, and a○b is the pointwise (Hadamard) product of two vectors. We estimated the motion parameters θ, which best describe the motion in the corrupted volume, and then corrected for motion. By empirical inversion we mean the application of Aθ directly to a motion-corrupted observation y as follows: uθ=FHAθy, where uθ is a result image in the spatial domain, Aθ is a rigid motion transformation matrix, and F is an orthonormal Fourier matrix. We regularized the trajectory of the recovered motion parameters by putting a quadratic penalty on the differences of consecutive motion parameters as follows: θ=argminΦ(FHAθy)+λ|Dθ|2, where D is a finite difference matrix, T is the number of k-space lines, and λ is a regularization parameter controlling the smoothness. The translation correction amounts to a multiplication of each k-space line with a linear phase ramp, exp(-2πikxθt), where θt is a translation function, and kx is the Fourier coefficient of the affected view. To compute the rotation effect, we constructed a deformed grid by rotating the points of each k-space line by their time-respective angles, and then we performed the interpolation in an oversampled k-space to estimate the values on the points of the rotated grid. We performed a minimizing cost function using a multi-scale coarse-to-fine approach. In the first scale iteration, GradMC finds only the lowest frequency segments of the motion trajectory. These segments are surrounded by gaps corresponding to yet unknown motion parameters of higher-frequency views. In each scale iteration, the gaps shrink until finally the whole trajectory is recovered. More details of GradMC are available (see Ref. 3,4).
Results and Discussion
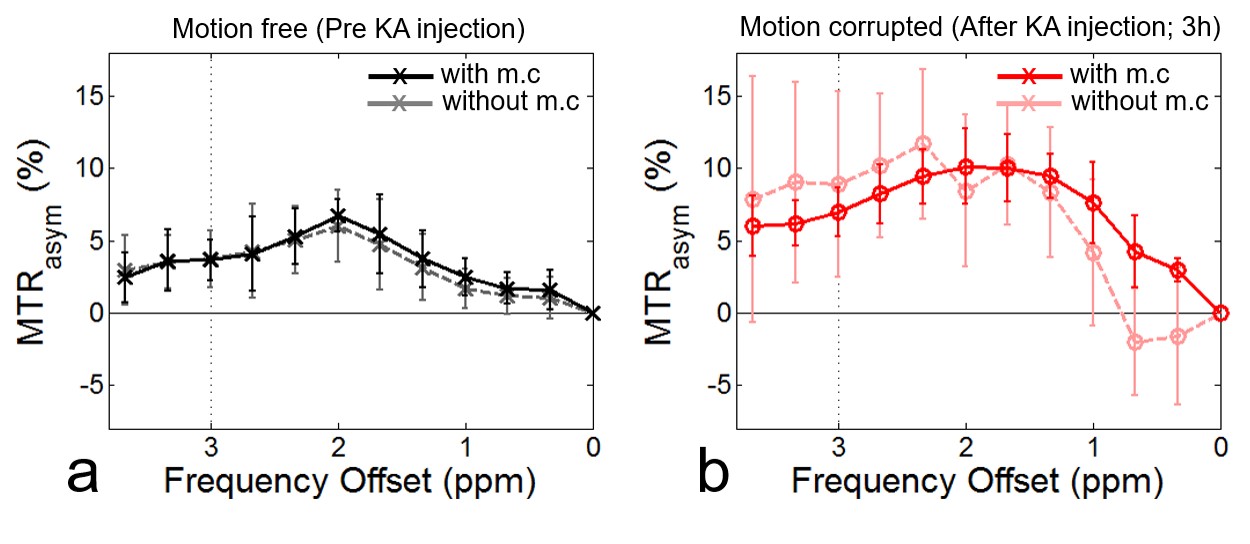
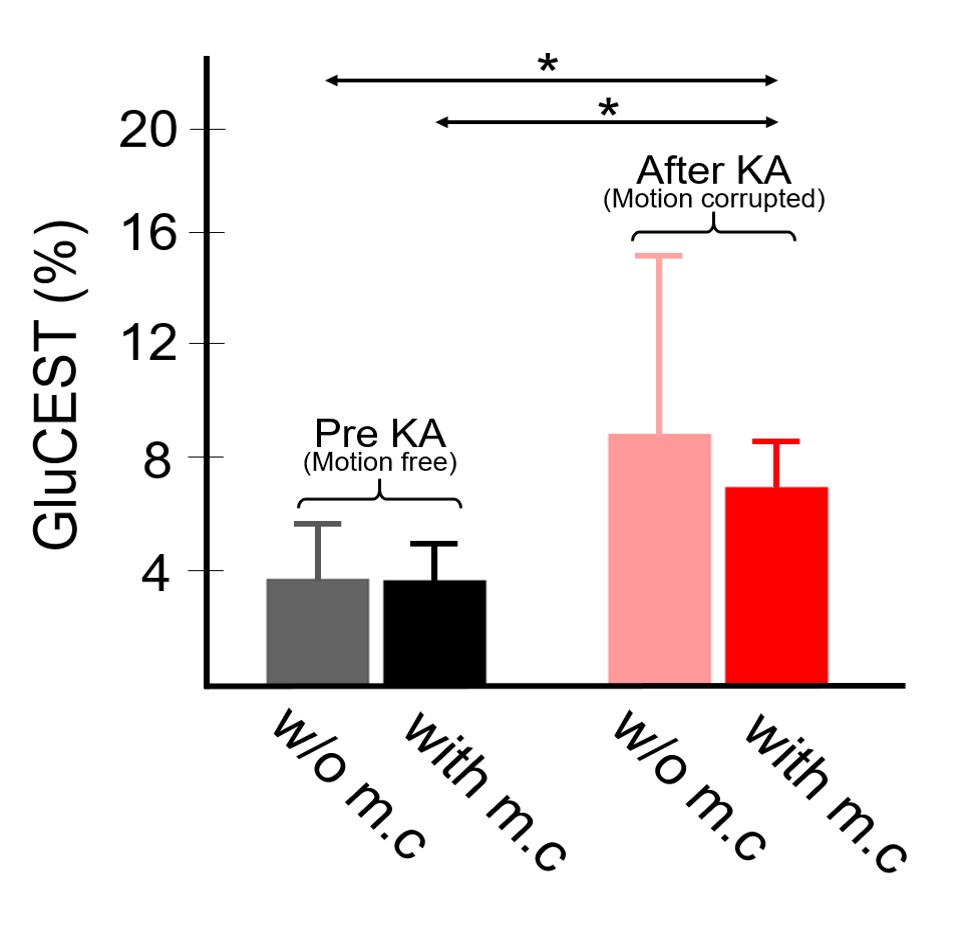
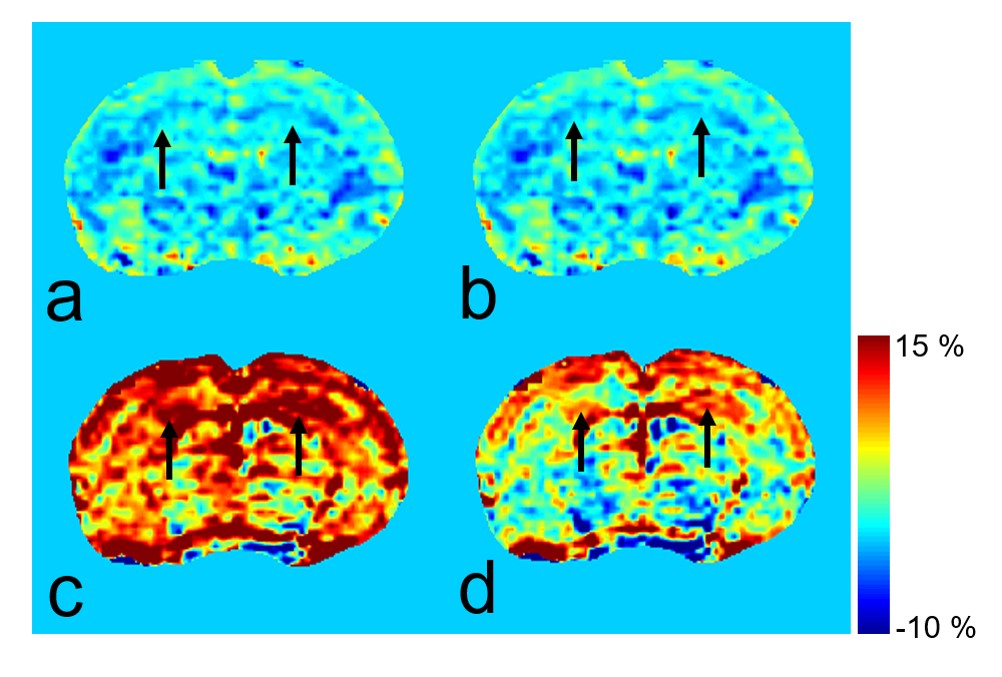
The MTRasym spectra showed no significant differences in pre-KA data regardless of motion correction (Fig. 1a) and showed significant differences after-KA data depending on the motion correction (Fig. 1b). Specifically, after correcting for the seizure-like motion, the MTRasym spectra showed improved results with significantly reduced signal changes and standard errors. The GluCEST signal also significantly differed between pre-KA data regardless of correction, and the after-KA data with correction (Fig. 2; 3.726±1.982/3.662±1.393 vs. 8.884±6.407/6.996±1.684 for pre- and after-KA data with and without correction, respectively; Mann-Whitney U test: all P<0.05 between any pre-KA data and after-KA data with correction), as expected. Fig. 3 shows the reconstructed GluCEST maps (pre-KA without correction [a] and with correction [b]; after-KA without correction [c] and with correction [d]). In pre-KA data (Fig. 3a-b), there were no signal variations regardless of correction, as indicated in Fig. 2. In contrast, the distinctive seizure motion was markedly reduced by motion correction (Fig. 3c-d). Before correction, the whole brain area appeared to have high glutamate concentrations, and the hippocampus appeared to have over-estimated signals (black-arrow; Fig. 3c) compared with the result after correction (black-arrow, Fig. 3d).Conclusions
The results clearly show that the GradMC can be used to efficiently correct for motion in CEST imaging. Although we focused on evaluating data correction in epilepsy using GluCEST, we believe that GradMC can play a major role in motion correction for various types of CEST imaging.Acknowledgements
This study was supported by grants from the Basic Science Research Program through the National Research Foundation of Korea (NRF-2018R1C1B6004521, NRF-2017R1A6A3A03012461, and NRF-2018R1A2B2007694) and the Korea Health Technology R&D Project through the Korea Health Industry Development Institute (HI14C1090), funded by the Ministry of Health & Welfare, Republic of Korea. This study was also supported by the 2017 University of Sydney Postdoctoral Fellowship Scheme (192237).References
1. Cai K, Haris M, Singh A, Kogan F, Greenberg JH, Hariharan H, Detre JA, Reddy R. Magnetic resonance imaging of glutamate. Nat Med. 2012;18(2):302-306.
2. Davis KA, Nanga RP, Das S, Chen SH, Hadar PN, Pollard JR, Lucas TH, Shinohara RT, Litt B, Hariharan H, Elliott MA, Detre JA, Reddy R. Glutamate imaging (GluCEST) lateralizes epileptic foci in nonlesional temporal lobe epilepsy. Sci Transl Med. 2015;7(309):309ra161.
3. Loktyushin A, Nickisch H, Pohmann R, Schölkopf B. Blind retrospective motion correction of MR images. Magn Reson Med. 2013;70(6):1608-1618.
4. Loktyushin A, Nickisch H, Pohmann R, Schölkopf B. Blind multirigid retrospective motion correction of MR images. Magn Reson Med. 2015;73(4):1457-1468.
5. Lee DH, Lee
DW, Kwon
JI, Woo
CW, Kim
ST, Lee
JS, Choi
CG, Kim
KW, Kim
JK, Woo
DC. In vivo mapping and quantification
of creatine using chemical exchange saturation transfer imaging in rat models
of epileptic seizure. Mol Imaging Biol.
2018. In press.
Figures