4444
Super-resolution reconstruction applied to neonatal MRI: multi-orientation vs through-plane slice shift MRI acquisition and segmentation1Radiology, University of Geneva, Geneva, Switzerland, 2Pediatrics, University Hospitals of Geneva, Geneva, Switzerland, 3School of Engineering, EPFL, Lausanne, Switzerland
Synopsis
In this study, the super-resolution (SR) method is used to reconstruct high-resolution MRI volumes from multi-orientation and through-plane shift low-resolution neonatal MRI. Multi-orientation low-resolution images yield higher quality SR results than through-plane shift low-resolution images. SR reconstructed volumes and high-resolution volumes from the scanner are segmented with a morphology-based segmentation algorithm. Segmentation quality is similar between the SR reconstructed volume and the high-resolution volume. Since low-resolution acquisitions are faster, they are less prone to motion artifacts, and thus the reconstructed SR volumes are an alternative to lengthy high-resolution acquisitions.
Purpose/Introduction
T2 weighted (T2w) high resolution (HR) MRI is used for improving gray-white matter contrast in the neonatal brain for morphometric purposes, such as brain segmentation to understand early brain development1. Due to long acquisition times, images are often degraded by neonatal motion. Usually, the procedure has to be repeated, increasing overall scan time without guaranteeing motion-free images. A possible strategy to reduce scan time and the risk of motion is acquiring thick slices. With the super-resolution (SR) method we can reconstruct HR volumes from thick MRI slices2. There are two different approaches to acquire low resolution (LR) stacks in MRI: acquisition of thick slices in multi-orientation3,4 or in a single orientation with a through-plane slice shift5. The aim of this study is to compare these two approaches in neonatal MRI and to validate the SR method with segmentation. Although several publications claim that multi-orientation LR provides better volume6 than through-plane shift, there is no comparative study on neonatal images. Therefore, we assess reconstruction results by visual inspection and quantitative measurements.Methods
Data acquisition
10 neonatal MRI datasets were acquired with T2w Turbo Spin Echo in 3T MRI (Prisma-Siemens) using 16ch receiver head coil and MR compatible incubator (for preterm babies). HR volumes were acquired with TR=4990ms, TE=160ms, 0.4x0.4x1.2mm resolution, acquisition time (TA) 5min. LR stacks were acquired with two strategies: 1mm through-plane slice shift (3 subjects) and multi-orientation (coronal, sagittal, axial, oblique) (7 subjects), both with TR=9220ms, TE=157ms, 0.8x0.8x3mm resolution, TA=1 min per LR stack.
Data processing
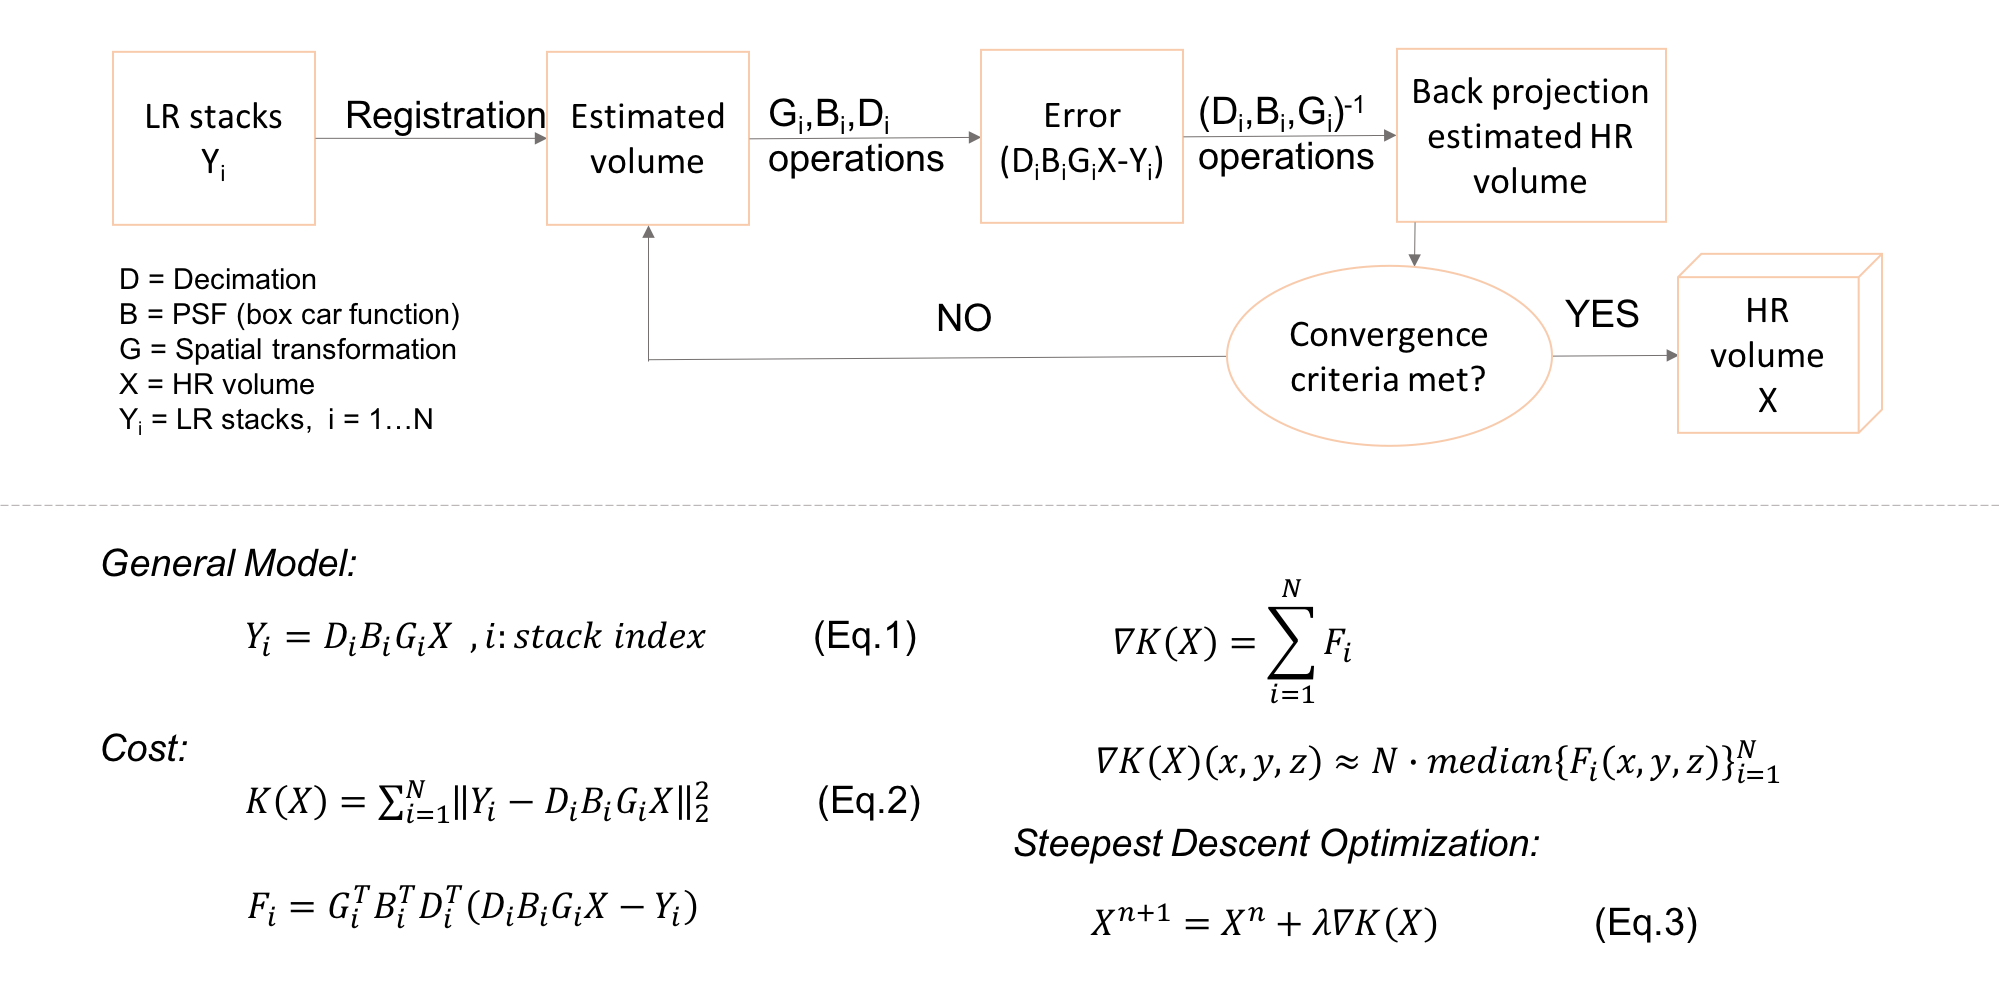
The SR algorithm in MRI is based on a linear acquisition model (Eq.1 in Figure 1), which aims at finding the inverse solution of the forward model. The SR problem can be defined as Maximum Likelihood Estimation (MLE)7. Figure 1 shows the diagram of the SR-MLE method. The least square solution to this problem minimizes the L2 norm of the error (Eq.2), while reconstructing the HR volume from the LR stacks via gradient-based iterative optimization(Eq.3). The SR-MLE algorithm was used to compute HR volumes from LR datasets of 10 neonates. To validate the procedure, the HR MRI of one subject was used to simulate orthogonal LR stacks (0.8x0.8x3mm) and HR volume was reconstructed using SR-MLE. Structural similarity index (SSIM) and peak signal to noise ratio (PSNR) were computed between the SR and HR volumes.Due to the ongoing myelinization of the neonatal brain, MRI tissue contrasts are different compared to the adult brain. So, existing adult brain segmentation tools are not applicable to neonates. We used a morphological segmentation method that does not rely on manual interaction or the use of an atlas. The approach is based on the infusion of high-level brain morphology knowledge regarding relative tissue location, connectivity, and structure1.
Results
The simulation results show that the algorithm provides sharp and accurate images. SSIM and PSNR values were 0.8712 and 31.0742dB between SR and HR volume.
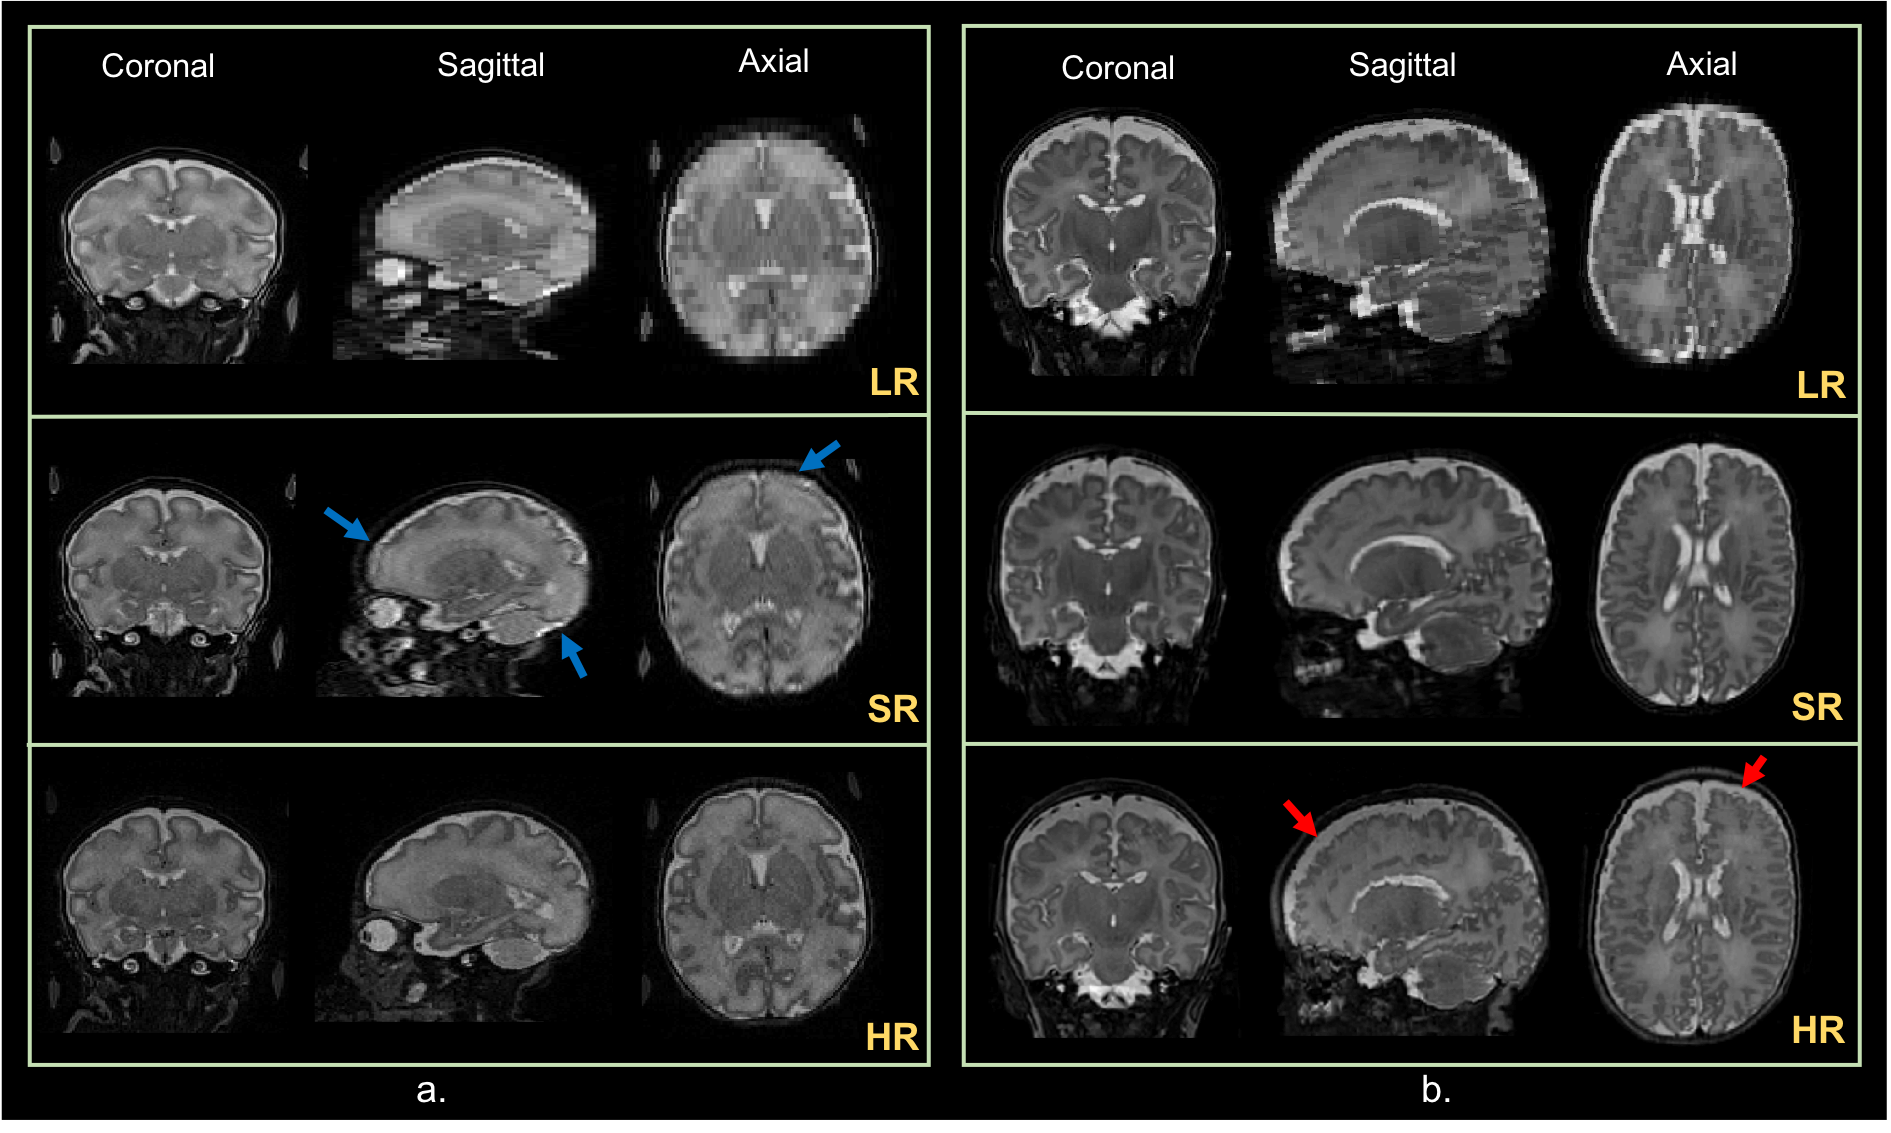
Figure 2 shows (a) from top to bottom, orthogonal views of a stack of the through-plane shift LR data of a preterm baby, reconstructed volume and HR volume. Blue arrows indicate the poor resolution due to fat. (b) Orthogonal views of a stack of multi-orientation LR of a term-born baby, reconstruction results and HR volume. Red arrows indicate motion artifacts on the HR volume. The acquisition of both approaches from a single subject for comparison was not possible due to time limitations. Visual assessment: the multi-orientation LR acquisition yields sharper and better-contrasted images.
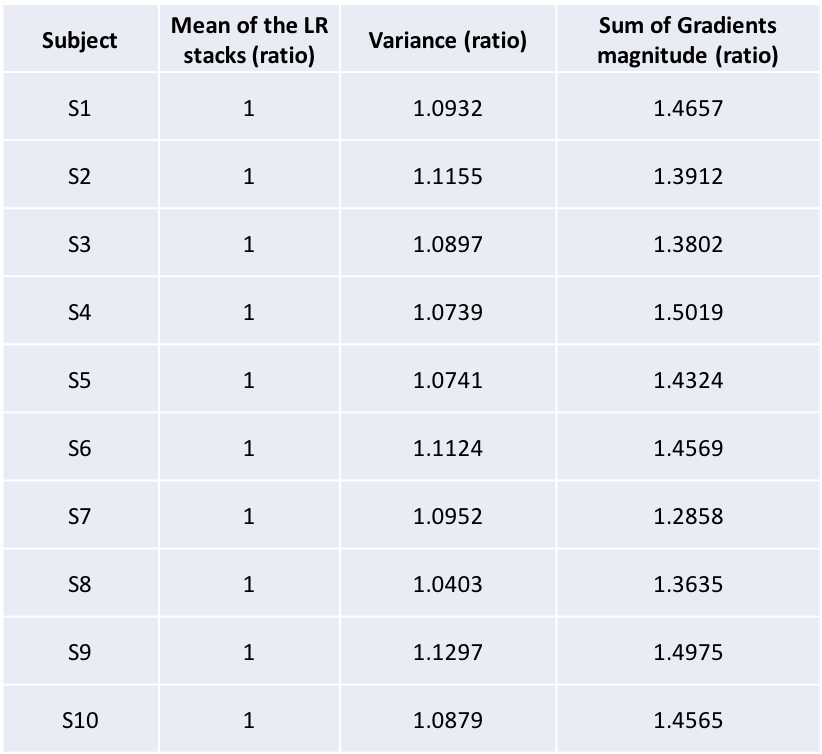
Table 2 presents two sharpness measures (intensity variance, sum of magnitude of image gradient) for the SR volumes of subjects. The values are ratios between the values measured in the final reconstructed image and those measured in the first iteration of the reconstruction process (corresponding to the initial image, which is the average of the LR stacks). The values show that SR provides sharper images than the average of the LR stacks. The algorithm converges, and contrast increases with each iteration.
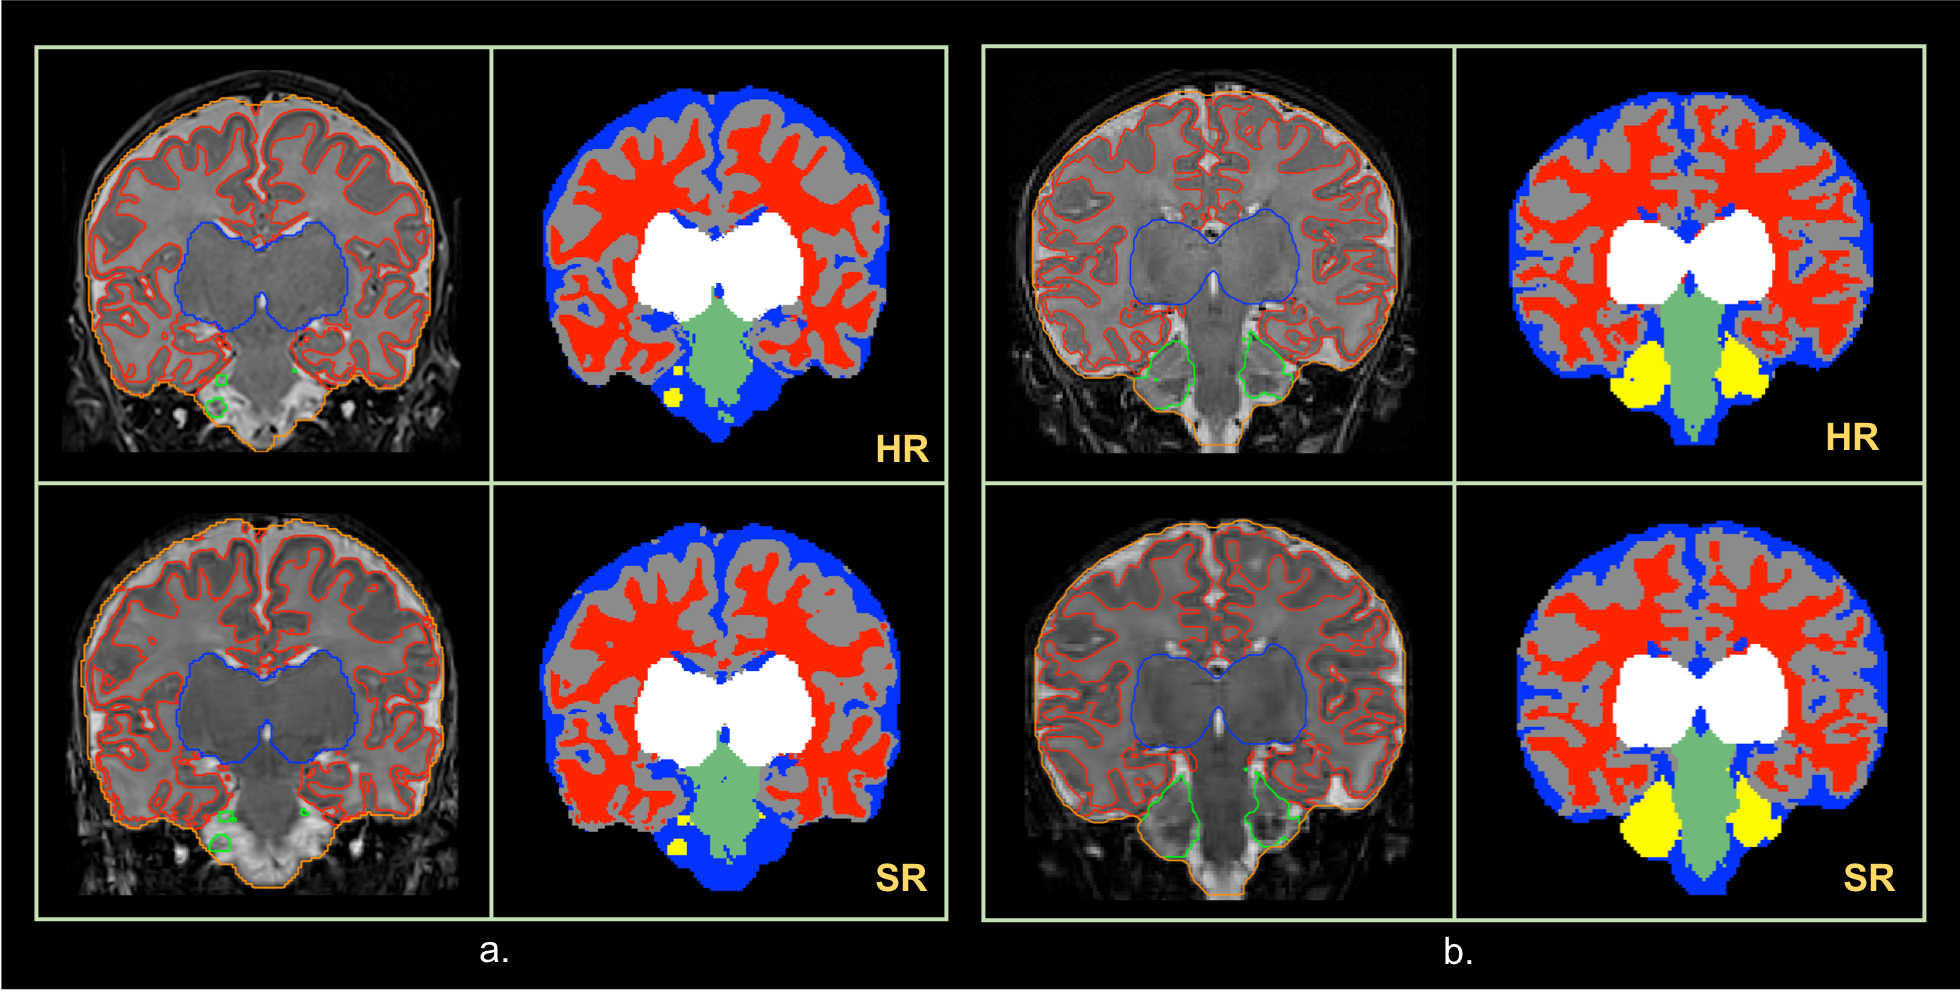
Figure 3 shows segmentation results for two subjects (a, b). Segmentation quality is similar between HR (first row) and SR volumes (second row). Note that slice location is close but not identical between the two volumes.
Discussion/Conclusion
In the clinical setting, neonates still need to be sedated during MRI examinations. SR could be a good alternative in order to avoid sedation, which has some risks. Moreover, SR reconstruction of multi-orientation LR stacks can be a good alternative for lengthy acquisitions of motion risky HR volumes. Finally, SR provides good segmentation results, comparable to those obtained on motion-free HR images.Acknowledgements
No acknowledgement found.References
1. Gui L, Lisowski R, Faundez T, Huppi PS, Lazeyras F, Kocher M. Morphology-driven automatic segmentation of MR images of the neonatal brain. Med Image Anal. 2012;16(8):1565-79.
2. Fiat D, inventor Method of enhancing an MRI signal 1997.
3. Gholipour A, Estroff JA, Sahin M, Prabhu SP, Warfield SK. Maximum a posteriori estimation of isotropic high-resolution volumetric MRI from orthogonal thick-slice scans. Med Image Comput Comput Assist Interv. 2010;13(Pt 2):109-16.
4. Rousseau F, Glenn O, Iordanova B, Rodriguez-Carranza C, Vigneron D, Barkovich J, et al. A novel approach to high resolution fetal brain MR imaging. Med Image Comput Comput Assist Interv. 2005;8(Pt 1):548-55.
5. Shilling RZ RS, Brummer ME., Sampling strategies for super-resolution in multi-slice MRI. Proceedings of the International Conference on Image Processing, ICIP, San Diego, CA, USA, October12–15, 2008
6. Van Reeth E, Tham IWK, Tan CH, Poh CL. Super-Resolution in Magnetic Resonance Imaging: A Review. Concepts in Magnetic Resonance Part A. 2012;40A(6):306-25.
7. Gholipour A, Estroff JA, Warfield SK. Robust super-resolution volume reconstruction from slice acquisitions: application to fetal brain MRI. IEEE Trans Med Imaging. 2010;29(10):1739-58.
Figures