4435
High resolution 3D GRASE BLADE Arterial Spin Labelling sequence: evaluation of the performance with various level of motion: simulations and validation in volunteers and patients1University of Lyon, INSA, CNRS UMR 5520, INSERM U1206, CREATIS, Lyon, France, 2Siemens Healthcare SAS, Saint-Denis, France, 3Fraunhofer MEVIS, Bremen, Germany, 4University Bremen, Bremen, Germany, 5Mediri GmbH, Heidelberg, Germany, 6Radiology Department, University Hospital of Saint Etienne, Saint Etienne, France
Synopsis
In MRI, longitudinal acquisition protocols such as arterial spin labeling are susceptible to patient motion; this work focused on implementing 3D GRASE with BLADE readout trajectory as an alternative to Cartesian readout to increase robustness of sequence with regards to motion. Virtual data simulation and involuntary patient motion data were used to evaluate the performance of this approach with different levels of patient motion. Image reconstruction embedded with self-referenced custom rigid motion correction algorithm was developed and tested on both simulated and patient data. Results confirming superiority of SNR and motion correction capabilities offered by Blade strategy over Cartesian.
Introduction
Single-shot 3D GRASE with PROPELLER readout trajectory (3DGP) has been proposed as an alternative to 3D GRASE Cartesian (3DGC) strategy to increase robustness of 3D GRASE with regards to motion and reduction of through plane blurring, for PASL perfusion measurements [1]. 3DGP-PASL was implemented on a unique platform (GE 1.5T scanner) at one unique research site but has neither been evaluated with various level of motion, nor transferred to the clinic since then. The goal of this work on one hand was to re-implement this methodology in another vendor platform (Siemens 3T Prisma), revalidate the entire approach including a reproducibility study in volunteers but also to evaluate the performance of the approach with different levels of motion and two different preparations (PASL and PCASL) prior transfer to the clinic.Material and Methods
The new 3D-GRASE-BLADE sequence (3DGB) with both PCASL and PASL preparation were compared to 3DGC in volunteers with increasing levels of motion. The total scan time about 5 minutes for each sequence 5 volunteers have been scanned with both 3DGB and 3DGC, PASL and PCASL, and 18 patients with 3DGB only aged between 50±23.2 years using the following parameters TR: 4600ms, TE: 13.9ms, FOV: 192x192, Matrix size: 96x96, slice thickness: 5.0mm, Number of Blades=8, Number of partitions=16, 5 repetitions, Labelling Duration: 1500ms, Post labelling delay: 3600ms. Anatomical information was acquired with whole-brain T1-weighted 3D MP2RAGE sequence for T1 quantification; M0 maps were also calculated to enable absolute quantified perfusion comparison between techniques in any brain territories of interest.
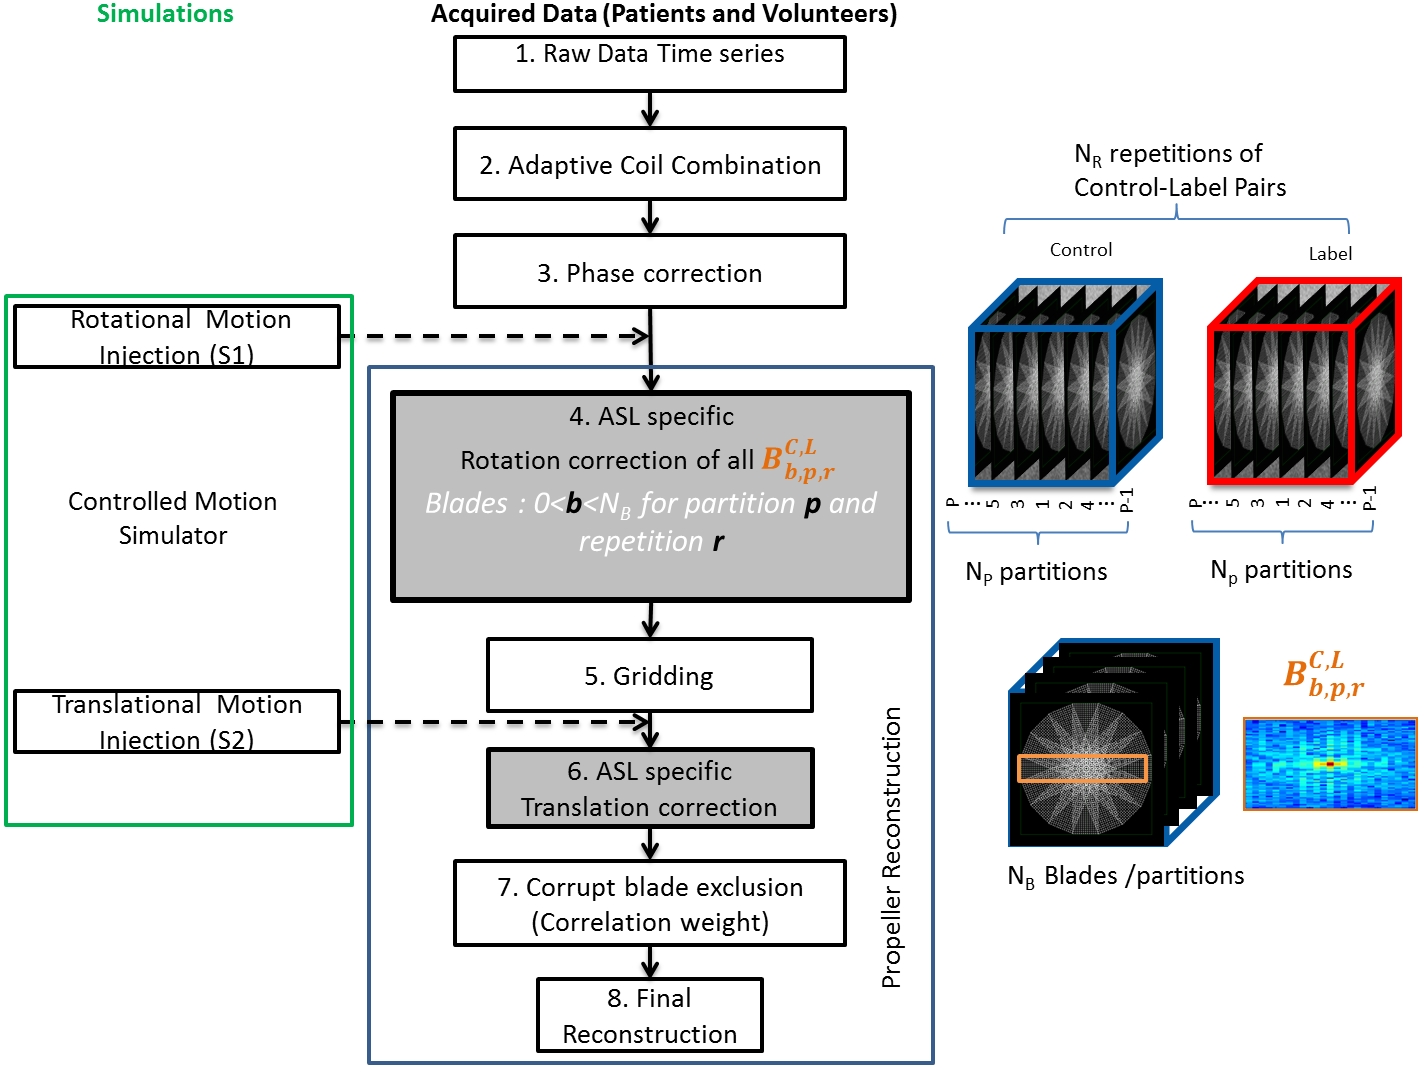
Image reconstruction embedded with self-referenced custom rigid motion correction algorithm based on [2] was developed in MATLAB. The whole process of BLADE data reconstruction and motion correction is shown as a flow diagram in figure 1. Mean cerebral blood flow (CBF) maps across time points were calculated [3] by subtracting Label/Control image pairs. Using FSL extracted mean CBF of white matter (GM) and grey matter (WM) and GM/WM ratio was calculated as an indication for contrast to Noise ratio (CNR).
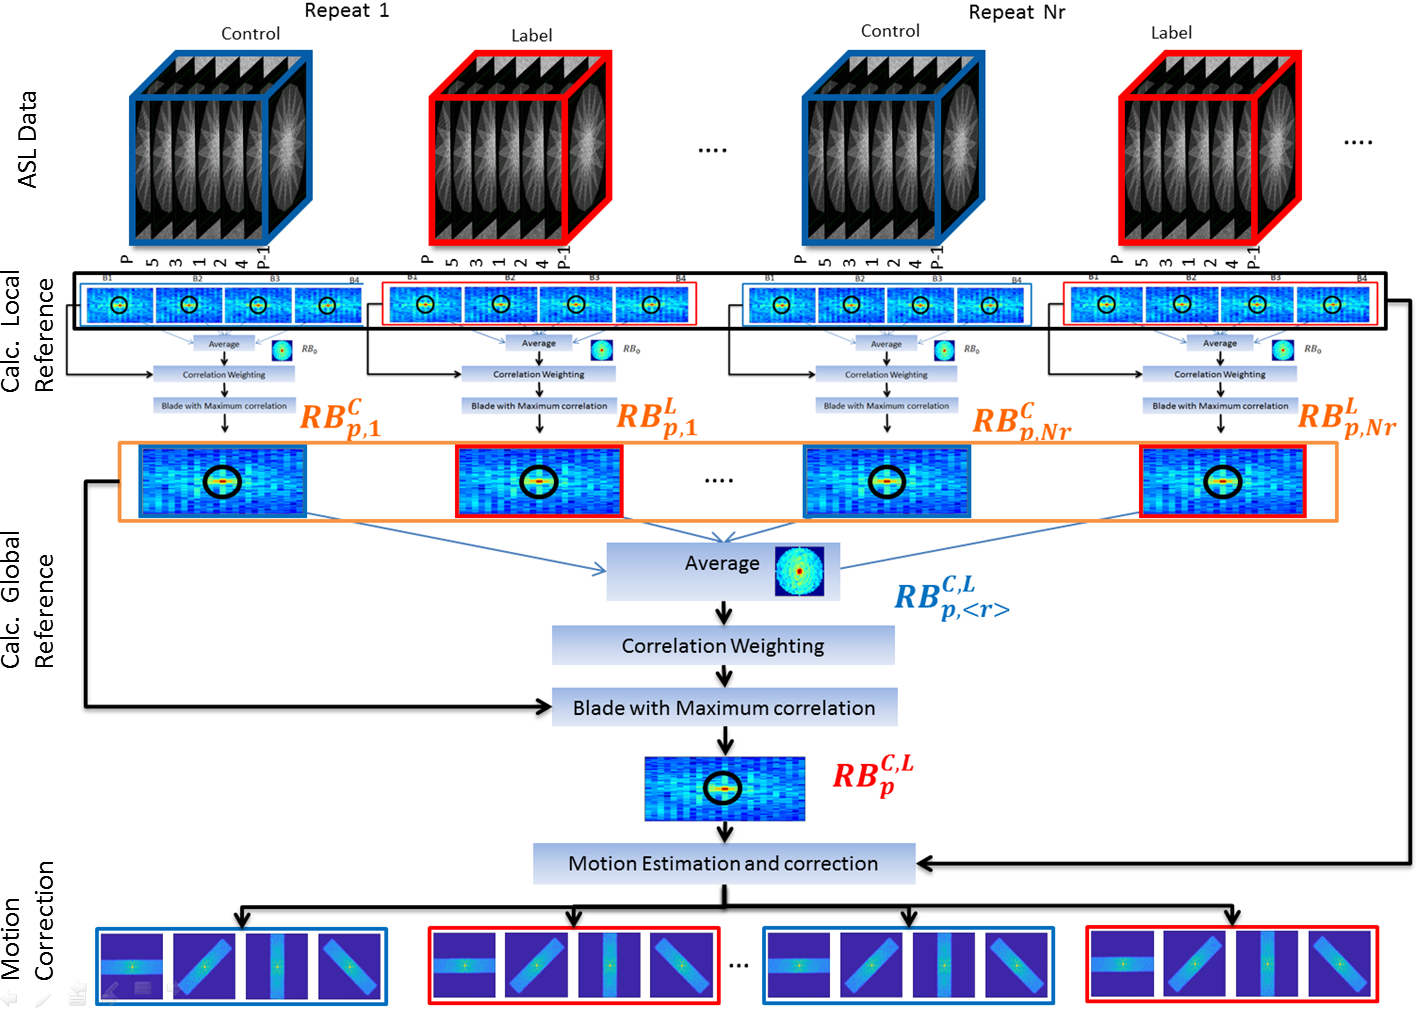
To evaluate the robustness of the technique, simulations (figure 1) are used to generate controlled, known type motion injected into motion freer data obtained in volunteers. Indeed, the efficiency of the ASL specific motion correction approach based on to nullify the subtraction error by aligning all the images of a given partition across time series to a single global reference for that given partition as shown in figure 2. The virtual motion was injected into k-space and image space data separately and the two approaches were evaluated.
Results
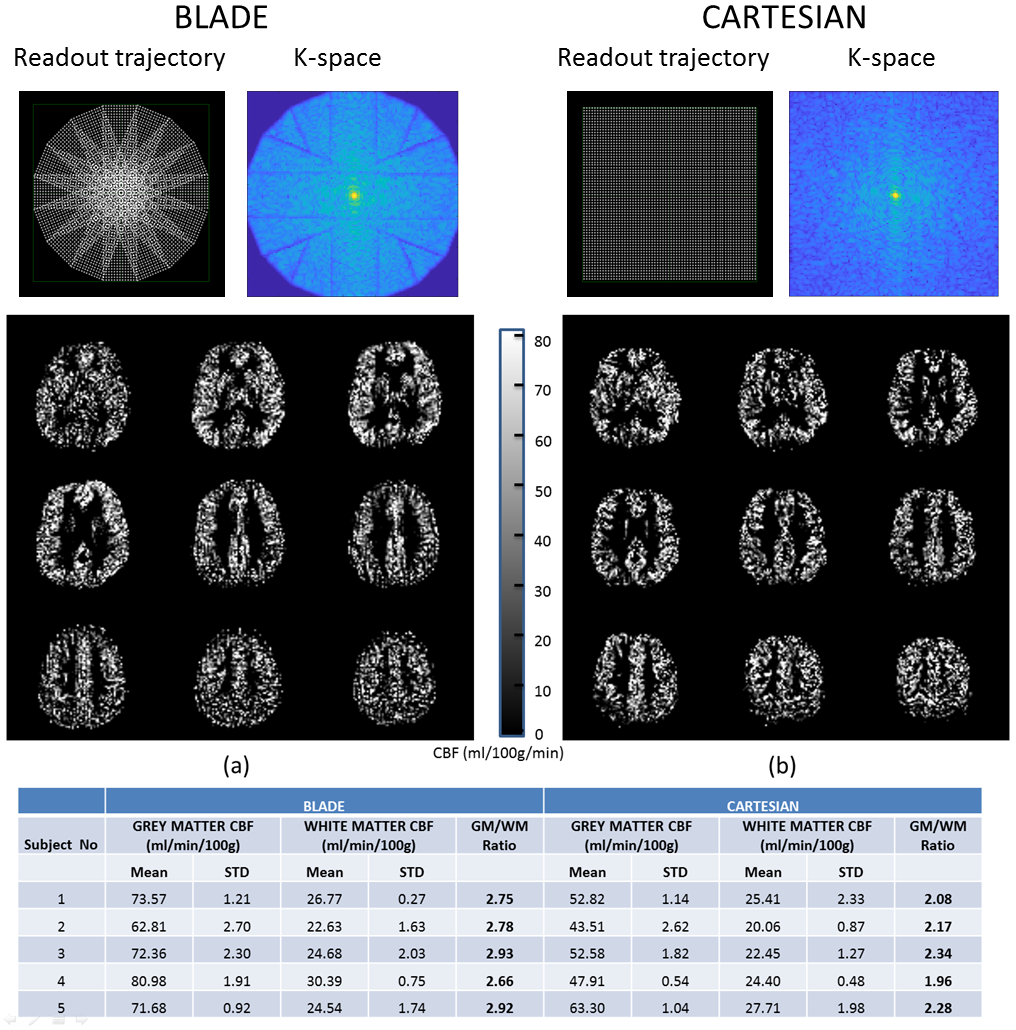
Regional mean CBF values are tabulated for all the volunteers (table fig.3), the average GM/WM ratio was 2.8±0.10 for 3DGB and 2.16±0.13for 3DGC i.e. confirming the higher CNR offered by Blade technique. Visual comparisons of CBF maps points to much clearly visible anatomical structures in case of BLADE than the Cartesian (figure 3).
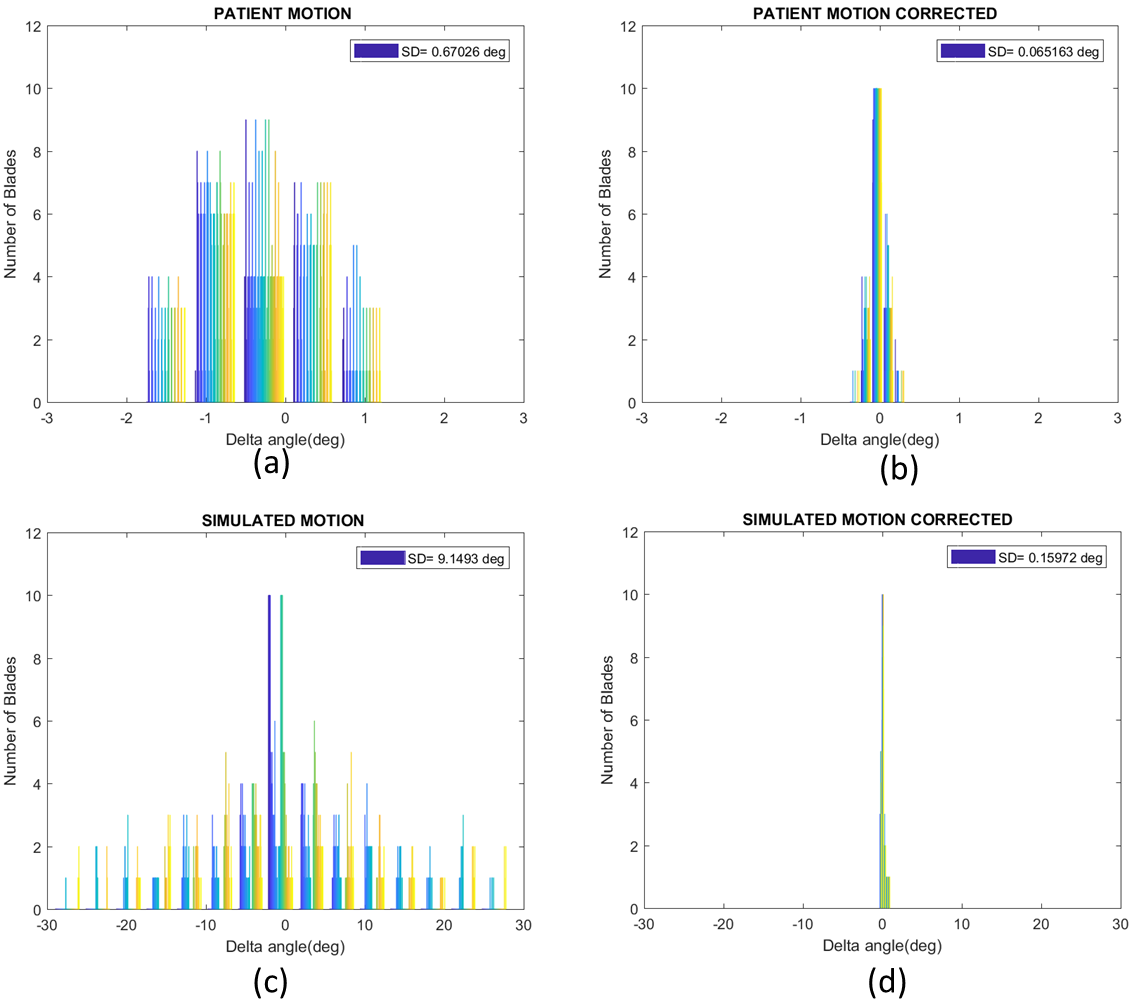
The delta angle refers to the patient rigid motion occurred with respect to reference axis of the scanner. Among our 18 patients maximum motion amplitude of 6° rotational motion was measured with respect to reference axis. Distribution of motion and correction angles obtained in one patient is shown in figure (4) (a) and (b) as well as the non-uniformly distributed simulated motion angles across blades in (c) and the corrected values in (d).
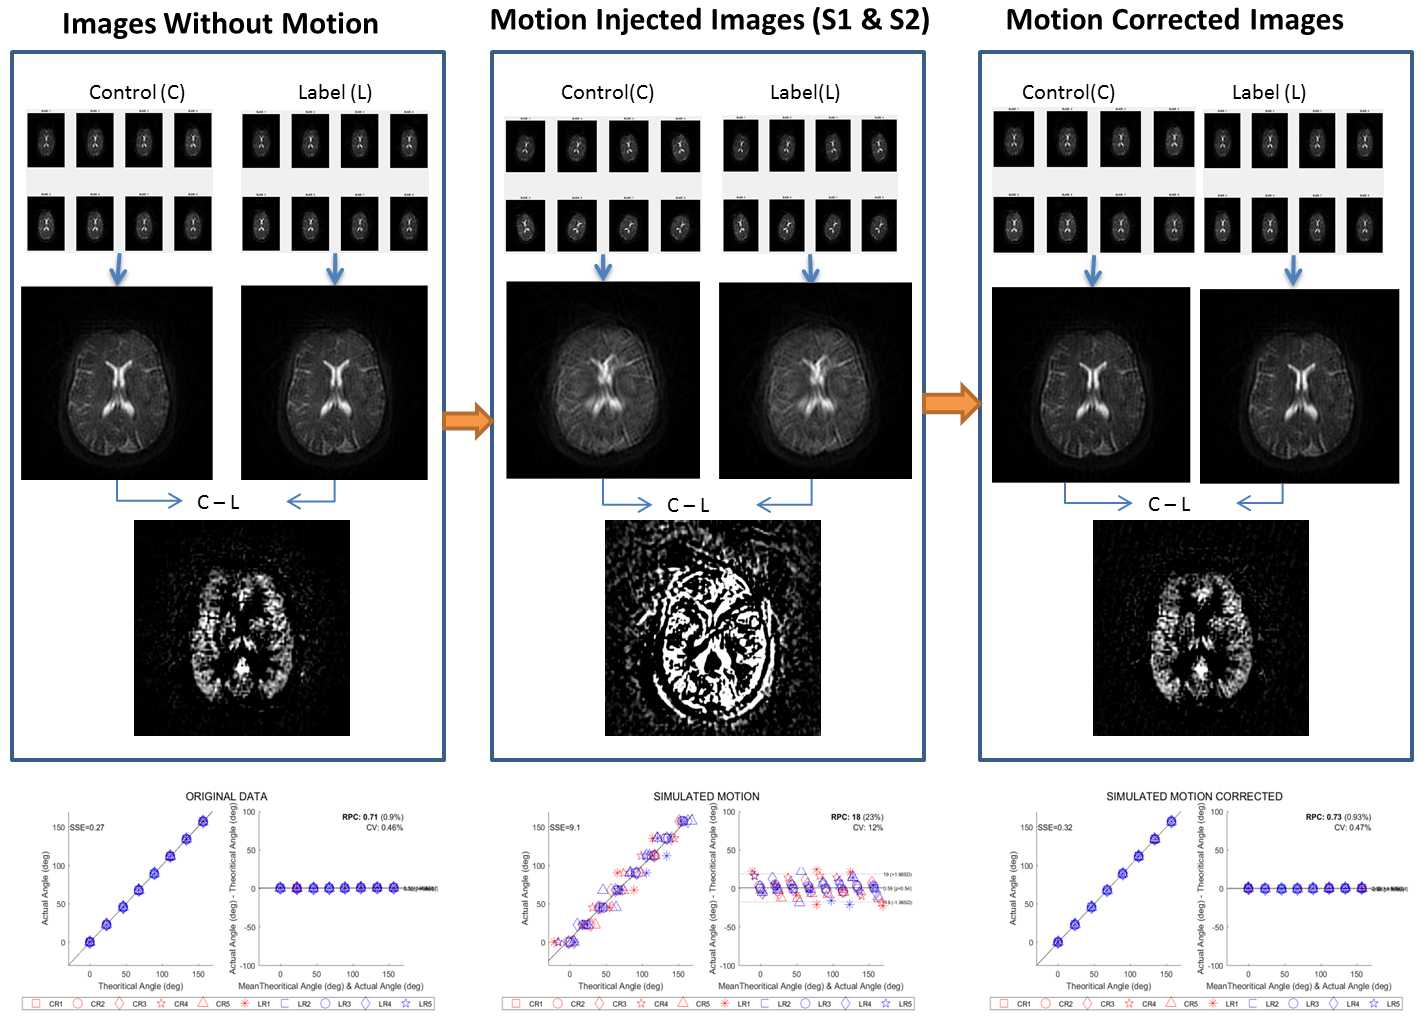
Simulation example demonstrated in figure 5.The moderate motion (5±2.8°) injected into acquired data without any subject motion (delta= 0.25±0.18°), and corrected by our technique with the accuracy of 0.16±0.15° Bland atman Maps were plotted visualize the distribution. The mean residual standard deviation of delta angle was ~0.45° in real patient than and in our simulated QC experiment which always demonstrated a robust accuracy of delta<0.2degrees.
Discussion
The strength of this acquisition and reconstruction technique are in its wide range of in-plane motion correction capabilities and reduction of through plane blurring, a highly suitable feature for low resolution imaging with longitudinal acquisition strategies susceptible to patient motion such as ASL. The simulations do validate the efficiency of the technique for any range of through plane motion. The higher mean residual standard deviation of delta angle obtained in real patient compared to our simulated QC experiment are most probably signing out-plane translational and rotational motion components, that cannot be compensated using the current approach.Conclusion
Further work should consider motion correction in the z direction (Through plane) to be able to handle the complete patient motion observed in patients.Acknowledgements
No acknowledgement found.References
1. Tan, H., Hoge, W. S., Hamilton, C. A., Günther, M. & Kraft, R. A. 3D GRASE PROPELLER: Improved image acquisition technique for arterial spin labeling perfusion imaging. Magn. Reson. Med. 66, 168–173 (2011).
2. J. G. Pipe, “Motion correction with PROPELLER MRI: Application to head motion and free-breathing cardiac imaging,” Magn. Reson. Med., vol. 42, no. 5, pp. 963–969, 1999.
3. D. C. Alsop et al., “Recommended implementation of arterial spin-labeled Perfusion mri for clinical applications: A consensus of the ISMRM Perfusion Study group and the European consortium for ASL in dementia,” Magn. Reson. Med., vol. 73, no. 1, pp. 102–116, 2015
Figures