4431
Non-contact measurement of head movements inside a 7 T Scanner using a 16-channel field camera1SPMIC, University of Nottingham, Nottingham, United Kingdom
Synopsis
The extra-cranial magnetic field changes due to changes in head position have been measured in a 7T scanner using a 16-channel field camera and used to estimate the head movements. A partial least squares regression was used to identify the relationship between field changes and head position data that was simultaneously measured using an optical camera. By applying spherical harmonic spatial filtering to the field measurements it was possible to reduce the unwanted effect of chest movement in respiration, and to then predict head position changes with good accuracy. This provides a step forward towards a non-contact motion monitoring technique.
Introduction
Head movement during MRI produces image artefacts resulting from errors in spatial encoding and distortions related to position-dependent field perturbations. A variety of methods for monitoring head position inside the scanner and then using this information to correct image data, prospectively or retrospectively, have been developed1. Some of these methods require the rigid attachment of markers to the head (e.g. Moire Phase Tracking [MPT] marker(s) or NMR probes), while others require modification of the imaging sequence to allow rapid acquisition of navigator information. Here, we evaluate the potential for using measurements of the magnetic field perturbations produced outside the head for monitoring head position inside a 7T MR scanner. This approach could allow contactless motion monitoring without the need for modification of imaging sequences. In experiments on four subjects we used a 16-channel field camera in conjunction with a MPT camera system to simultaneously monitor external field changes and head position and to test the possibility of calculating head position from field measurements.Methods
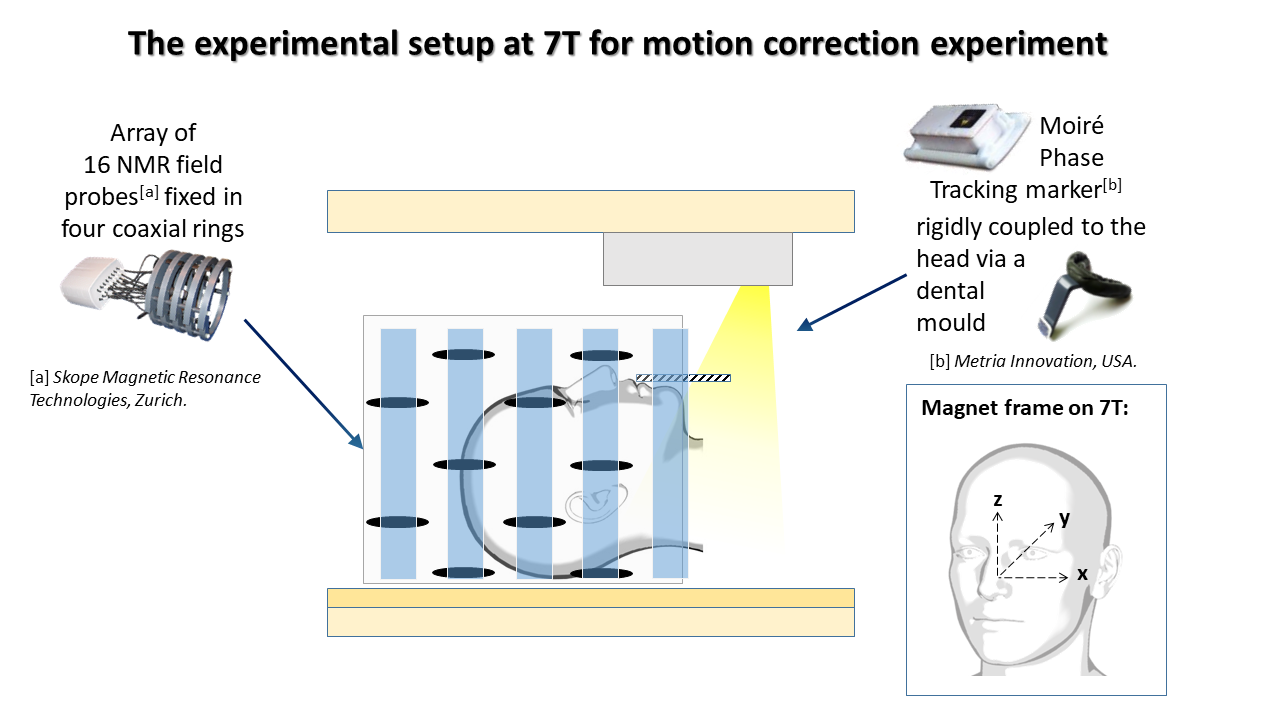
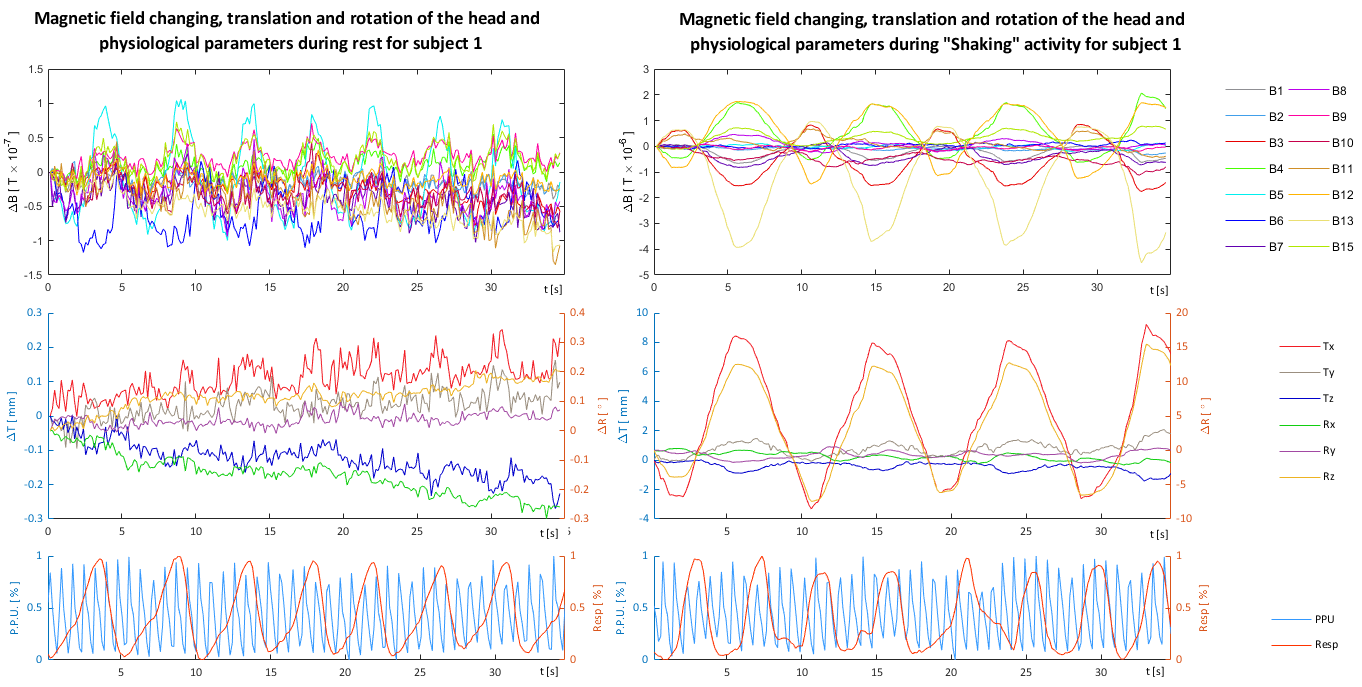
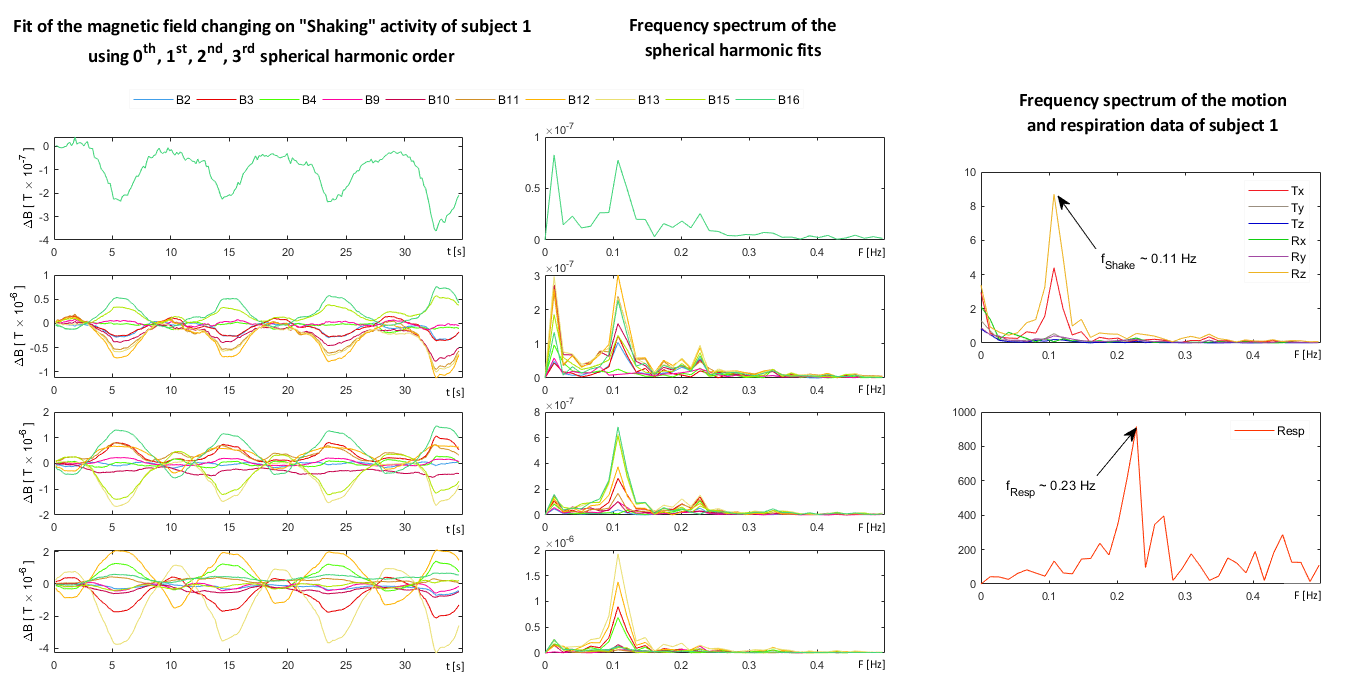
Figure 1 shows the experimental set-up2. 16 field probes were mounted in a set of rings placed inside the head RF coil, while the MPT marker was attached to a dental mould using a small extension so that it was visible to a camera mounted within the scanner bore. Data were recorded from each subject for 60s periods corresponding to four different conditions: rest, head nodding, head shaking and wiggling the feet. During each recording, respiratory and cardiac cycles were also monitored using the scanner’s physiological logging system (peripheral pulse unit and respiratory belt). Data were temporally aligned3 and resampled at a common frequency of 10Hz (the field camera data was acquired at 10 Hz, while the MPT camera and physiological signals have higher acquisition frequencies). Figure 2 shows example data recorded from one subject during 35s-segments of the rest and head shaking conditions. The data from the rest condition show that, as expected, there are fluctuations of the field measurements of order 10-7 T in magnitude which are correlated with the respiratory belt signal. These variations are not evident in the head position parameters reported by the MPT camera as they arise from chest movement. To eliminate these effects, we fitted the field probe measurements at each time point to a series of spherical harmonics up to 3rd order and then reconstituted the signals using only the 2nd and 3rd order harmonics: the field variation due to chest movement is represented by the lower order harmonics and so largely eliminated, while the field variation due to head movement is mainly represented by higher order harmonics (see Fig. 3). We used a partial least squares (PLS) regression to relate the filtered field camera measurements to the changes in head position measured using the MPT camera system. For each data set the PLS coefficients were derived using 75% of the data and the measured coefficients were then used to predict the position changes from the remaining 25% of field camera measurements. The accuracy of the predicted value was evaluated by calculating the Root Mean Squared Error (RMSE) with respect to the MPT-measured parameters, and the ratio of the RMSE with respect to the standard deviation (STD) of the actual position changes.Results
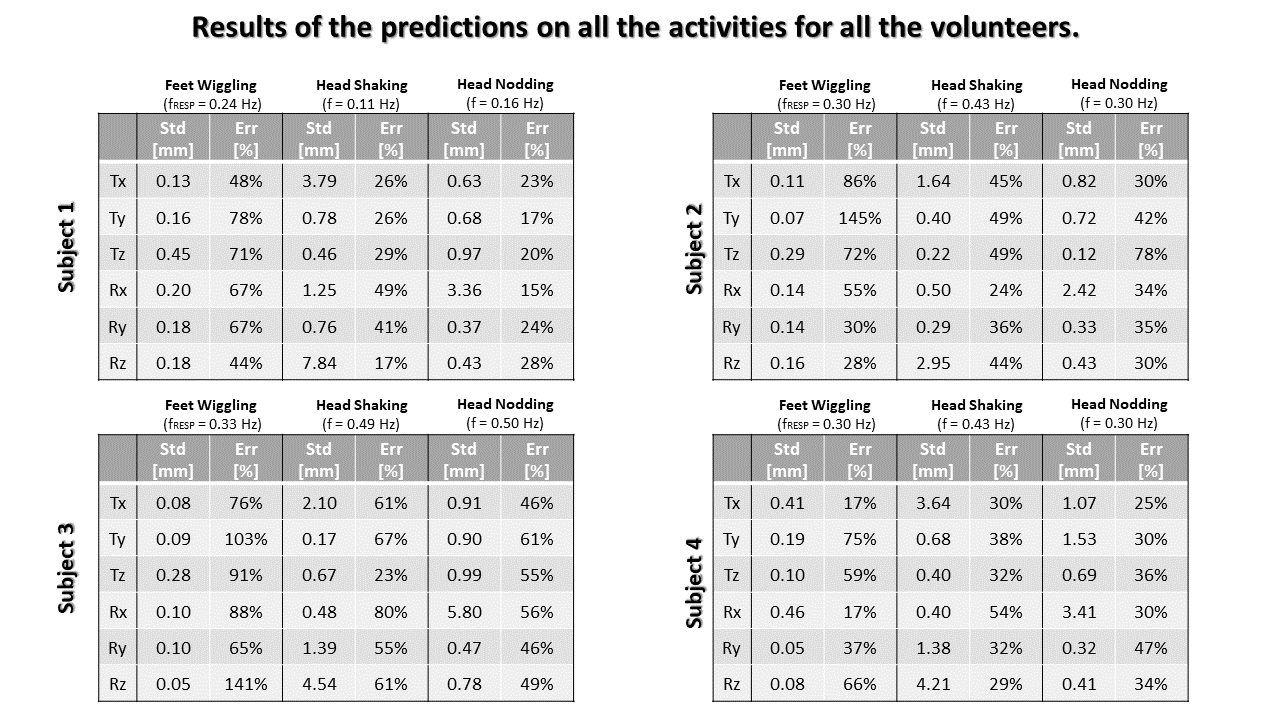
Figure 4 shows the movement parameters predicted by applying the PLS regression method to the field camera measurements in comparison to the actual parameters measured using the MPT camera on one subject for the feet wiggling, shaking and nodding conditions. The RMSE and RMSE/STD values are also reported for each movement parameter (translation in mm and rotation degrees). Figure 5 reports these measures for the three conditions for all four subjects.Discussion
Elimination of the field variations that result from sources other than head movement by spatial filtering improved the predictions of head position using the field camera. The PLS method can identify the relationship between changes in head position and the pattern of field variation from measurements acquired over 45s. The accuracy of prediction of movement parameters is better for the larger movements, and for the dominant movement parameters for each type of motion.Conclusion
Measurements of the changes in the field generated outside the head can be used to estimate head movement parameters with reasonable accuracy. For practical use it would be necessary to learn the relationship between the field variation and head positions, which requires access to simultaneous measures of head position made using another approach (e.g. optical camera or navigators) during the learning phase.Acknowledgements
No acknowledgement found.References
1. Aranovitch A., Haeberlin M., Gross S. et al. Prospective Motion Correction With NMR Markers Using Only Native Sequence Elements. Magn Reson Med. 2018; 79:2046–2056.
2. Bischof L., Smith J., Mougin O. et al. Relating external magnetic field changes to head movement using motion and field cameras. Hawaii,USA ISMRM; 0303. 2017
3. Bortolotti L., Smith J., Spancer G. et al .Test of multiple sensor set-up for head motion characterization during MRI acquisition. Master Thesis, University of Bologna, Italy, 2017
Figures
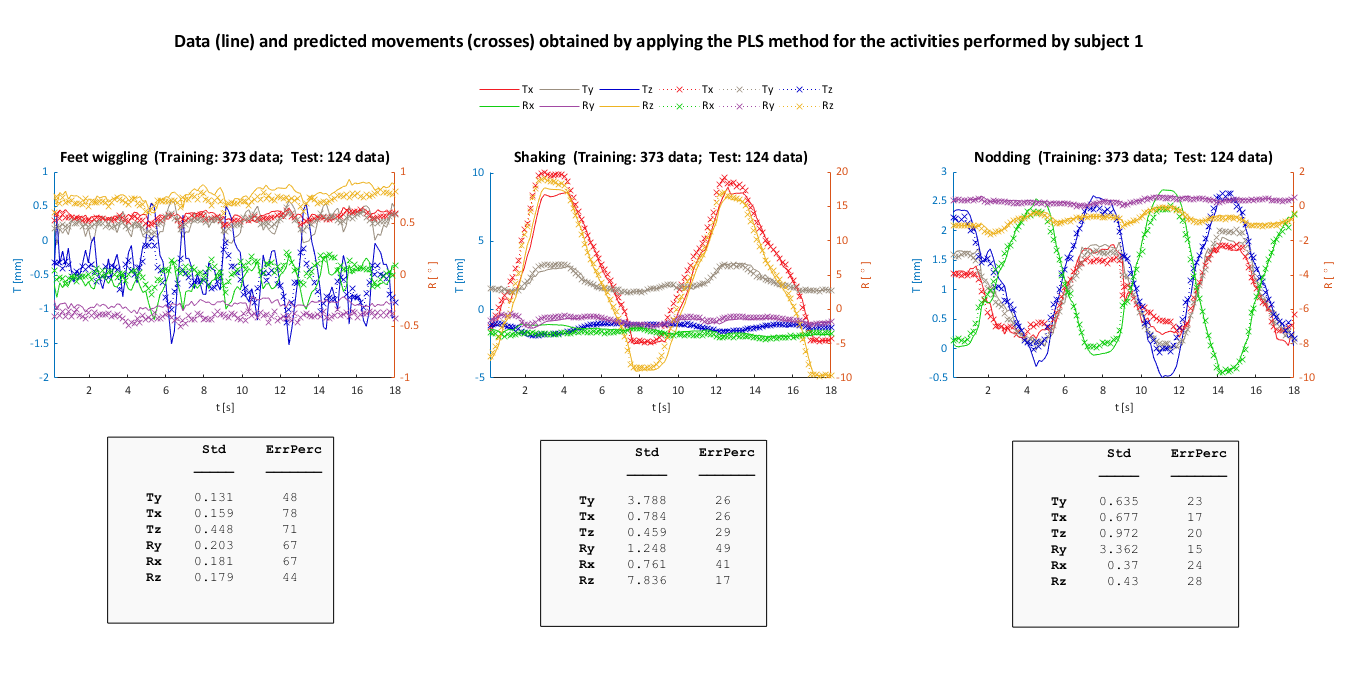
Top: Comparison of the actual movement parameters, measured using the MPT camera (lines) and the parameters predicted on the test field camera data using parameters derived by applying the PLS regression method to the training data.
Bottom: Corresponding values of the standard deviation (Std ) of the movements in mm and degrees and the ratio of the root mean squared error to Std (ErrPerc). Data are shown for subject 1 for foot wiggling (left), head shaking (middle) and head nodding (right).