4425
Motion-corrected and high-resolution anatomically-assisted (MOCHA) reconstruction of arterial spin labelling MRI1Department of Biomedical Engineering, School of Biomedical Engineering and Imaging Sciences, King's College London, London, United Kingdom
Synopsis
A MOtion-Corrected and High-resolution Anatomically-assisted (MOCHA) reconstruction framework is proposed for ASL MRI. The method simultaneously accounts and corrects for rigid motion and partial volume effects (PVE), and reduces noise by guided high-resolution anatomical MR images without any need for segmentation. The proposed method was compared with standard methods and a 3D linear regression (3DLR) correction method using realistic simulations and in-vivo data. Results show that MOCHA outperforms 3DLR not only in preservation of structural and local details, including simulated lesions, but also in PVE correction of deep grey matter structures, often subject to segmentation errors in conventional methods.
Introduction
Quantification of cerebral blood flow (CBF) using ASL MRI is often adversely affected by low signal-to-noise ratio (SNR) and partial volume effect (PVE). PVE is mainly caused by the relatively low-resolution data acquisition and T2-induced blurring in long echo-train 3D-acquisition sequences. Existing PVE correction methods such as linear regression (LR) [1] aim to correct for tissue-fraction effects (caused by low-resolution acquisitions) using partial volume (PV) estimates obtained from anatomical MR images mapped into the low-resolution ASL space. These methods are subject to segmentation and registration errors [2] and often lead to over-smoothing [3]. In this study, we propose a framework for reconstruction of ASL data in the high-resolution space of the anatomical images, corrected simultaneously for motion and PVE, with additional noise reduction, without need for segmentation of the anatomical image.Methods
In the proposed MOtion-Corrected and High-resolution Anatomically-assisted (MOCHA) ASL reconstruction framework, all $$$\small{N}$$$ low-resolution control-label ASL pairs ($$$\small\boldsymbol{C},\boldsymbol{L}$$$) are simultaneously used to reconstruct a single perfusion-weighted image ($$$\small\boldsymbol{x}$$$) using the following penalized weighted least squares minimization: $$$\small\widehat{\boldsymbol{x}}\mathrm{=}{\mathop{\mathrm{argmin}}_{\boldsymbol{x}} \left\{\frac{\mathrm{1}}{\mathrm{2}N}\sum^{\ }_i{{\left\|\boldsymbol{E}{\boldsymbol{M}}_i\boldsymbol{Bx}\mathrm{-}{\left(\boldsymbol{C}\boldsymbol{-}\boldsymbol{L}\right)}_i\right\|}^{\mathrm{2}}_{\boldsymbol{\ }}}\mathrm{+}\beta \sum^{\ }_j{{\left\|{\left(\boldsymbol{Dx}\right)}_j\right\|}^{\mathrm{2}}_{\boldsymbol{\omega }}}\right\}\ }$$$.This method takes all data acquisition processes into account including point-spread-function ($$$\small\boldsymbol{B}$$$), motion ($$$\small\boldsymbol{M}$$$) and MR Fourier encoding matrix ($$$\small\boldsymbol{E}$$$, composed of Fourier bases, coil sensitivity profiles and k-space undersampling masks). Additionally, a quadratic smoothness prior, weighted ($$$\boldsymbol{\omega }$$$) by an anatomical image, is utilized to guide reconstruction of the target high-resolution perfusion image. $$$\small\boldsymbol{D}$$$ is a high-order finite differences, and $$$\beta$$$ is a regularization parameter. MOCHA therefore removes the need for segmentation and downsampling of the anatomical images into ASL space. Using realistic simulations and in-vivo datasets MOCHA was compared with standard reconstruction and 3DLR PVE correction.
Experiments
Six healthy volunteers were scanned on a Siemens 3T mMR scanner using PCASL labelling [3] and 3D-GRASE readout (TR: 4000ms, TE: 17.62ms, FA: 150°, matrix: 64×64×26, resolution: (4mm)3, FOV: 256×256×104 mm turbo-factor: 29, EPI-factor: 31, 2 shots/segments, background suppression, labelling duration: 1500ms, post-labelling delay: 1800ms, 42 repeats). For one volunteer, a high-resolution ASL dataset with double resolution in the partition direction was additionally acquired (parameters unchanged except for 4 shots and double number of repeats to match SNR of the lower-resolution acquisition). Calibration (M0) and T1-weighted images (1.05×1.05×1.1 mm3) were also acquired. For motion transformation estimation, all control and label images were rigidly registered to the calibration scans with the ASL-toolbox [4]. Control-minus-label perfusion-weighted images were then converted into CBF map based on the ASL consensus paper [5]. A realistic simulation was designed to mimic the in-vivo data acquisition process by: i) segmenting the T1-image of a volunteer dataset and assigning CBF values to GM and white matter (WM); ii) introducing translational motion between 42 simulated repeats.Results and Discussion
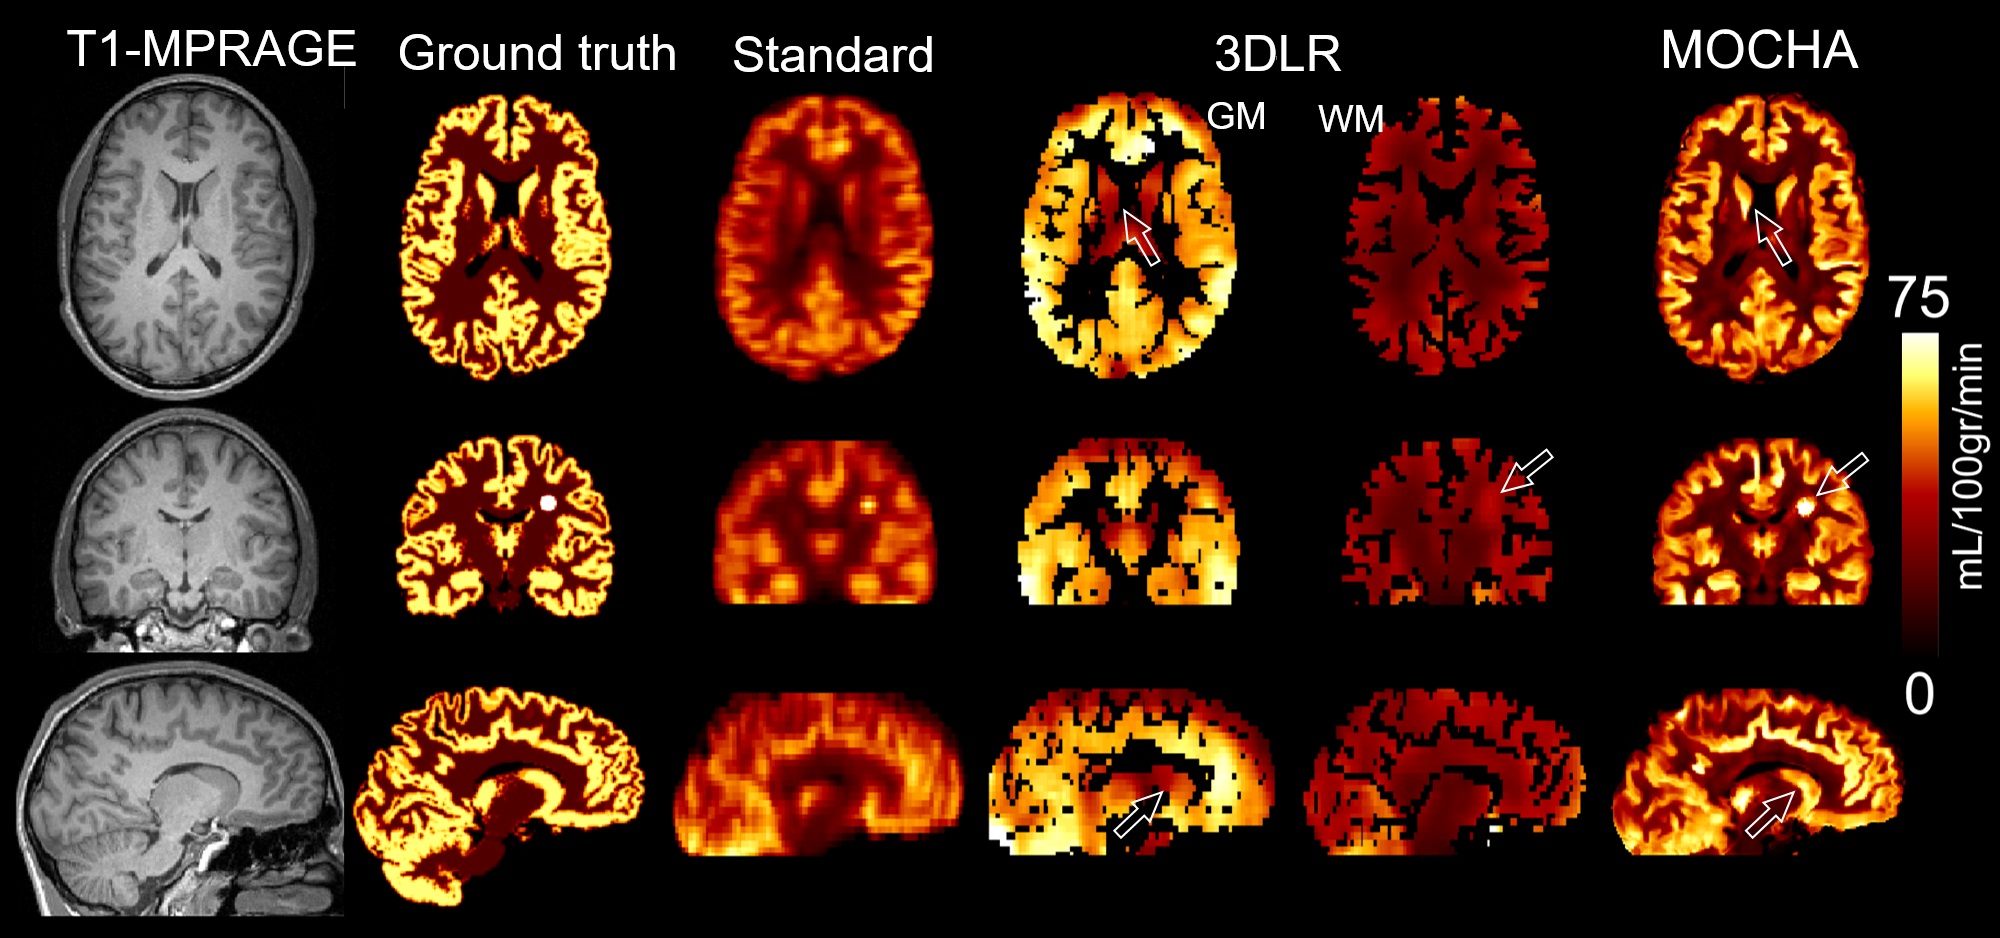
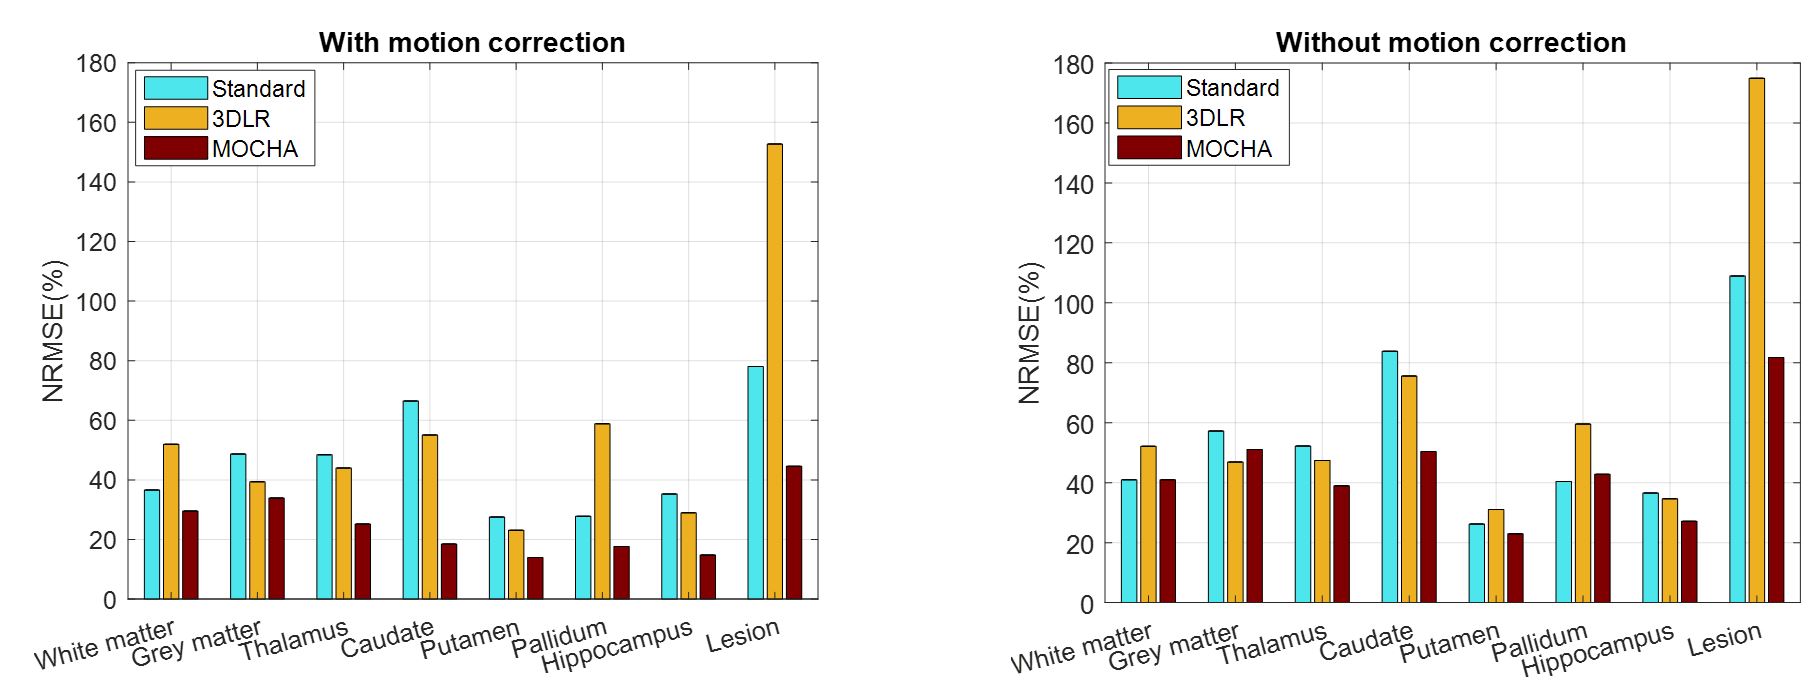
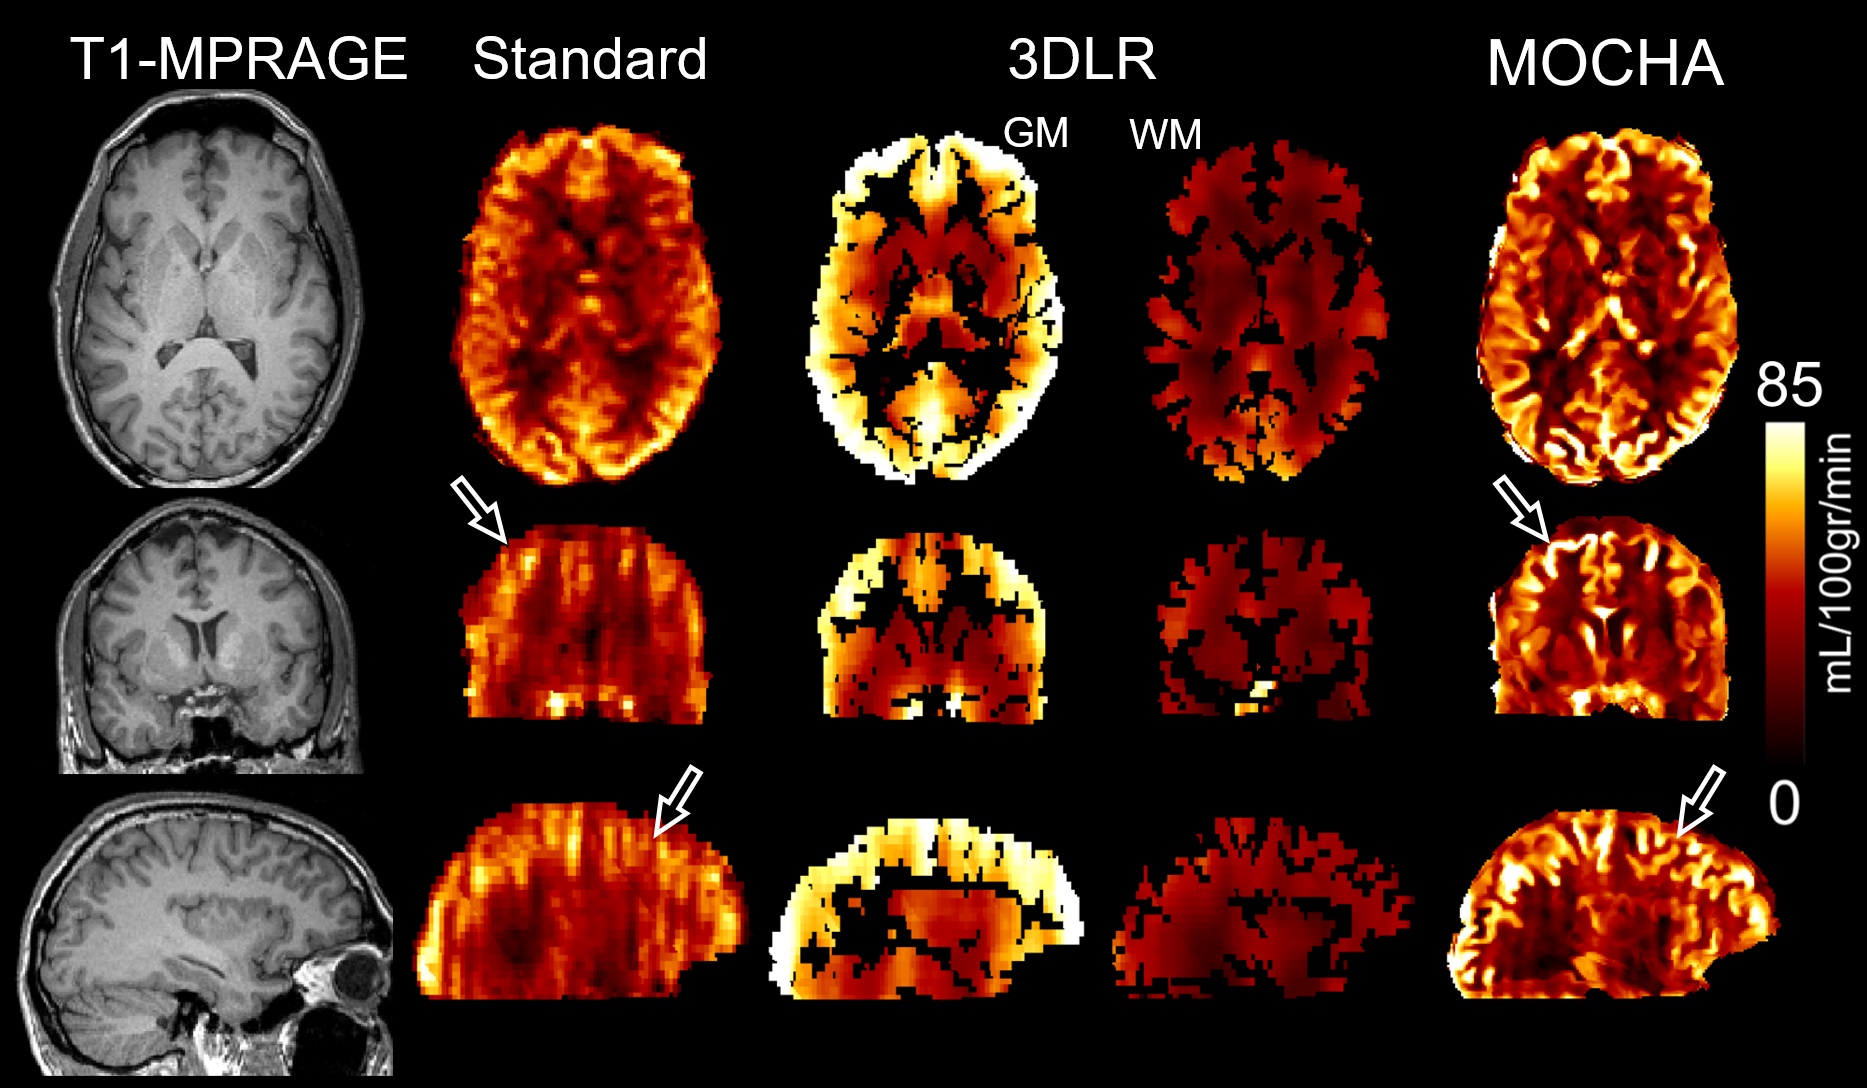
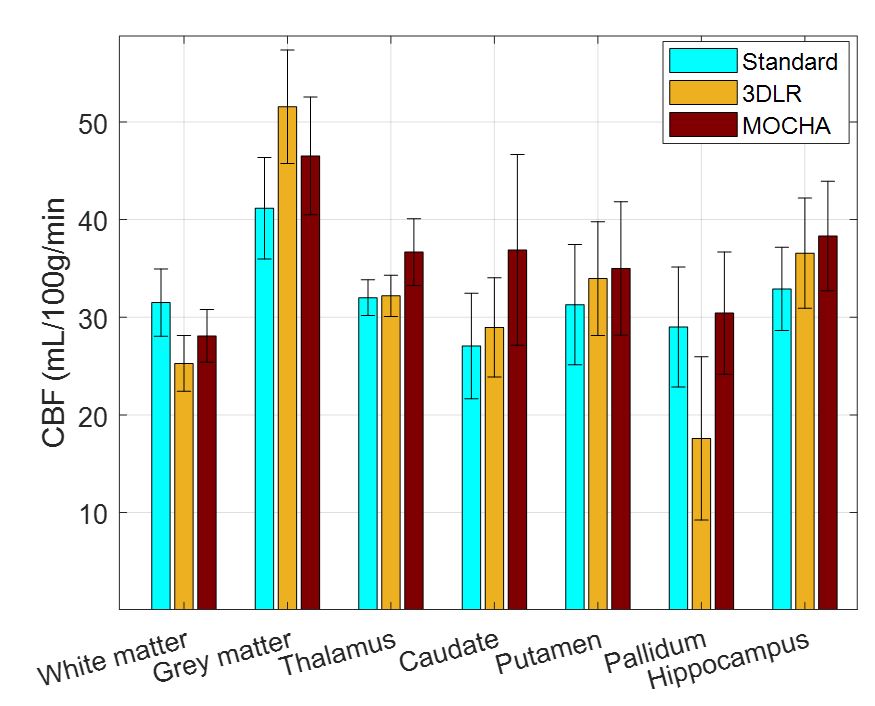
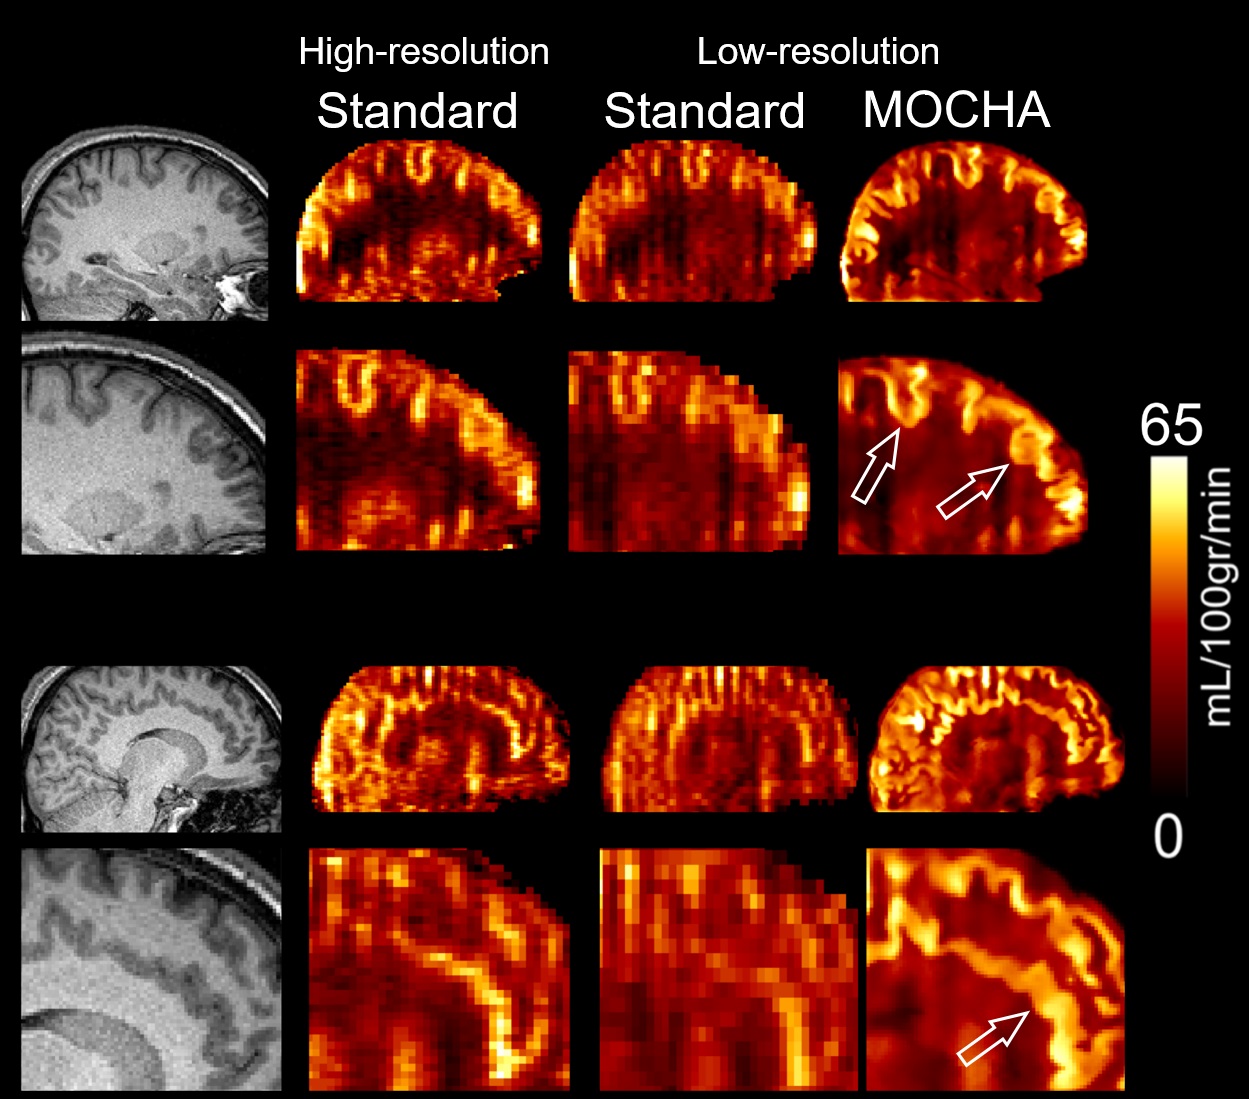
Fig. 1 compares simulation results of the standard, 3DLR and MOCHA methods, all motion corrected. Results shows that the standard reconstruction method notably suffers from PVE and loss of details, whereas the 3DLR method (kernel size of 5×5×5) corrects for PVE in grey matter, with the drawback of smoothing and reduced lesion visibility. In contrast, MOCHA not only corrects for PVE but also improves the resolution of the ASL data and hence recovers local details (see arrows). Normalized-root-mean-squared error (NRMSE) results in Fig. 2 reiterates the need for motion correction: if ignored it adversely affects all methods. Motion-corrected results demonstrate that MOCHA outperforms 3DLR particularly in deep GM structures, often subject to segmentation errors. Fig. 3 compares CBF results for an example subject: MOCHA notably improves apparent resolution. Fig. 4 shows CBF values in different regions of the brain, averaged over all subjects. As shown, 3DLR leads to higher mean CBF values in cortical GM but not deep GM regions. Fig. 5 shows MOCHA's performance on standard resolution data compared to higher-resolution data. MOCHA appears to reliably recover details lost in the lower-resolution standard CBF maps and possibly also allow visualisation of details not clearly visible in the high-resolution standard CBF maps (where acquisition resolution is only improved in the through-plane direction).Conclusions
Our results suggest that the proposed MOCHA ASL reconstruction method improves spatial resolution and anatomical fidelity of CBF maps taking into account motion and PVE. MOCHA has potential to improve the diagnostic confidence and quantification of current ASL protocols in clinical practice and further validation with clinical dataset is planned.
Acknowledgements
This work is supported by the Engineering and Physical Sciences Research Council (EPSRC) under grant EP/M020142/1 and the Welcome EPSRC Centre for Medical Engineering at King’s College London (WT 203148/Z/16/Z). The authors acknowledge financial support from the Department of Health via the National Institute for Health Research (NIHR) comprehensive Biomedical Research Centre award to Guy's & St Thomas' NHS Foundation Trust in partnership with King's College London and King’s College Hospital NHS Foundation Trust.References
[1] Asllani, I, et al, Magn Reson Med 60, 1362-1371, 2008. [2] Oliver, R.A. et al, Proc. Intl. Soc. Mag. Reson. Med, p. 3727. 2013 [3] Wang, Z, et al, Magn Reson Imaging 26, 261-269, 2008. [4] Wang, Z, et al, Magn Reson Imaging 30, 1409-1415, 2012. [5] Alsop, D.C, et al. Magn Reson Med 73, 102-116, 2015.Figures