4420
T1 Mapping at 7T Using a Novel Inversion-Recovery Look-Locker 3D-EPI Sequence1German Center for Neurodegenerative Diseases (DZNE), Bonn, Germany, 2High-Field MR Center, Max Planck Institute for Biological Cybernetics, Tübingen, Germany, 3Department for Biomedical Magnetic Resonance, University of Tuebingen, Tübingen, Germany, 4Department of Physics and Astronomy, University of Bonn, Bonn, Germany
Synopsis
We propose a novel Inversion-Recovery Look-Locker 3D-EPI sequence for rapid T1 mapping. The inherent SNR benefit of a 3D acquisition, segmentation along both phase encode directions and a turbofactor introduced to reduce the number of required inversions can be traded freely for acquisition speed, SNR, resolution and geometric distortions. Aside from quantitative validation, two high-resolution T1 mapping applications are demonstrated at 7T: whole-brain with minimal distortions, and reduced field-of-view with geometric distortions matched to corresponding fMRI data. The results show high T1 accuracy for several turbofactor and flip angle combinations compared to a single-slice inversion-recovery 2D-EPI reference.
Introduction
Accurate $$$T_1$$$ maps can be computed from multiple inversion time (TI) images acquired along the actual ($$$T_1$$$) or effective ($$$T_1^\ast$$$) inversion recovery (IR) curve. Compared to slice-selective approaches, 3D acquisitions do not suffer from slice-profile effects and inherently provide more SNR at high resolutions. Tailored at high SNR efficiency1, we propose a novel Inversion-Recovery Look-Locker2 3D-EPI3 (IR-LL-3D-EPI) sequence with adaptable EPI- and turbofactor. Driving this sequence in a steady-state mode, we show that high $$$T_1$$$ accuracy can be obtained at 7T in short scan times with minimal geometric distortions. Alternatively, data can be acquired in an fMRI-distortion-matched space4.
Methods
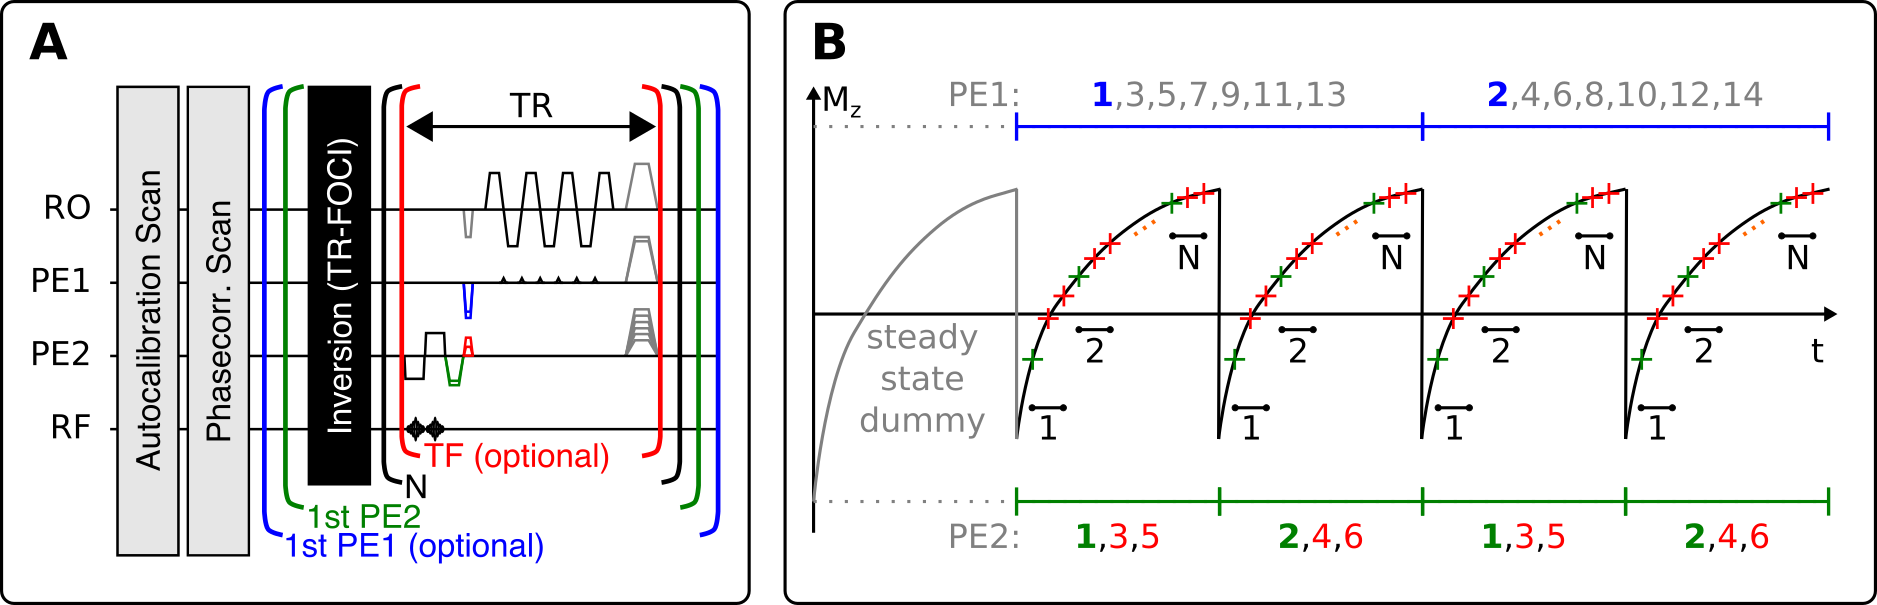
A custom 3D-EPI sequence segmented along both phase encode directions (PE1=blip/PE2=slab direction)5 was modified to play out TR-FOCI inversion pulses6 according to the loop order depicted in Fig. 1A. Avoiding additional recovery periods, a steady-state Look-Locker signal1,7 is assumed (Fig. 1B). Per default, the same $$$k$$$-space trajectory is acquired $$$N$$$ times across the IR curve for $$$N$$$ different IR contrasts. A turbofactor, $$$TF\geq 1$$$, is introduced to acquire as many PE2 indices per inversion as fit into the desired TI spacing, $$$\Delta TI=TF\cdot TR$$$. Thus, only $$$s\cdot\lceil N_{PE2}/TF\rceil$$$ inversions are required, where $$$s\geq 1$$$ denotes the number of PE1-segments to reduce the EPI-factor (and therefore distortions). The $$$N_{PE2}$$$ PE2 indices are looped linearly according to TF such that the signal envelope is as smooth as possible and non-periodic. The effective TI of the $$$n$$$th image is given by $$$TI_n = n\Delta TI +TR\cdot(TF-1)/2$$$, where $$$n=0,\dots,N-1$$$.
Three experiments were conducted with one subject with informed consent and approval by the local ethics committee on a 7T research scanner (Siemens Healthineers) using a 32/1(Rx/Tx)-channel coil (Nova Medical):
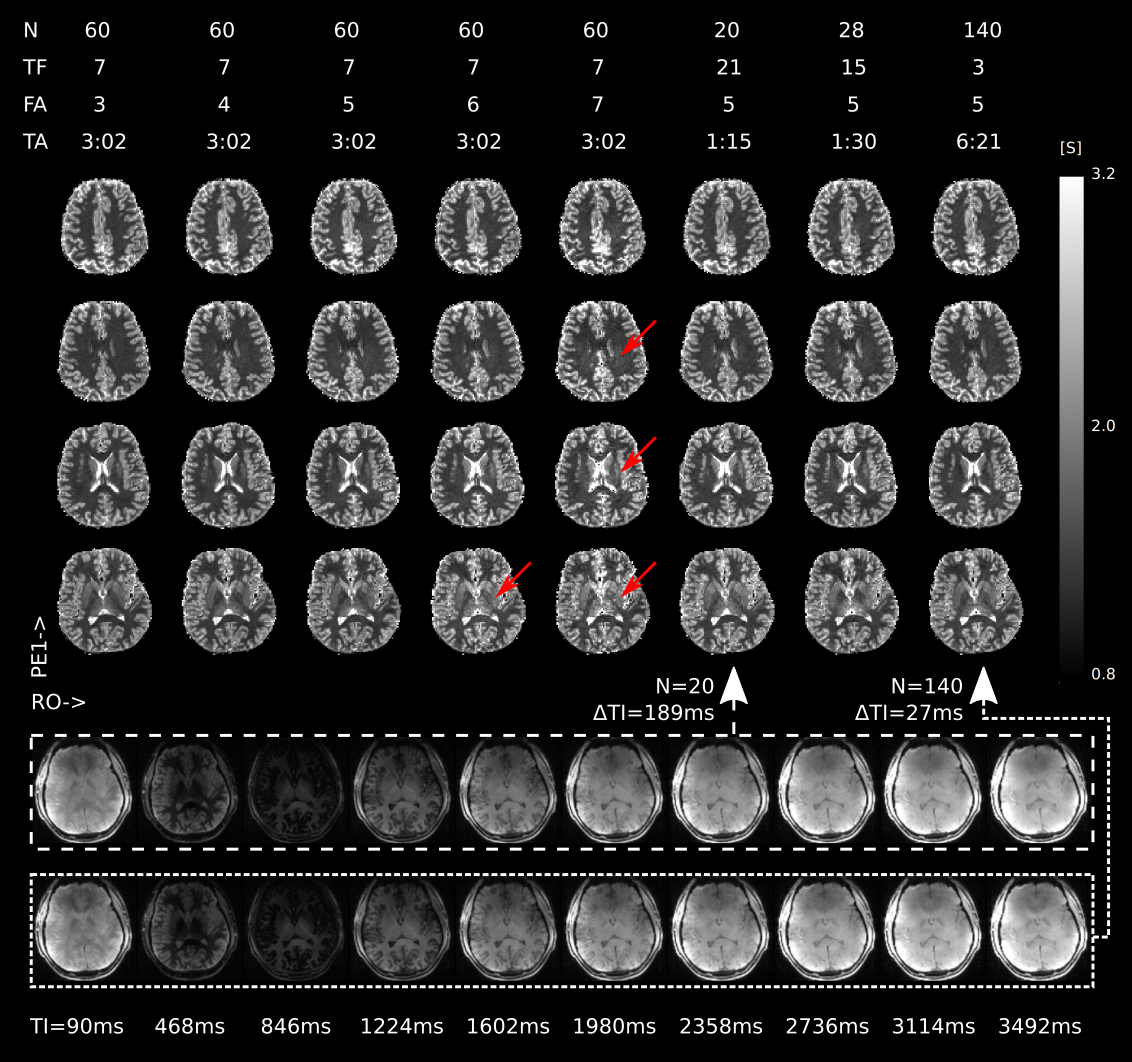
- Low-resolution whole-brain (axial, 2mm isotropic, matrix=$$$96\times 96\times 72$$$, s=4, TE/TR=4ms/9ms) repeated with varying nominal flip angle (FA) and varying TF ($$$N\cdot TF=420=\text{const}$$$).
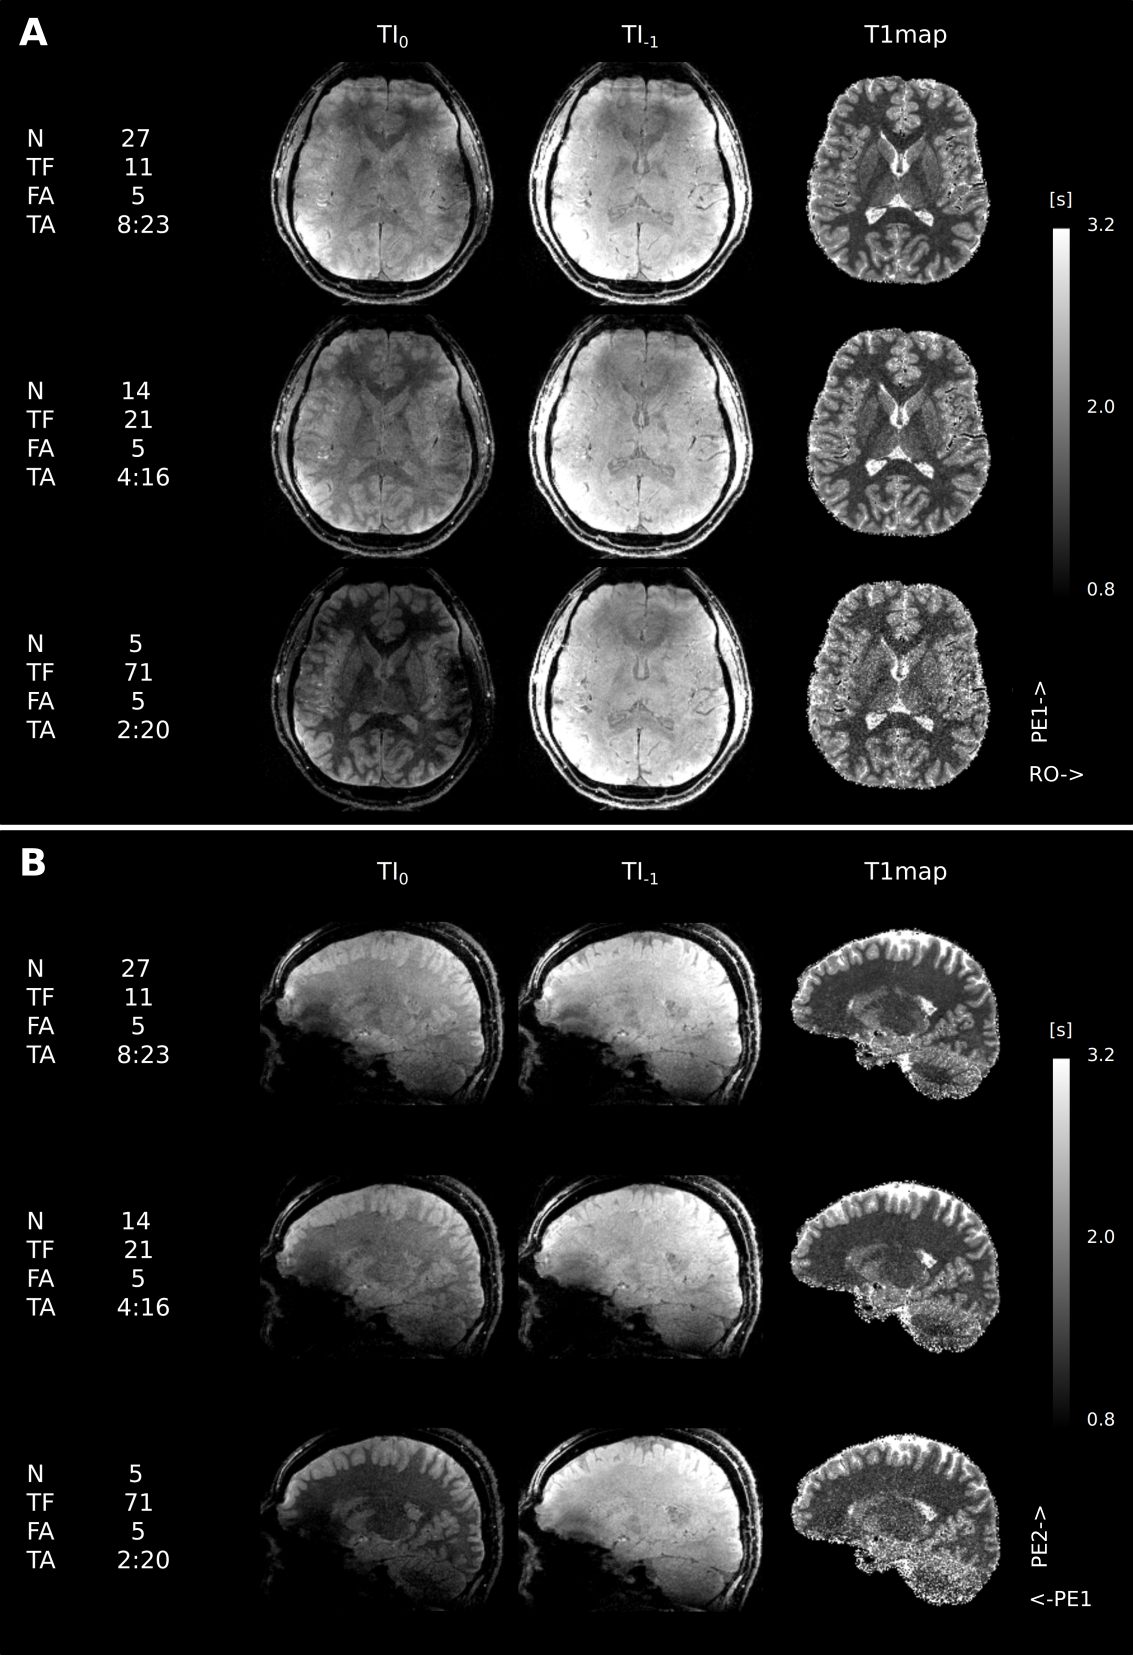
- High-resolution whole-brain (axial, 1mm isotropic, matrix=$$$192\times 192\times 144$$$, s=9, TE/TR=5.5ms/13ms, FA=$$$5^\circ$$$) repeated with varying TF.
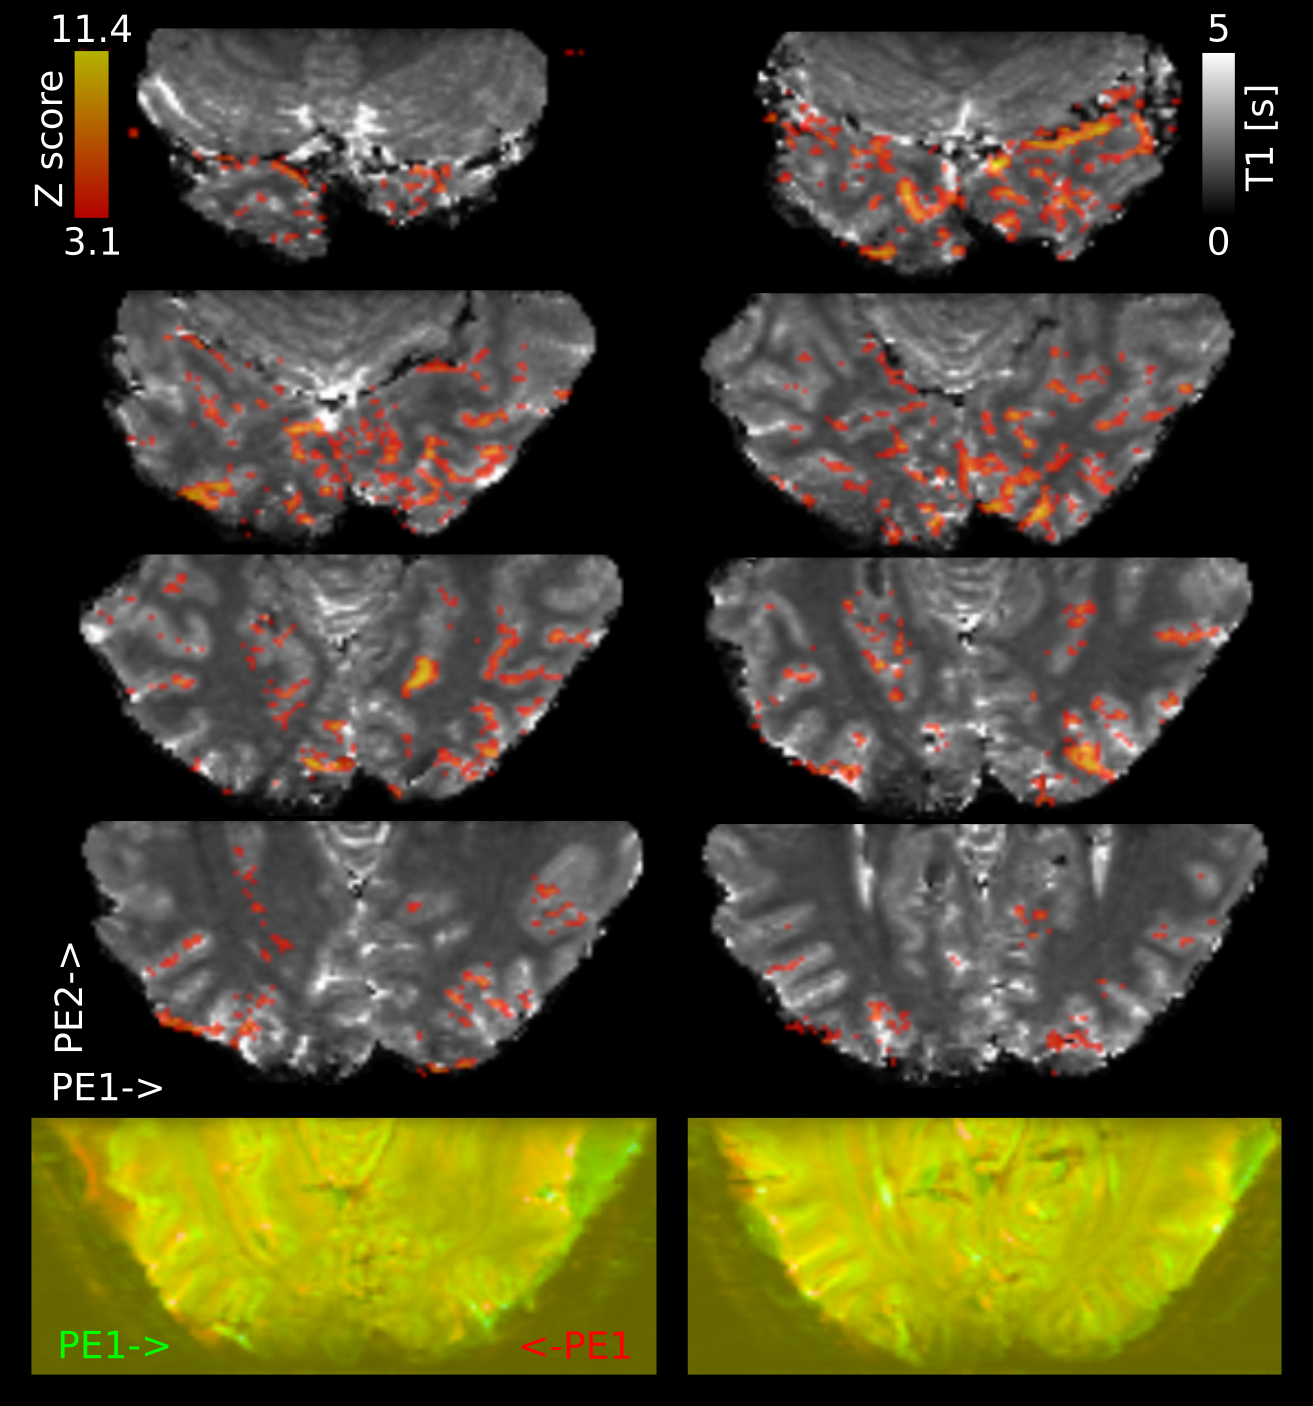
- High-resolution fMRI (1mm isotropic 3D-EPI, coronal slab across occipital lobe, matrix=$$$192\times 192\times 60$$$, PE1 partial Fourier 6/8, s=1, TE/TRvol=22ms/3.4s, FA=$$$15^\circ$$$, PE1=left-right) and IR-LL-3D-EPI with identical resolution and distortions (TE/TR=19ms/55ms, FA=$$$12^\circ$$$, s=1, TF=1, TA=3:50min). A flickering checkerboard stimulus was presented during the 6min fMRI scan (repeating 16.5s off- and on-intervals). FMRI analysis was performed using FSL's8 FEAT.
All 3D-EPI scans used GRAPPA $$$R=3\times 1$$$. A 3DREAM9 B1 map was acquired for FA correction (2mm isotropic, matrix=$$$96\times 96\times 72$$$, segmentation=8, TA=1:10min). As a reference, a single-slice IR-2D-EPI sequence was acquired (2mm isotropic, 10s recovery period, 11 linearly increasing TIs between 120 and 2200ms, 5 exponentially increasing TIs up to 6000ms).
At ultra-high fields, a three-parameter $$$T_1$$$ fit may be preferable over assuming a fixed inversion efficiency (e.g. MP2RAGE10 $$$T_1$$$ estimation). Therefore, the IR-LL-3D-EPI data was fit to
$$S(TI) = S_\infty[1-(1+E)\cdot\exp(-TI/T_1^{\ast})]$$
using non-linear least squares following phase-based correction of the magnitude sign. Here, $$$E$$$ denotes the inversion efficiency and $$$S_\infty$$$ is the steady-state signal. $$$T_1$$$ was then calculated using
$$T_1=[1/T_1^{\ast}+\ln(\cos(\gamma FA))/TR]^{-1}\quad ,$$
where the FA scaling factor, $$$\gamma$$$, was obtained from the 3DREAM B1 map interpolated to the target 3D-EPI (affine-based using FSL's FLIRT) and smoothed by a 8mm gaussian filter. Common regions-of-interest (ROI) were defined as the intersection of all WM/GM/CSF ROIs obtained by tissue segmentation (FSL's FAST applied on all $$$T_1$$$ maps).
Results and Discussion
All 2mm example $$$T_1$$$ maps displayed in Fig. 2 appear equivalent except for FA=$$$6-7^\circ$$$, where
the logarithmic FA correction starts to overestimate $$$T_1$$$. TF seems to have a
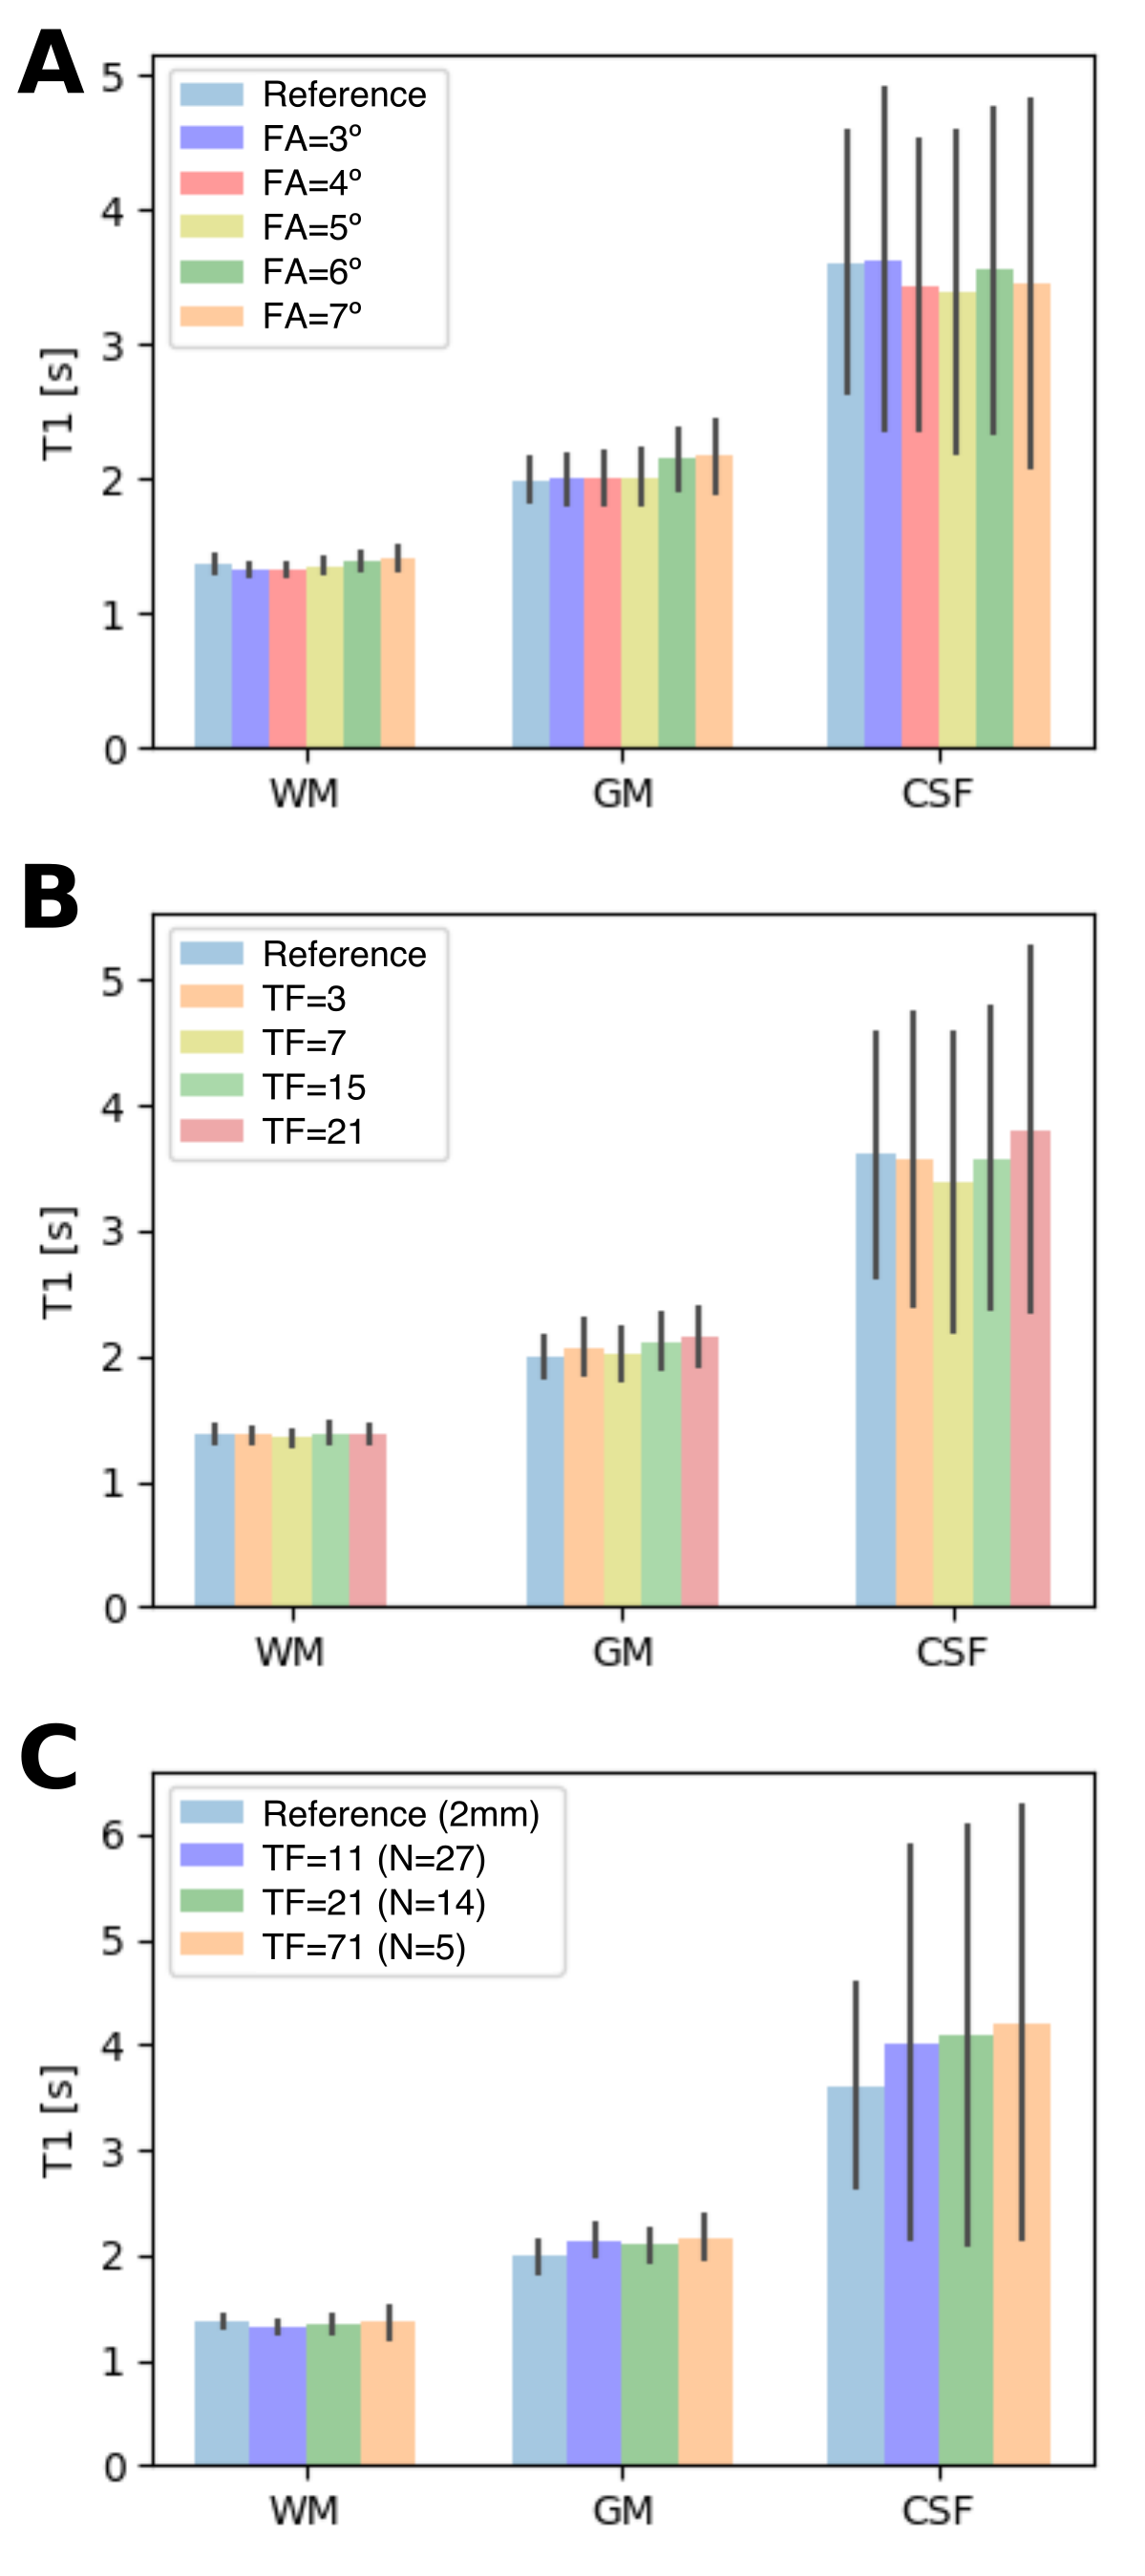
minor impact. The ROI analysis for varying FA (Fig. 3A), TF (Fig. 3B) and the 1mm scans (Fig. 3C) confirm that the proposed method is accurate throughout turbofactors, particularly for small FAs. Fig. 4 displays example slices of each high-resolution $$$T_1$$$ map along with the respective first (TI0) and last (TI-1) image out of $$$N=27,14,5$$$. They demonstrate that noise propagation to the $$$T_1$$$ map strongly depends on $$$N$$$, and hence total acquisition time. If subject motion is an issue, multiple short scans (e.g. $$$TF=71$$$) can be averaged. Otherwise, $$$TF$$$ can be reduced and $$$N$$$ increased. Second, PE1-segmentation artifacts above the sinus do not propagate to the $$$T_1$$$ maps. Third, PE2-point-spread-function effects are barely visible and do not propagate to the $$$T_1$$$ map. Fig. 5 demonstrates distortion-matched $$$T_1$$$ mapping for high-resolution fMRI.Conclusion
We have proposed a novel Inversion-Recovery Look-Locker 3D-EPI sequence and demonstrated its speed and accuracy at 7T. The sequence can be interpreted as a 3D extension of IR-LL-2D-EPI at steady-state7 or as hybrid 3D steady-state IR-snaptshot-FLASH11,12. Both the EPI-factor and the turbofactor are well-suited to optimize SNR efficiency13, while increasing turbofactors may additionally help to reduce motion artifacts (patients, elderly or young subjects). Future investigations will include 2D-CAIPIRINHA parallel imaging14 and applications at 3T.Acknowledgements
No acknowledgement found.References
1 Crawley AP, Henkelman RM. A comparison of one‐shot and recovery methods in T1 imaging. Magnetic Resonance in Medicine 1988;7(1):23–34. https://doi.org/10.1002/mrm.1910070104.
2 Look DC, Locker DR. Time saving in measurement of NMR and EPR relaxation times. Review of Scientific Instruments 1970;41(2):250–1. https://doi.org/10.1063/1.1684482.
3 Poser BA, Koopmans PJ, Witzel T, Wald LL, Barth M. Three dimensional echo-planar imaging at 7 Tesla. NeuroImage 2010;51(1):261–6. https://doi.org/10.1016/j.neuroimage.2010.01.108.
4 Kashyap S, Ivanov D, Havlicek M, Poser BA, Uludağ K. Impact of acquisition and analysis strategies on cortical depth-dependent fMRI. NeuroImage 2018;168(May 2017):332–44. https://doi.org/10.1016/j.neuroimage.2017.05.022.
5 Stirnberg R, Acosta-Cabronero J, Poser BA, Stöcker T. 2D-segmented, multi-TE 3D-EPI for high-resolution R2* and quantitative susceptibility mapping at 7 Tesla. In: Proc Intl Soc Mag Reson Med 23, 2015.
6 Hurley AC, Al-Radaideh A, Bai L, Aickelin U, Coxon R, Glover P et al. Tailored RF pulse for magnetization inversion at ultrahigh field. Magnetic Resonance in Medicine 2010;63(1):51–8. https://doi.org/10.1002/mrm.22167.
7 Shin W, Gu H, Yang Y. Fast high-resolution T1 mapping using inversion - Recovery Look-Locker echo-planar imaging at steady state: Optimization for accuracy and reliability. Magnetic Resonance in Medicine 2009;61(4):899–906. https://doi.org/10.1002/mrm.21836.
8 Jenkinson M, Beckmann CF, Behrens TEJ, Woolrich MW, Smith SM. Fsl. NeuroImage 2012;62(2):782–90. https://doi.org/10.1016/j.neuroimage.2011.09.015.
9 Brenner D, Stirnberg R, Pracht ED, Stöcker T. Rapid MRI System Calibration using 3DREAM. Proceedings of the International Society for Magnetic Resonance in Medicine 2015;23:0491.
10 Marques JP, Kober T, Krueger G, Zwaag W van der, Van de Moortele P-F, Gruetter R. MP2RAGE, a self bias-field corrected sequence for improved segmentation and T1-mapping at high field. NeuroImage 2010;49(2):1271–81. https://doi.org/10.1016/j.neuroimage.2009.10.002.
11 Deichmann R, Haase a. Quantification of T 1 values by SNAPSHOT-FLASH NMR imaging. Journal of Magnetic Resonance (1969) 1992;612:608–12. https://doi.org/10.1016/0022-2364(92)90347-A.
12 Henderson E, McKinnon G, Lee TY, Rutt BK. A fast 3D look-locker method for volumetric T1mapping. Magnetic Resonance Imaging 1999;17(8):1163–71. https://doi.org/10.1016/S0730-725X(99)00025-9.
13 Deichmann R, Adolf H, Nöth U, Kuchenbrod E, Schwarzbauer C, Haase A. Calculation of signal intensities in hybrid sequences for fast NMR imaging. Magnetic Resonance in Medicine 1995;34(3):481–9. https://doi.org/10.1002/mrm.1910340328.
14 Breuer FA, Blaimer M, Mueller MF, Seiberlich N, Heidemann RM, Griswold MA et al. Controlled aliasing in volumetric parallel imaging (2D CAIPIRINHA). Magnetic Resonance in Medicine 2006;55(3):549–56. https://doi.org/10.1002/mrm.20787.
Figures