4418
Fast and whole-brain T2* mapping using QUTE-EPI at 7T1Institute of Neuroscience and Medicine 4, INM-4, Forschungszentrum Juelich, Juelich, Germany, 2Institute of Neuroscience and Medicine 11, INM-11, JARA, Forschungszentrum Juelich, Juelich, Germany, 3JARA - BRAIN - Translational Medicine, Aachen, Germany, 4Department of Neurology, RWTH Aachen University, Aachen, Germany
Synopsis
Quantification of T2* relaxation time is of great interest as knowledge of it can be used for clinical diagnosis or optimisation of MR imaging parameters. A typical approach to quantify T2* is to acquire multi-echo data. Although this approach is effective, it still requires a substantial acquisition time for whole-brain coverage. This work aims to employ quantitative echo-planar imaging (QUTE-EPI) at 7T for fast and whole-brain T2* mapping. The performance of QUTE-EPI was directly compared to that of a conventional multi-echo gradient-echo sequence (MEGE). The estimated T2* values were quantitatively analysed for the regions of grey matter (GM) and white matter (WM).
Introduction
Accurate knowledge of tissue parameters is essential for the optimisation of pulse sequences as well as for understanding of important physiological information. For instance, during the brain activation, the change of the ratio of oxyhaemoglobin to deoxyhaemoglobin leads to the regional T2* changes, which can be used for the detection of blood-oxygenation-level–dependent (BOLD) signals. Therefore, information regarding T2* relaxation times helps to choose the optimal TE for fMRI.1 It has been also demonstrated that the knowledge of T2* relaxation time helps to distinguish between normal and abnormal tissues.2,3 The recent development of ultra-high field MR systems is generating widespread interest in the use of T2* mapping in research as well as clinical applications. Ultra-high field offers inherently higher SNR and CNR and thus, is also of great interest for T2* mapping. However, the shorter T2* at ultra-high fields requires a faster multi-echo gradient-echo imaging sequence providing a shorter TE interval. For this purpose, an EPI-based sequence, the so called quantitative echo-planar imaging (QUTE-EPI), was developed and presented in a previous work, which was shown to provide robust and fast T2* mapping at 3T.4,5 This work aims to validate the use of QUTE-EPI for whole-brain T2* mapping at 7T. Here, the performance of the method was directly compared with that of a conventional multi-echo gradient-echo sequence (MEGE).Methods
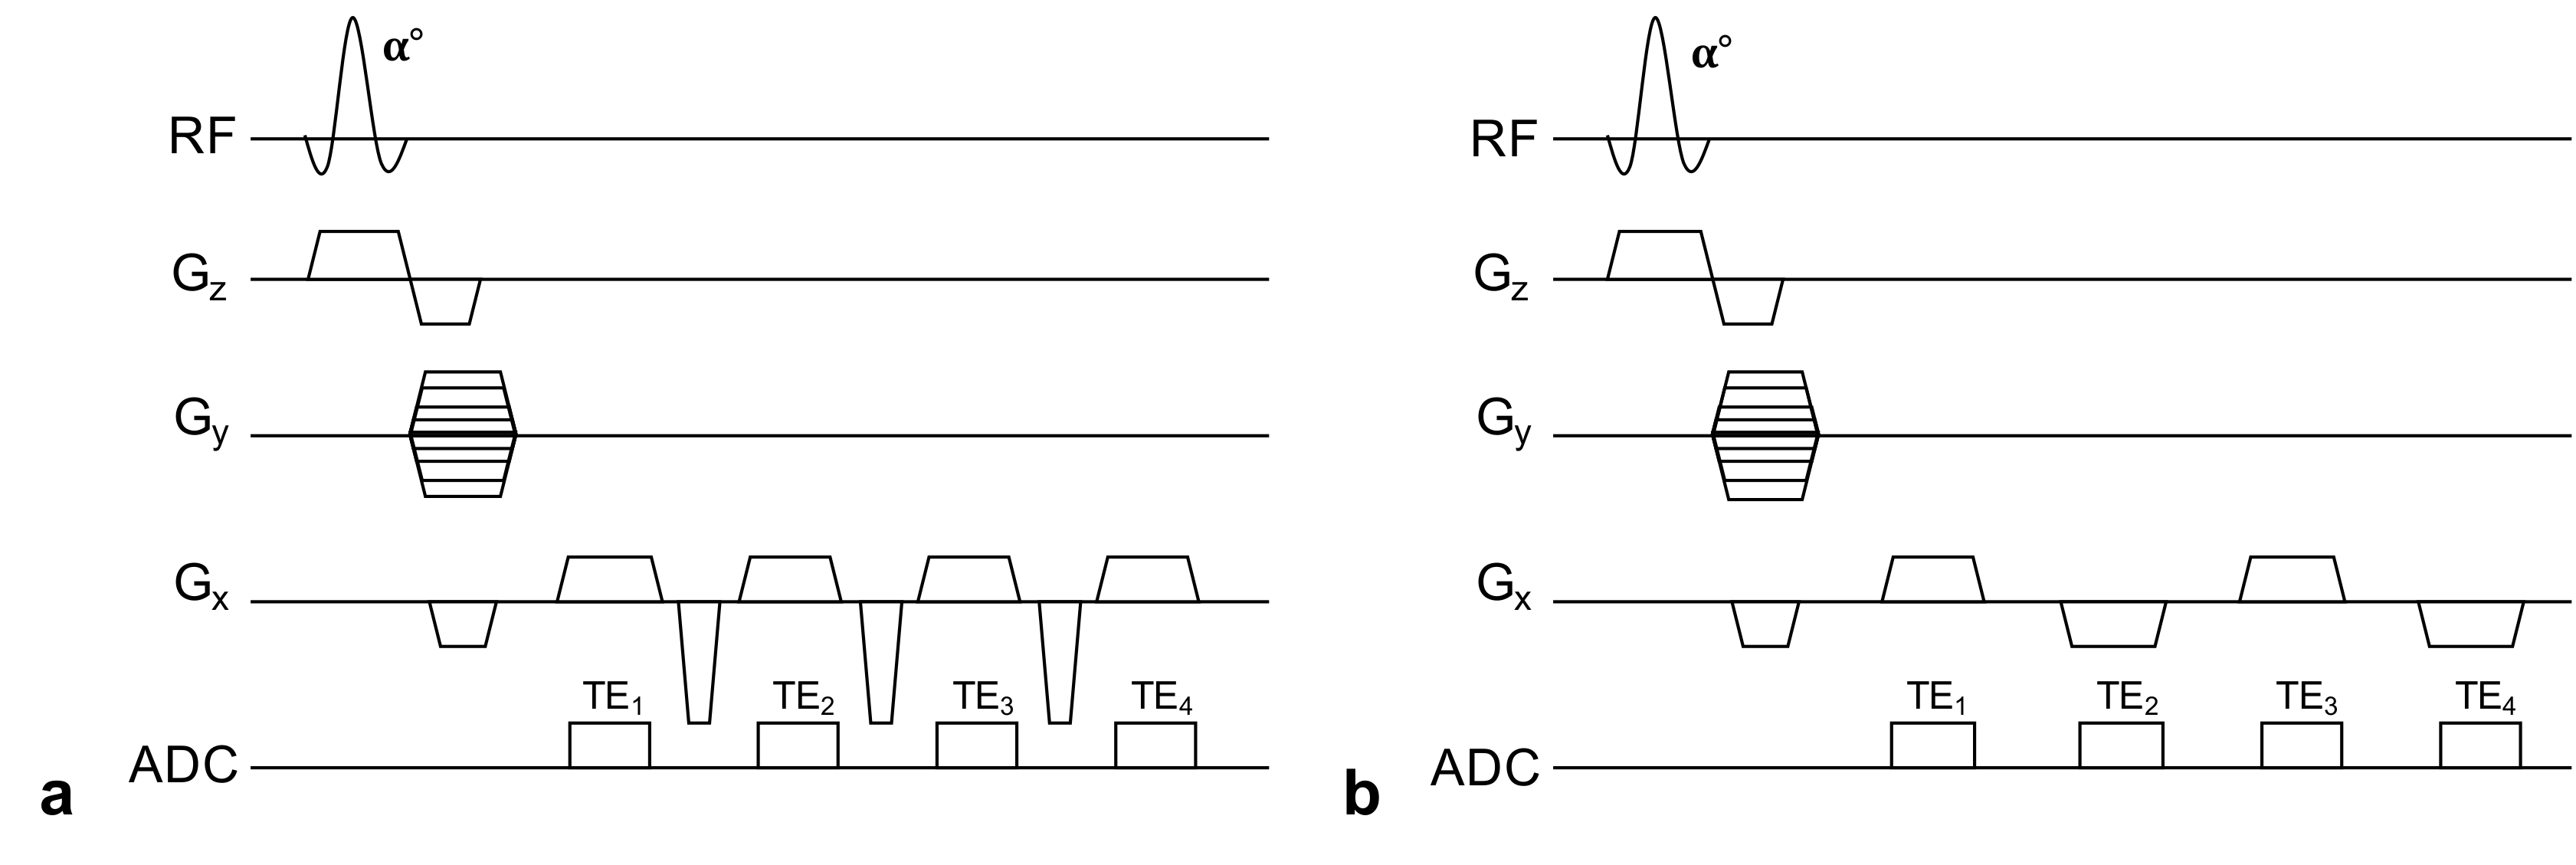
The sequence diagrams of MEGE and QUTE-EPI are presented in Fig. 1. As shown in the figure, QUTE-EPI acquires multi-echo data with bipolar readout gradients in the same way as an EPI readout, whilst conventional multi-echo sequence acquires data with only positive readout gradients.
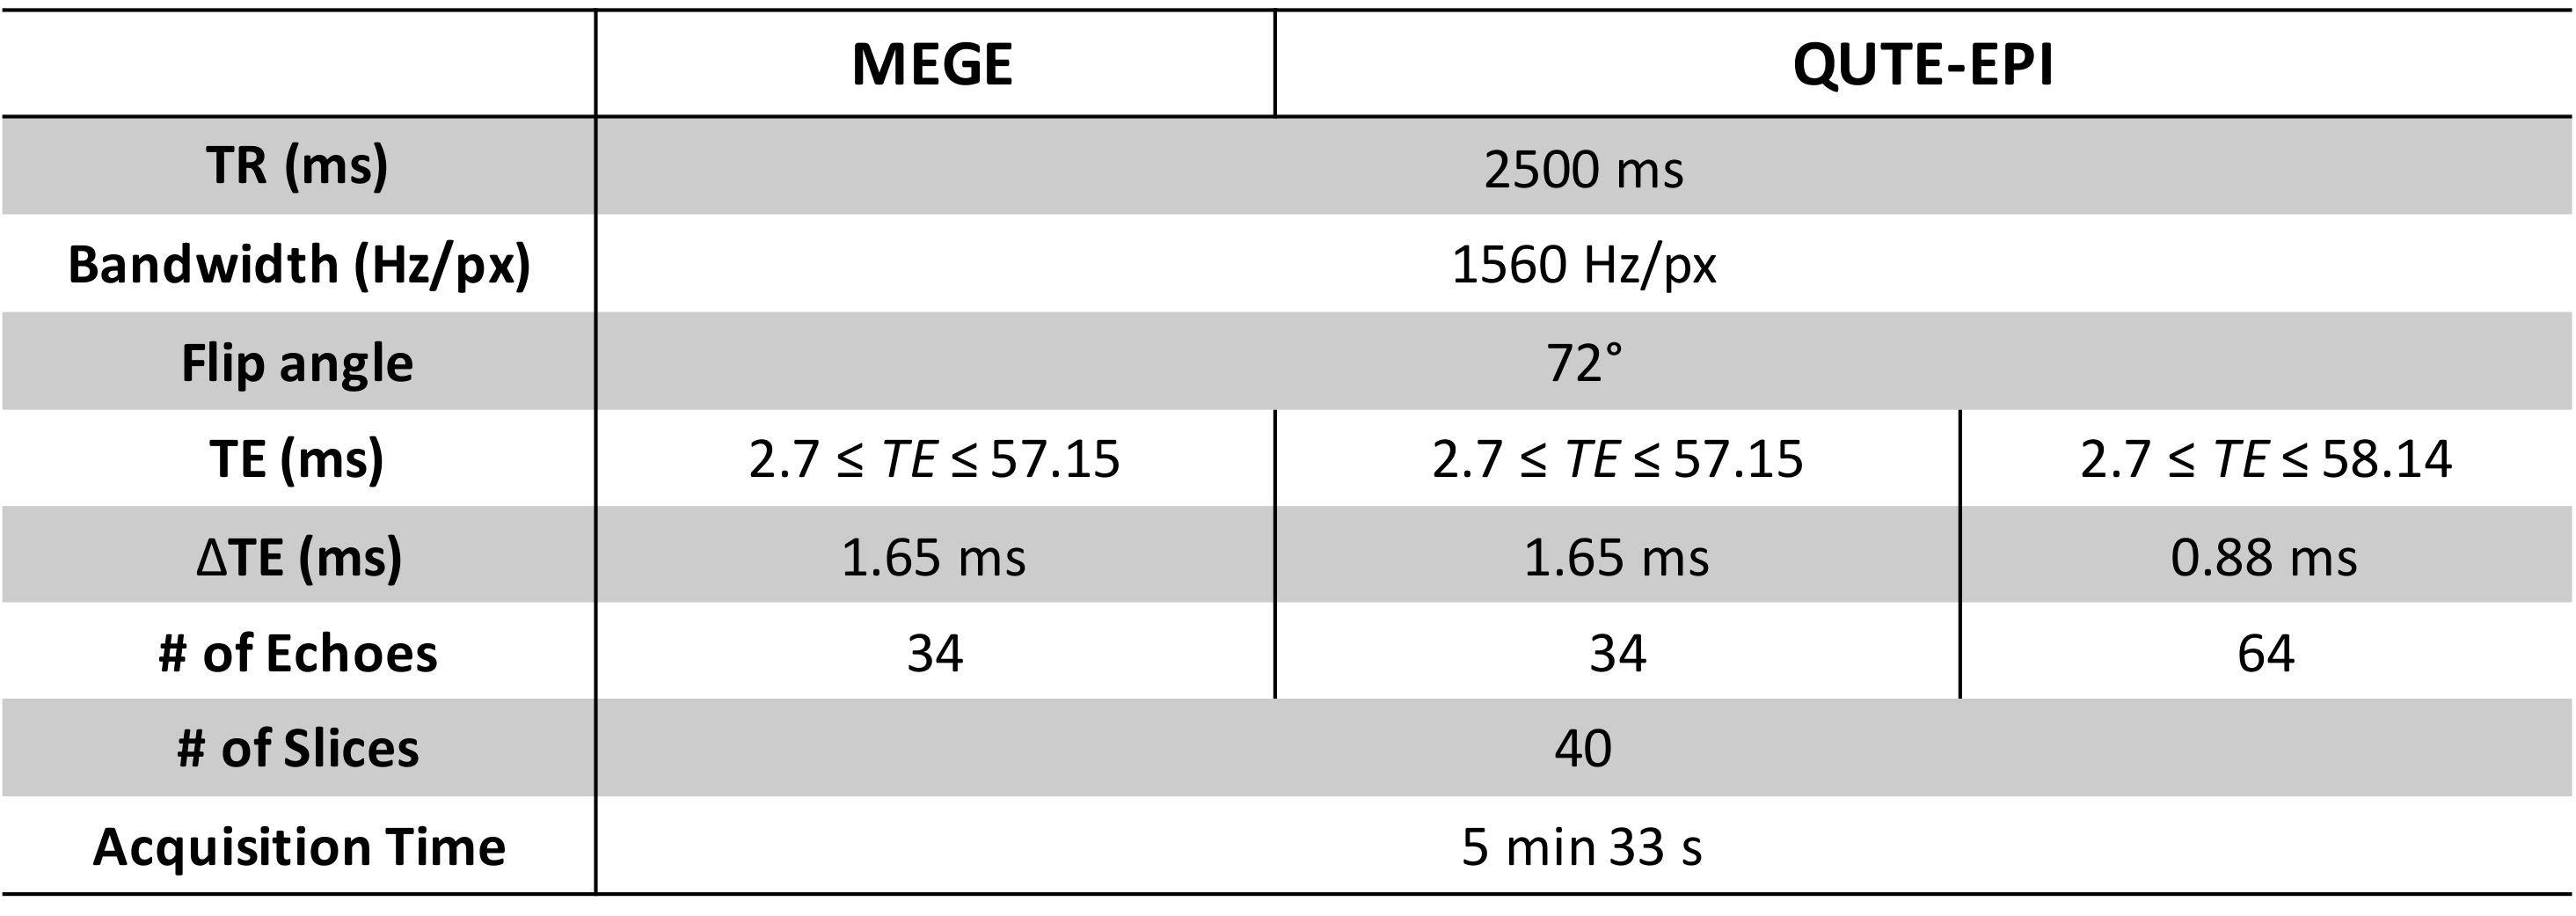
The MEGE and QUTE-EPI sequences were optimised to offer their maximum number of echoes under a given set of imaging parameters: FOV of 205 mm × 205 mm, matrix of 128 × 128, slice thickness of 1.6 mm, TR of 2500 ms and TEs starting from 2.7 ms and ending at around 58 ms. As a result, the number of echoes achieved by MEGE and QUTE-EPI were 34 and 64, respectively (see Table 1). It is important to note that the effective echo spacing of QUTE-EPI is much shorter (0.88 ms) than that of MEGE (1.65 ms). In order to compare the performance of QUTE-EPI with MEGE under the same conditions including echo spacing, another QUTE-EPI protocol was configured to provide the same number of echoes (34) with the same TEs as the MEGE case (see the middle column of Table 1). Data from a healthy volunteer were acquired using the above three protocols on a 7T MR scanner (MAGNETOM Terra, Siemens Healthineers, Erlargen, Germany).
For quantitative T2* mapping, nonlinear least square method was used in each voxel. The model was set to y = A·exp(-time/T2*)+B with the use of constant offset.6 The mean and standard deviation of T2* relaxation times were obtained for the white matter (WM) and grey matter (GM) regions.
Results
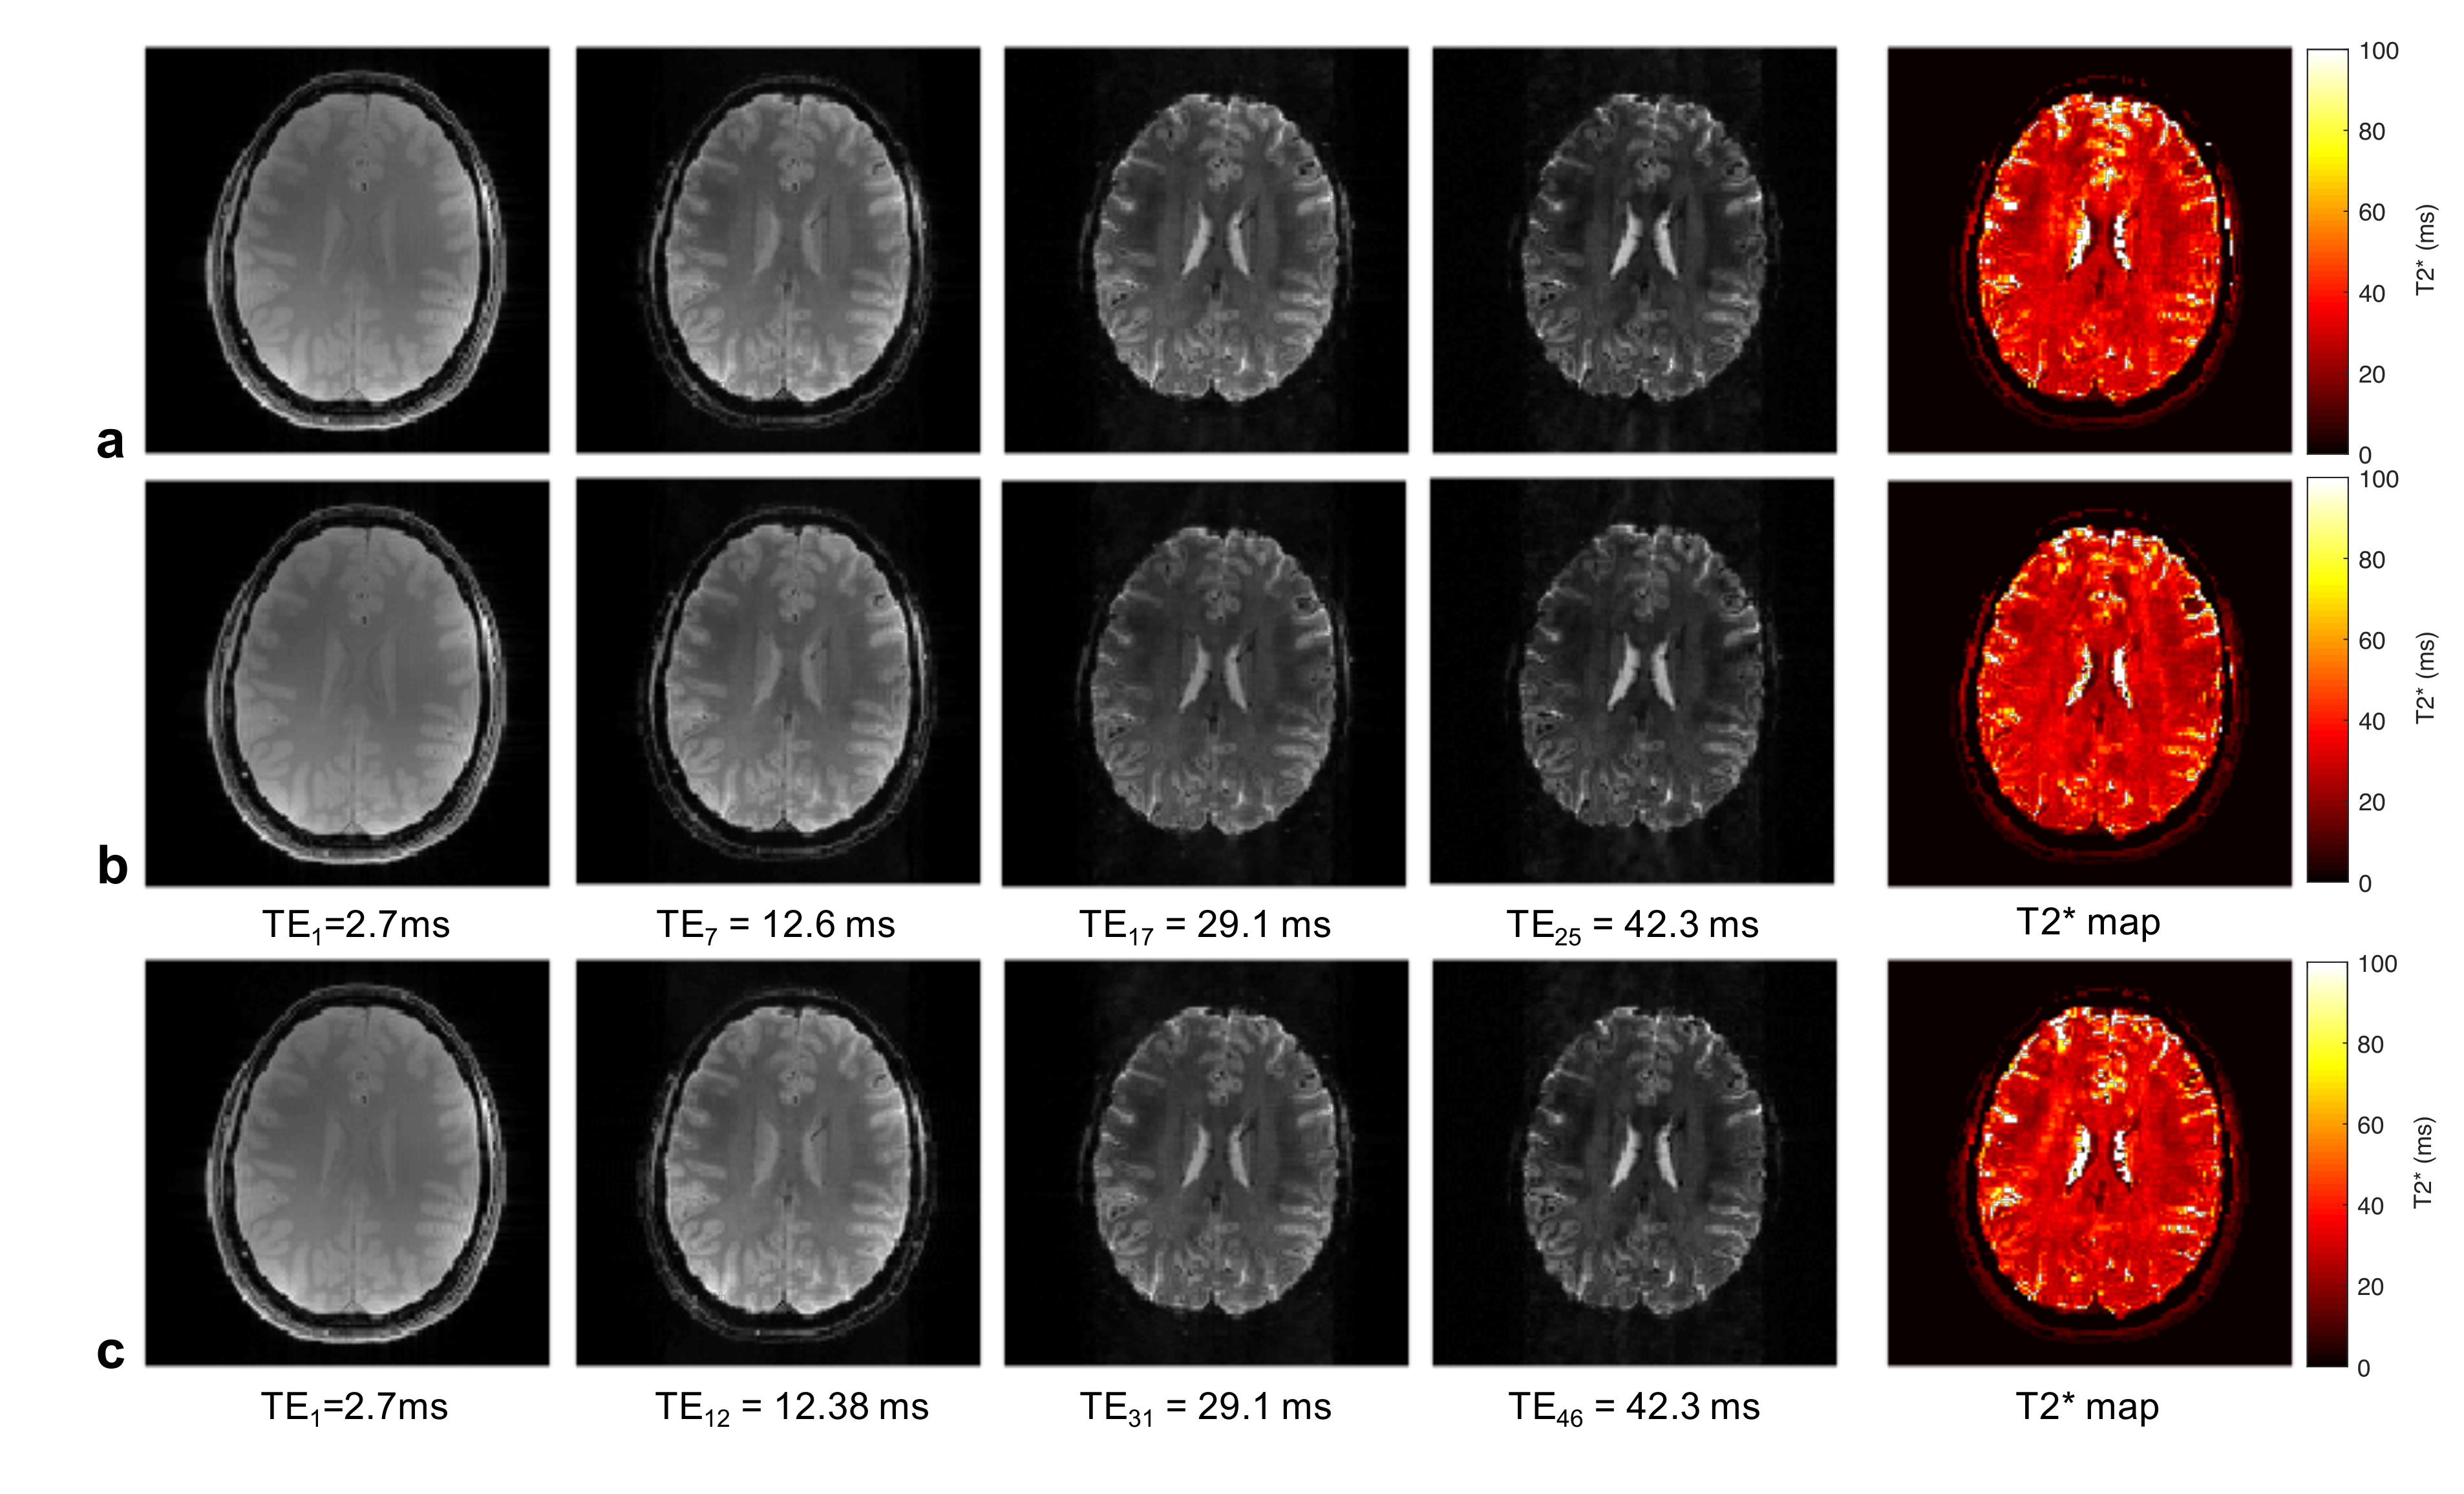
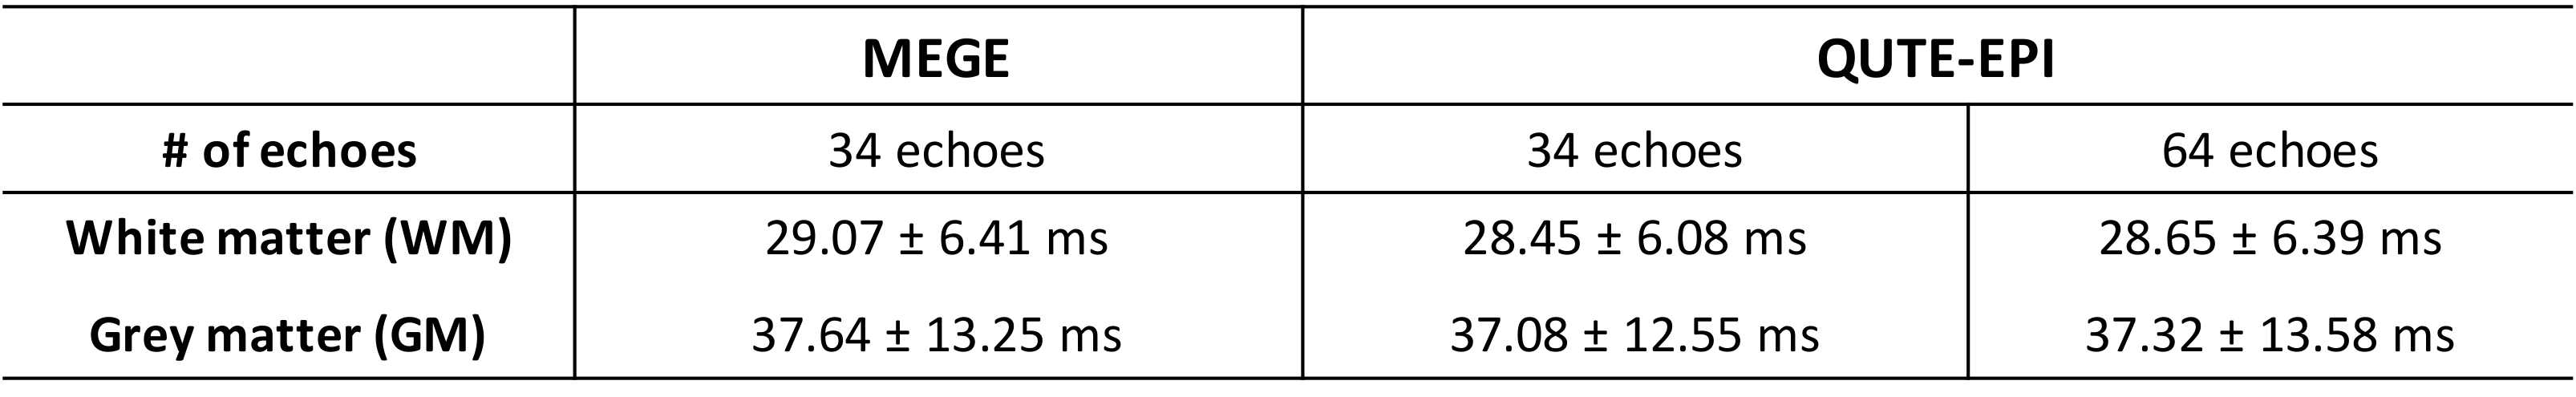
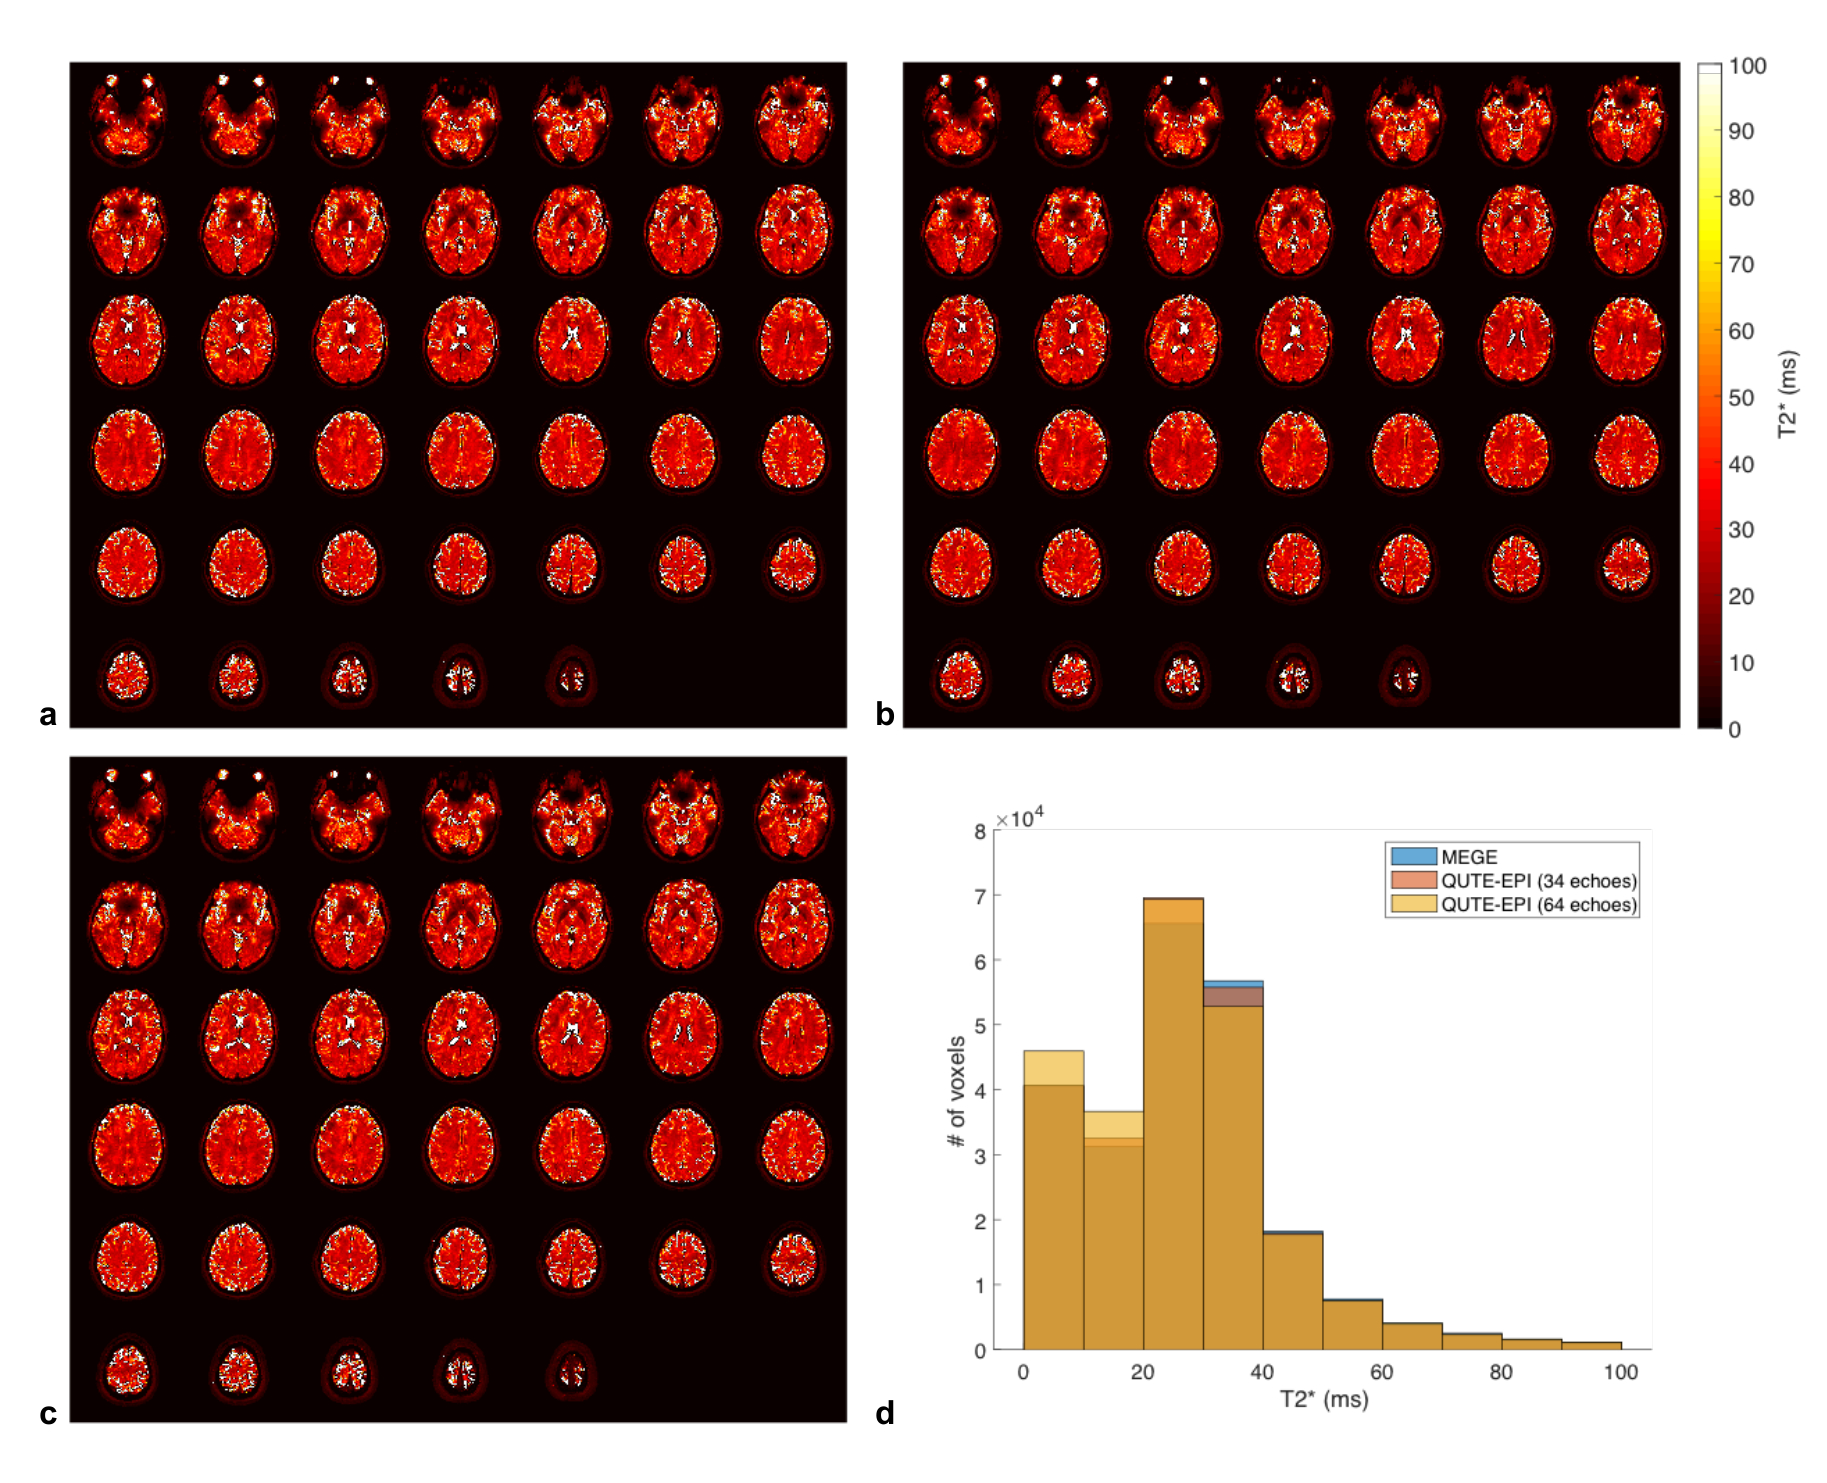
Figure 2 shows the acquired images from the three protocols and the corresponding estimated T2* maps. Figs. 2 a, b and c are the results from MEGE, QUTE-EPI (34 echoes) and QUTE-EPI (64 echoes), respectively. Visual inspection of Fig. 2a and b suggests that the performance of MEGE and QUTE-EPI is comparable to each other. This was also verified by plotting histograms of estimated T2* values (see Fig. 3). The mean and standard deviation of T2* values in WM and GM regions are listed in Table 2, revealing that the values are all in good agreement with those in the literature.7,8Discussion
The results of histogram revealed that the distribution of T2* values is nearly similar for both QUTE-EPI (34 echoes) and MEGE, indicating that their performance is quite comparable to each other. However, QUTE-EPI (64 echoes) showed increased number of voxels for the relatively low T2* ranges (0~20 ms). This might be due to the fact that QUTE-EPI (64 echoes) has a much shorter echo spacing than the other two protocols and, thus, enabled a better T2* estimation for that range. Investigation of the effect of a shorter echo spacing remains as a future work.Conclusions
The QUTE-EPI sequence provided a fast acquisition for quantification of T2* relaxation times at 7T. It was able to cover the whole brain in a short time (5.5 min) with 64 echoes. With other imaging parameters kept identical, QUTE-EPI achieved more echoes (64) than MEGE (34). QUTE-EPI would be advantageous for the brain regions having inherently short T2* or the ultra-high field applications where a faster T2* decay is expected.Acknowledgements
This work was supported by the European Union’s Horizon 2020 research and innovation programme under the Marie Sklodowska-Curie grant agreement No 764513.References
1. Gati JS, Menon RS, Ugurbil H, et al. Experimental determination of the BOLD field strength dependence in vessels tissue. Magn Reson Med 1997;38:296-302.
2. Anderson LJ, Holden S, Davis B, et al. Cardiovascular T2-star (T2*) magnetic resonance for the early diagnosis myocardial iron overload. Eur Heart J. 2001;22(23):2171-9.
3. Ula M, Bonny JM, Ouchchane L, et al. Is R2* a new MRI biomarker for the progression of Parkinson’s disease? A longitudinal follow-up. PLos ONE. 2013;8:e57904.
4. Dierkes T, Neeb H, Shah NJ. Distortion correction in echo-planar imaging and quantitative T2* mapping. International Congress Series. 2004;1265:181-185.
5. Yablonskiy D. Quantitative T2 Contrast with Gradient Echoes. Proc. Intl. Soc. Mag. Reson. Med. 8 (2000).
6. Ghugre NR, Enriquez CM, Coates TD, et al. Improved R2* measurement in myocardial iron overload. J Magn Reson Imaging 2006;23(1):9-16.
7. E.F. Cox and P.A. Gowland. Measuring T2 and T2’ in the brain at 1.5T, 3T, 7T using a hybrid gradient echo-spin echo sequence and EPI. Proc. Intl. Soc. Mag. Reson. Med. 16 (2008).
8. Li TQ, Yao B, van Gelderen P, et al. Characterization of T2* heterogeneity in human brain white matter. Magn Reson Med. 2009;62(6):1652-7.
Figures