4412
Influence of SWI Sequences and QSM Reconstruction Methods on Measured Magnetic Susceptibility in Cerebral Veins1Department of Neuroradiology, Technical University of Munich, Munich, Germany, 2Philips Research, Hamburg, Germany, 3Philips Healthcare, Hamburg, Germany
Synopsis
Quantitative Susceptibility Mapping (QSM) has recently been used for assessing the cerebral oxygen metabolism. However, a systematic investigation on the most suitable imaging parameters and reconstruction algorithms for determining the venous susceptibility values is missing. Therefore, we investigated both, the impact of flow compensation and accelerated acquisition as well as different reconstruction methods on measured venous susceptibility. Our results suggest that the choice of reconstruction technique can significantly influence the venous susceptibility values while the investigated imaging parameters did not considerably affect its accuracy. Thus, the applied QSM reconstruction technique has to be considered carefully when quantifying the venous oxygenation.
Introduction
The
venous oxygenation
in the brain
can be used to derive
information on the
oxygen metabolism1-2 and can thereby function as
a bio-marker in characterizing neurological diseases. While 15O PET
is the gold standard used for assessment of cerebral oxygen
metabolism,3 Quantitative Susceptibility Mapping (QSM)
was proposed as a non-invasive alternative1,4-5 with
less side effects and better availability. However, calculating the
magnetic susceptibility is an ill-posed problem and a large variety
of existing reconstruction procedures widely influence the overall
appearance of derived susceptibility maps.
In
this study, we compare QSM parameter maps, that were reconstructed
with three different algorithms and two different sets of
reconstruction parameters each, with regard to their delineation of
veins and the derived venous susceptibility values.
In
addition, susceptibility weighted imaging (SWI) was performed with
either full multi-echo or first-echo only flow compensation (FC) as
well as acceleration with either SENSE or Compressed SENSE6 (CS) to
investigate their influences on resulting parameter maps.
Methods
Seven healthy subjects (aged 22-48) were scanned on a 3.0T Philips Elition using a 32-channel head-neck-coil and three different 3D multi-echo gradient-echo SWI sequences: 1) a standard sequence with first-echo only FC, 2) a modified sequence with full multi-echo FC (both with regular SENSE (SENSE-factor 2)), and 3) the multi-echo FC with Compressed SENSE (CS=3). Common parameters were: 4 echoes, TE1/ΔTE/TR=8.8/8.8/38ms; voxel size=0.7x0.7x1.4mm³; flip angle=14°; scan duration: 7:30min (SENSE) and 5:30min (CS). QSM maps were calculated using three different processing tools: 1) FANSI (Fast Algorithm for Nonlinear Susceptibility Inversion)7-9 (version_03/2017) with two different parameter settings (FANSI1 and FANSI2); 2) MEDI toolbox (Morphology Enabled Dipole Inversion)10-11 (version_11/2017) without (MEDI1) and with merit error reduction (MEDI2); 3) iLSQR12 and STAR13-14 reconstruction methods from the STI Suite15 (v3.0_05/2017) (see Fig.1 for reconstruction details). For whole volume vessel segmentation, we used the automatic multiscale vessel filtering method from the JIST-LayoutTool16 (v1.8_08/2013) of MIPAV17 (v8.0.2_02/2018), yielding whole-brain mean venous susceptibility values. These automatically obtained values were compared with the results from four manually segmented veins of each subject. For manual segmentation, selected vessels were at least partly recognized by the automatic segmentation for each of the six QSM reconstructions (Fig.4a). Here, the same manually segmented ROI was applied to all six reconstruction maps (Fig.4b).Results
Fig.1 shows one exemplary slice of QSM parameter maps (all acquisitions and processings) of one subject. Visual differences between first-echo FC and multi-echo FC and between both acceleration methods appear small. Using automatic vessel filtering, similar voxels were segmented for QSM maps of first-echo FC and multi-echo FC, while the segmentations vary more strongly between different reconstruction techniques (Fig.2). However, there is overlap between automatic segmentations of all six reconstructions (Fig.4a). MEDI maps provide highest contrast while FANSI maps appear slightly blurred. The visually most homogeneous representation of vessels in QSM is provided by the STI Suite. FANSI and especially MEDI reconstructions yield more inhomogeneous structures around vessels (Fig.4c). Mean susceptibility values of automatically segmented voxels from all subjects vary only slightly between SWI sequences, but depend more strongly on reconstruction algorithms (Fig.3). Similar results are found when visually comparing single veins (Fig.4c) and when quantitatively determining mean susceptibility values from four manually selected ROIs of each subject (28 data points) (Fig.5).Discussion
Generally, differences between QSM parameter maps obtained from different reconstruction techniques are larger than between the three SWI sequences. This applies for both, visual inspection and quantitative analysis using automatic (Fig.3) and manual segmentations (Fig.5). Thus, our results suggest that SWI sequences with higher acceleration (CS=3) than regular (SENSE-factor=2) can be applied without significant effects on measured venous susceptibility (p>0.26, Wilcoxon-rank-sum-test) but with the advantage of 2 min reduced scan time. Furthermore, first-echo only FC could well be utilized without loss of accuracy (p>0.38, Wilcoxon-rank-sum-test). This means, that no special modification is needed for the measurements and the standard vendor provided sequence can be used. The relatively large differences between the QSM parameter maps obtained by different reconstruction methods could be caused by varying degrees of smoothing or regularization influencing also the extent of partial volume effects. In our results, especially the STI algorithms tend to underestimate venous susceptibility values. Such processing differences also influence the results of automatic vein segmentations and thus the global mean values of venous susceptibility. This demonstrates the importance of taking into account the QSM reconstruction algorithm when determining venous susceptibility values.Conclusion
A standard SWI sequence with first-echo only FC and with CS acceleration factor 3 can be used for analysis of venous oxygenation via QSM reconstruction. Proper validation of susceptibility values obtained with different QSM algorithms requires further studies and comparisons with alternate methods, e.g. TRUST.2,18
Acknowledgements
This study was funded by the German research Foundation (DFG, grant PR 1039/6-1). Ronja Berg is supported by a PhD grant from the Friedrich-Ebert-Stiftung. We thank Guillaume Gilbert from Philips for his support with the modified sequence for full multi-echo flow compensation.References
- Fan, A. P., Bilgic, B., Gagnon, L., Witzel, T., Bhat, H., Rosen, B. R., & Adalsteinsson, E. (2014). Quantitative oxygenation venography from MRI phase. Magnetic resonance in medicine, 72(1), 149-159.
- Ge, Y., Zhang, Z., Lu, H., Tang, L., Jaggi, H., Herbert, J., ... & Grossman, R. I. (2012). Characterizing brain oxygen metabolism in patients with multiple sclerosis with T2-relaxation-under-spin-tagging MRI. Journal of Cerebral Blood Flow & Metabolism, 32(3), 403-412.
- Mintun, M. A., Raichle, M. E., Martin, W. R., & Herscovitch, P. (1984). Brain oxygen utilization measured with O-15 radiotracers and positron emission tomography. Journal of nuclear medicine: official publication, Society of Nuclear Medicine, 25(2), 177-187.
- Kudo, K., Liu, T., Murakami, T., Goodwin, J., Uwano, I., Yamashita, F., ... & Sasaki, M. (2016). Oxygen extraction fraction measurement using quantitative susceptibility mapping: comparison with positron emission tomography. Journal of Cerebral Blood Flow & Metabolism, 36(8), 1424-1433.
- Xu, B., Liu, T., Spincemaille, P., Prince, M., & Wang, Y. (2014). Flow compensated quantitative susceptibility mapping for venous oxygenation imaging. Magnetic resonance in medicine, 72(2), 438-445.
- Geerts-Ossevoort, L., de Weerdt, E., Duijndam, A., van IJperen, G., Peeters, H., Doneva, M., ... & Huang, A. Speed done right. Every time.
- Bilgic, B., Fan, A. P., Polimeni, J. R., Cauley, S. F., Bianciardi, M., Adalsteinsson, E., ... & Setsompop, K. (2014). Fast quantitative susceptibility mapping with L1‐regularization and automatic parameter selection. Magnetic resonance in medicine, 72(5), 1444-1459.
- Bilgic, B., Chatnuntawech, I., Langkammer, C., & Setsompop, K. (2015, September). Sparse methods for quantitative susceptibility mapping. In Wavelets and Sparsity XVI (Vol. 9597, p. 959711). International Society for Optics and Photonics.
- Milovic, C., Bilgic, B., Zhao, B., Acosta‐Cabronero, J., & Tejos, C. (2018). Fast nonlinear susceptibility inversion with variational regularization. Magnetic resonance in medicine, 80(2), 814-821.
- Liu, J., Liu, T., de Rochefort, L., Ledoux, J., Khalidov, I., Chen, W., ... & Wang, Y. (2012). Morphology enabled dipole inversion for quantitative susceptibility mapping using structural consistency between the magnitude image and the susceptibility map. Neuroimage, 59(3), 2560-2568.
- Liu, T., Liu, J., De Rochefort, L., Spincemaille, P., Khalidov, I., Ledoux, J. R., & Wang, Y. (2011). Morphology enabled dipole inversion (MEDI) from a single‐angle acquisition: comparison with COSMOS in human brain imaging. Magnetic resonance in medicine, 66(3), 777-783.
- Li, W., Wu, B., & Liu, C. (2011). Quantitative susceptibility mapping of human brain reflects spatial variation in tissue composition. Neuroimage, 55(4), 1645-1656.
- Wei, H., Dibb, R., Decker, K., Wang, N., Zhang, Y., Zong, X., ... & Liu, C. (2017). Investigating magnetic susceptibility of human knee joint at 7 Tesla. Magnetic resonance in medicine, 78(5), 1933-1943.
- Wei, H., Dibb, R., Zhou, Y., Sun, Y., Xu, J., Wang, N., & Liu, C. (2015). Streaking artifact reduction for quantitative susceptibility mapping of sources with large dynamic range. NMR in Biomedicine, 28(10), 1294-1303.
- https://people.eecs.berkeley.edu/~chunlei.liu/software.html accessed 2018 Nov 05.
- https://www.nitrc.org/projects/jist/ accessed 2018 Nov 05.
- https://mipav.cit.nih.gov/ accessed 2018 Nov 05.
- Lu, H., & Ge, Y. (2008). Quantitative evaluation of oxygenation in venous vessels using T2‐relaxation‐under‐spin‐tagging MRI. Magnetic resonance in medicine, 60(2), 357-363.
Figures
Figure 1: QSM parameter maps from three SWI sequences and six QSM reconstruction methods.
Top row: SWI with first-echo flow compensation only. Middle row: SWI with full multi-echo flow compensation; both sequences using SENSE (SENSE-factor 2). Bottom row: SWI with full multi-echo flow compensation using Compressed Sense (CS=3). Columns: QSM maps obtained using FANSI reconstruction, MEDI toolbox, and STI Suite with two different parameter settings each. Processing parameters are provided below the corresponding QSM images. FC = flow compensation, ME = multi-echo, LBV = Laplacian-boundary-value, BET = brain-extraction-tool, FIT = fractional-intensity-threshold, TG = threshold-gradient, PDF = projection-onto-dipole-fileds; SMV = spherical-mean-value.
Figure
2: Comparison of automatic vessel segmentations of two SWI sequences
and three QSM reconstruction methods.
Results from the multiscale
vessel filtering (blue overlay) from the JIST-LayoutToolbox for SWI
with first-echo flow compensation only (top row) and with full
multi-echo flow compensation (bottom row). Results for one parameter
setting of each reconstruction algorithm (FANSI, MEDI, and STI Suite)
are shown in each column. Processing parameters are provided below
the corresponding QSM images. A Hessian shape filter was used for the
segmentation. The parameters were: probability threshold = 0.3,
propagation model: diffusion with diffusion factor = 0.5.
Figure
3: Mean susceptibility values obtained from automatically segmented
QSM voxels for all sequences and reconstruction methods.
Box plots of the mean
susceptibility values of the segmented voxels for all 7 subjects
comparing values for two different parameter settings from three
reconstruction algorithms (FANSI, MEDI, and STI Suite). Results are
shown for SWI sequences with first-echo flow compensation (green),
with full multi-echo flow compensation (orange), and with multi-echo
flow compensation with Compressed Sense (blue). For the automatic
segmentation, the multiscale vessel filtering method from the
JIST-LayoutToolbox was used.
Figure
4: Exemplary manual segmentation of a vessel, for different
reconstruction methods.
a) Summation of automatically
segmented voxels from all six reconstructions (two from FANSI, MEDI,
and STI, respectively). Color coding depends on the number of
reconstructions for which a specific voxel was segmented. b) SWI of
an enlarged exemplary vessel with blue overlay of the manual
segmentation for first-echo only FC (top) and multi-echo FC (bottom).
c) The same section of the enlarged vessel is shown for FANSI 2, MEDI
2, and STI STAR reconstruction methods in both sequences. The green
arrows indicate inhomogeneous structures.
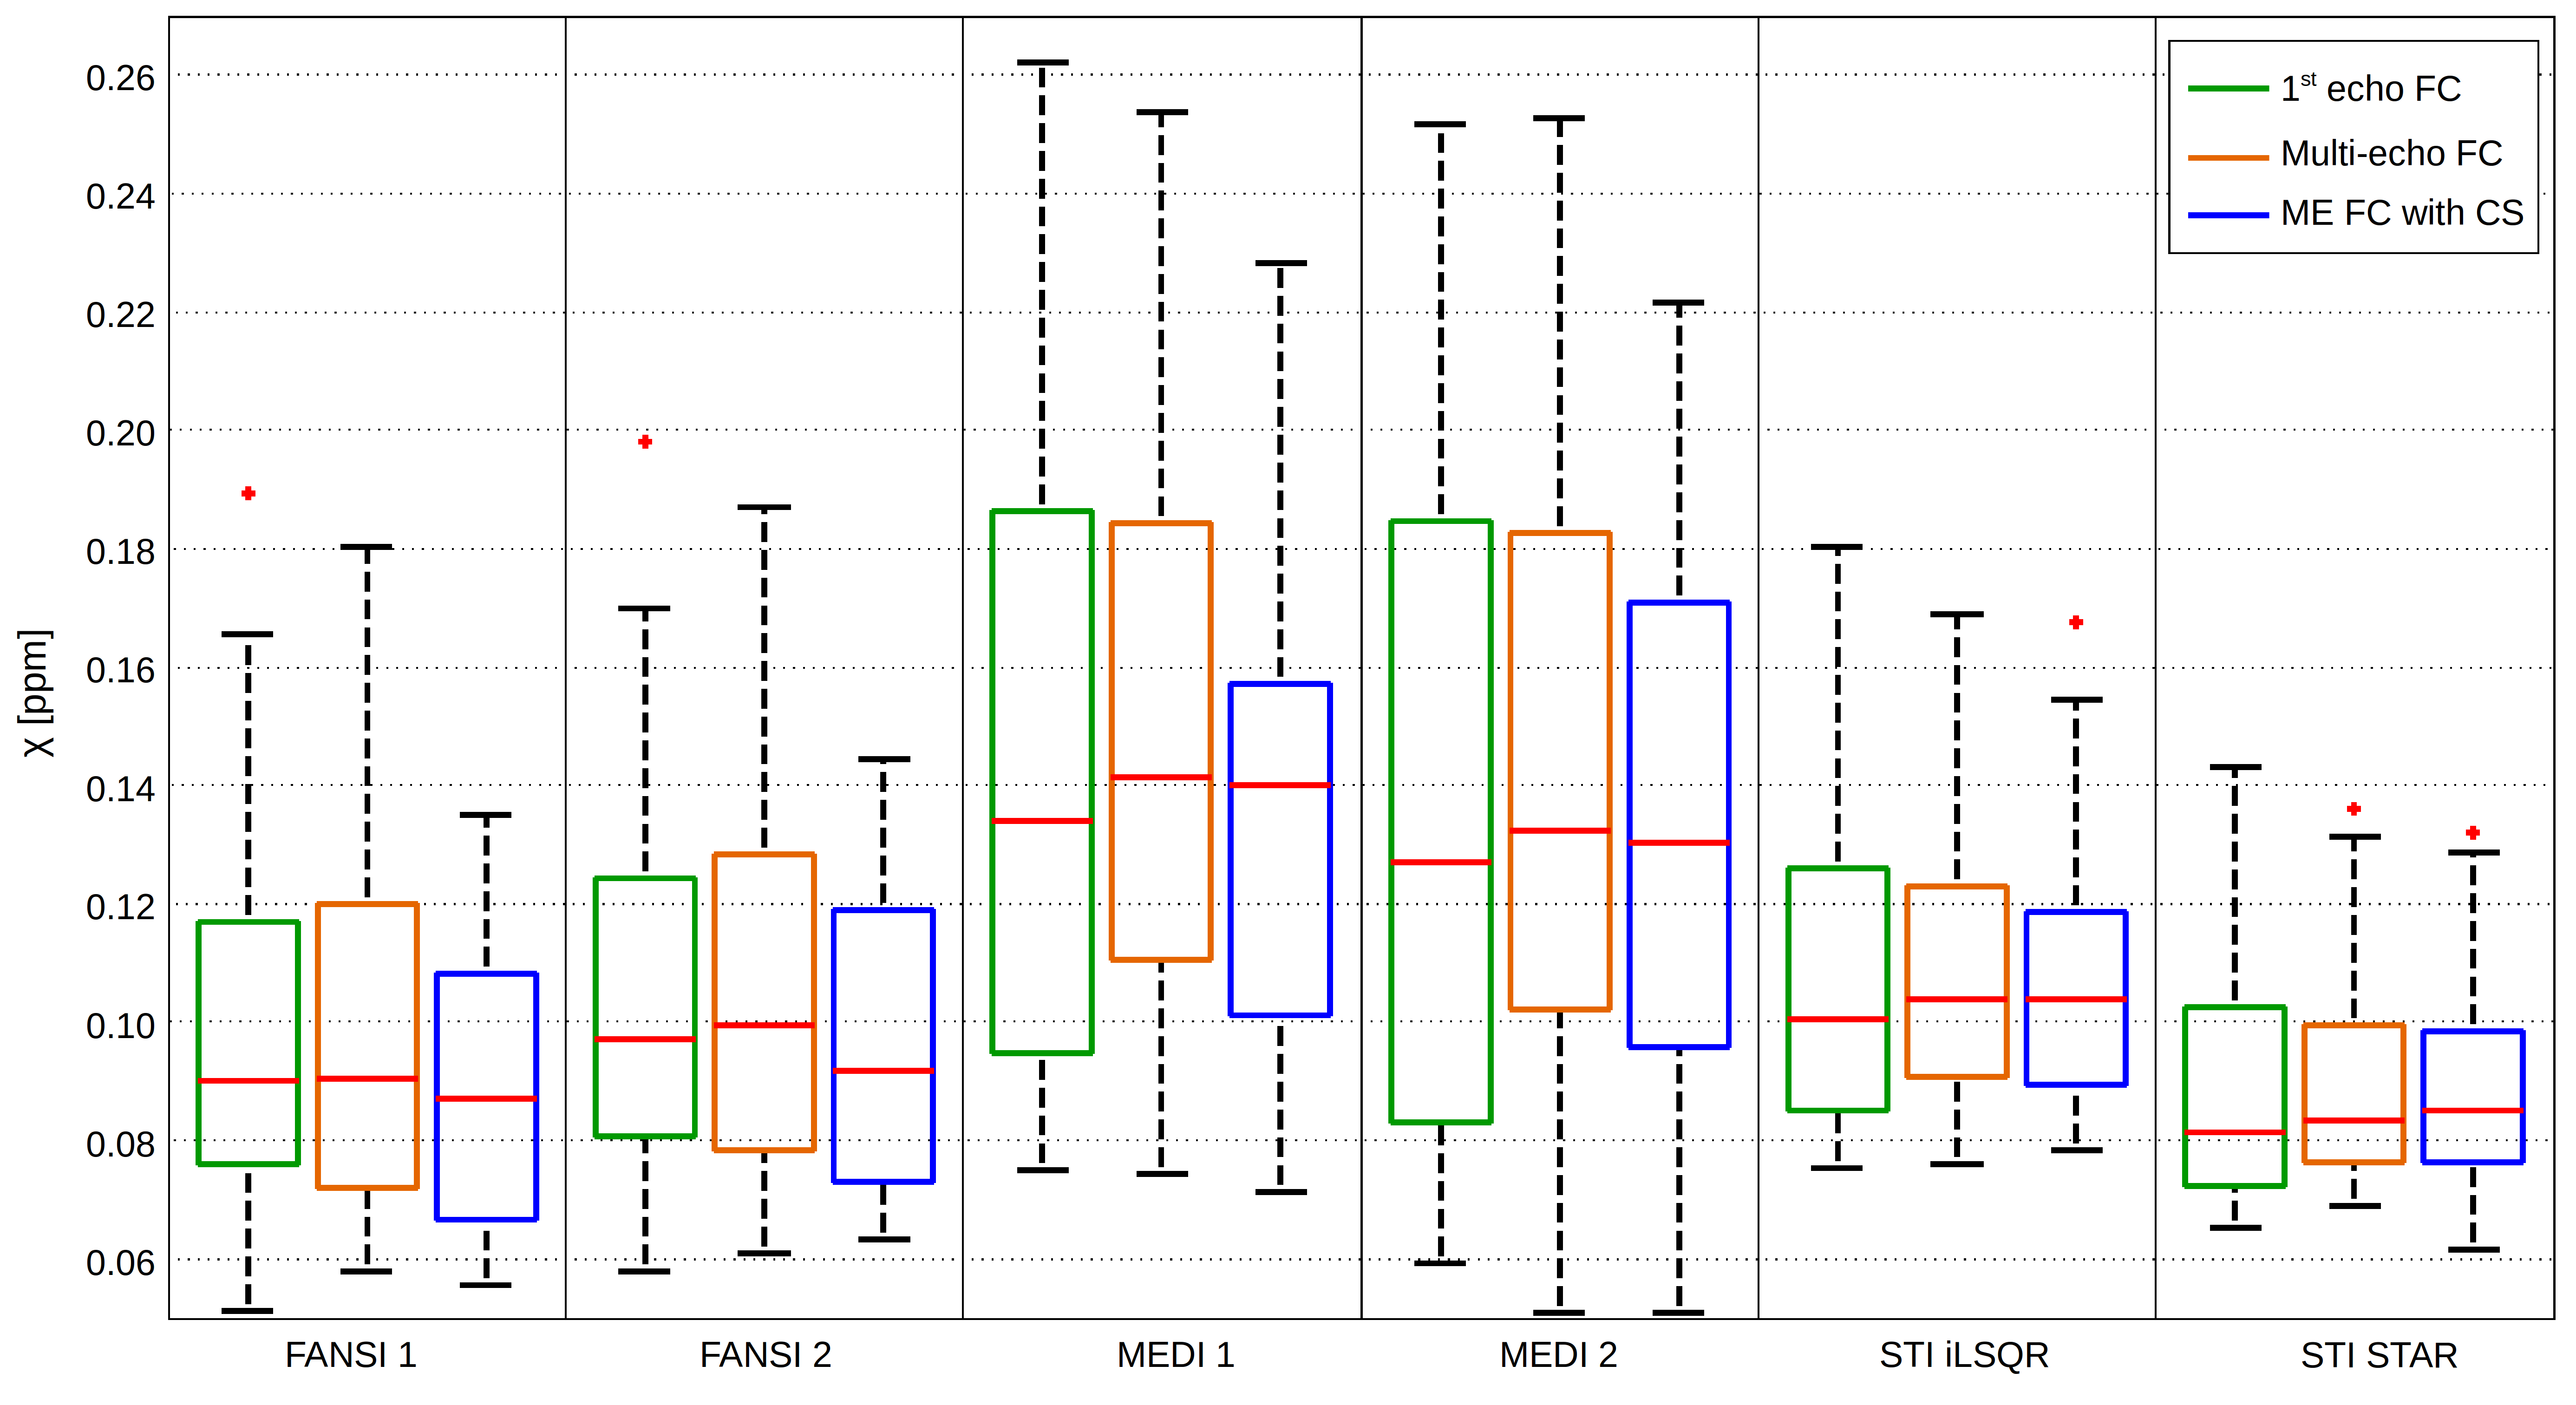
Figure 5: Mean susceptibility values of manually segmented QSM vessels.
Box plots of mean susceptibility values of four manually segmented ROIs for each of the seven subjects comparing values from two different parameters settings for each of the reconstruction algorithms (FANSI, MEDI, and STI Suite). For segmentation, ROIs in four larger vessels were selected in each subject. Each box plot visualizes the mean values of four ROIs in seven subject (28 values). Results are shown for SWI sequences with first-echo flow compensation (green), with full multi-echo flow compensation (orange), and with multi-echo flow compensation with Compressed Sense (blue).