4410
High-resolution 3D T1 and T2 Mapping in the Brain Using Compressed Sensing and Dictionary Fitting1Advanced Clinical Imaging Technology, Siemens Healthcare AG, Lausanne, Switzerland, 2Department of Radiology, University Hospital (CHUV), Lausanne, Switzerland, 3LTS5, École Polytechnique Fédérale de Lausanne (EPFL), Lausanne, Switzerland, 4Magnetic Resonance, Siemens Healthcare GmbH, Erlangen, Germany
Synopsis
Quantitative magnetic resonance imaging (qMRI) aims at directly measuring physical tissue properties to be more independent from technical influences. However, parameter mapping is often long and 2D-based. In this work, we propose a protocol for 3D brain T1 and T2 mapping accelerated by compressed sensing. To improve T2 accuracy, we also implemented a T1-informed T2 dictionary fitting technique. Preliminary results showed the ability of the protocol to provide T1 and T2 maps at a 1x1x1.2mm3 resolution in 14:05min as well as the accuracy of the mapping. Establishing a fast 3D protocol will enable generating high-resolution atlases as a next step.
Introduction
Quantitative magnetic resonance imaging (qMRI) has great potential to aid diagnosis in various clinical applications1. However, accurate qMRI measurements require long acquisition times. This has led to very little acceptance in the clinical realm today, which in turn has prevented the creation of clinical databases of normal and abnormal qMRI measures. In a recent study2, a database for T1 and T2 relaxation values in the brain was established but was limited to a low trough-plane resolution as it involved 2D-based T2 mapping. To overcome this, we designed an accelerated quantitative protocol for 3D brain T1 and T2 mapping. Providing high resolution in all three dimensions may allow an improved sensitivity to small focal changes. We also propose the use of dictionary fitting3 to estimate T2 maps in order to remove an arbitrary adjustment factor commonly used for T2-prepared acquisitions4.Methods
All experiments were performed at 3T (MAGNETOM Skyra, Siemens Healthcare, Erlangen, Germany) using a 64-channel head/neck coil. The proposed protocol consists of fast T1 and T2 mapping sequences and a B1 map (relevant sequence parameters shown in Table 1).
Quantitative T1 maps were acquired with an MP2RAGE5 prototype sequence accelerated using compressed sensing6,7 (CS). Quantitative T2 mapping was performed with a T2-prepared8 CS-accelerated FLASH prototype sequence9 (sequence diagram and sampling are shown in Figure 1). It employed a modified BIR4 pulse8 for T2-preparation and the signal was sampled using a Cartesian centre-out trajectory. Each of the four T2-prepared acquisitions was individually reconstructed; T2 was then estimated using a voxel-wise dictionary fitting on the weighted images. The dictionary was generated using Bloch simulations10 to model the acquired signal depending on twelve B1 values [0.33 - 1.25], 256 T1 values [4 - 2115]ms and 256 T2 values [169 - 3875]ms. The fitting was informed by the separately acquired T1 and B1 maps, which considerably reduced the dictionary search space.
Using the described protocol, data were acquired from a NIST-ISMRM phantom11. For the validation of T2 values, a single-echo SE sequence was additionally acquired (see Table 1). T1 values of the CS-MP2RAGE were considered already validated based on previous work7.
After obtaining informed written consent, in vivo data were acquired of four subjects, due to time constraints without the T2 validation sequence. White matter (WM) masks were generated using the prototype segmentation Morphobox12 on MP2RAGE data and were subsequently eroded.
Results
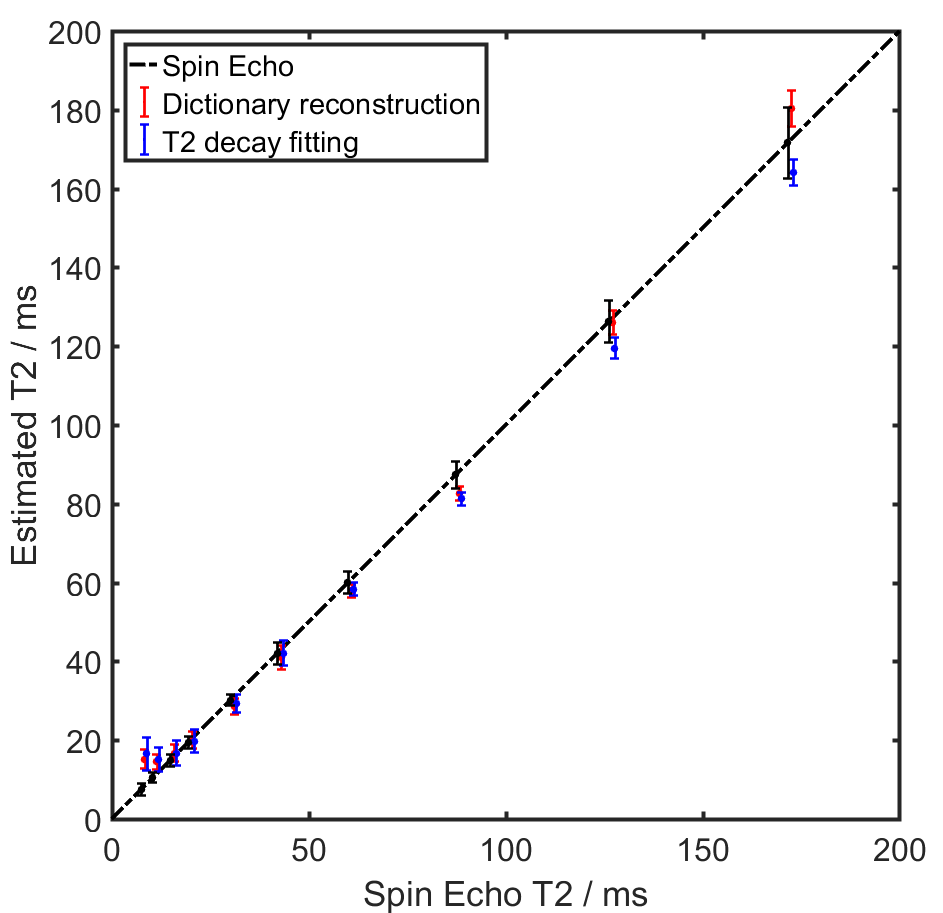
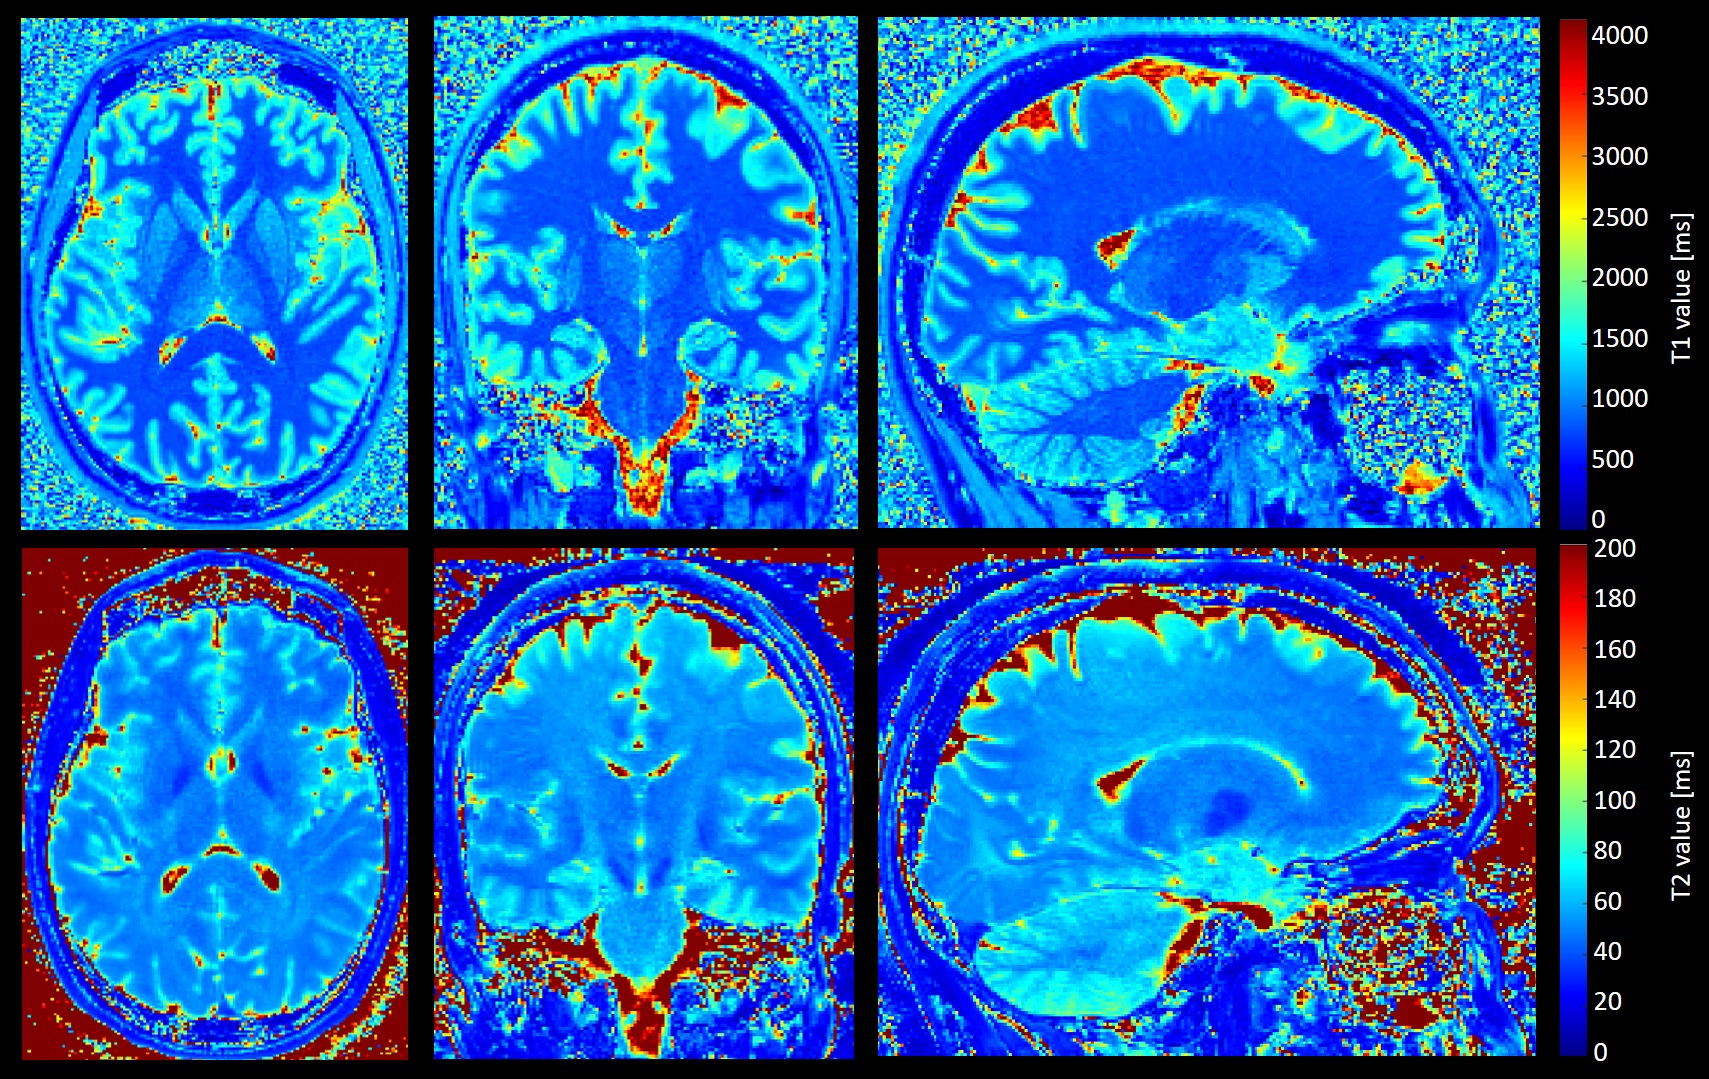
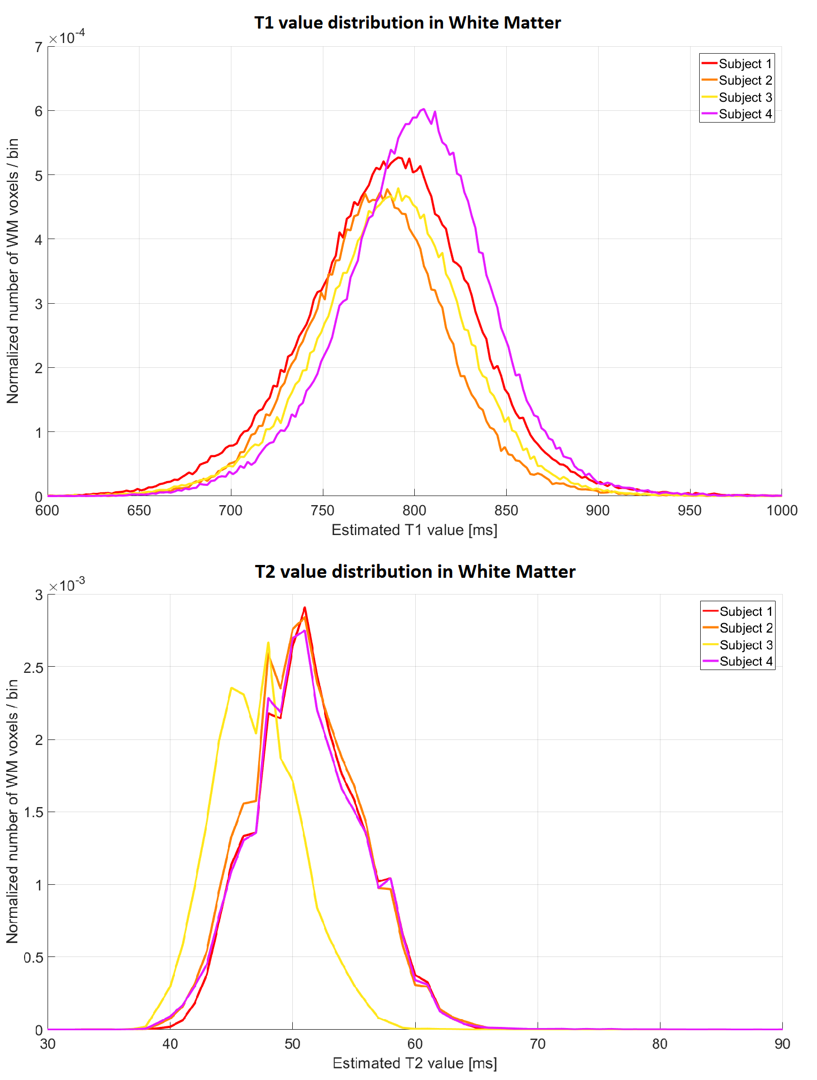
Figure 2 shows the mean and standard deviation of phantom T2 values. T2 values obtained with the proposed dictionary fitting are compared to those resulting from fitting an analytical model with a T1 adjustment factor9. Values obtained with a single-echo SE sequence served as reference. The root-mean-squared error (RMSE) of the dictionary-fitting is similar to the conventional T2-decay fitting (RMSE 4.1 versus 4.7). The differences between T2 value estimations are not significant (SE versus T2-prepared with decay fitting: p=0.81, SE versus T2-prepared with dictionary fitting: p=0.76, T2-prepared decay fitting versus dictionary fitting p=0.79), showing the desired similarity between fast T2 mapping and the reference. Notably, the dictionary fitting does not rely on a T1 adjustment factor. Example in vivo T1 and T2 maps from one subject are shown in Figure 3. The distributions of T1 and T2 values in WM are shown for the four subjects in Figure 4. T1 values in WM follow a Gaussian distribution (p<10-3 for the four subjects); subjects 1-3 showed similar means (µ1=786ms, µ2=777ms, µ3=787ms), subject 4 had slightly higher mean T1 (µ4=801ms). All T1 maps exhibited narrow variances (σ1=32.6ms, σ2=27.1ms, σ3=29.3ms, σ4=29.1ms). The distribution of T2 values in WM also appear similar (µ1=51.3ms, µ2=50.8ms, µ4=51.2ms, no significant differences) except for subject 3 (µ3=47.1ms) which shows a significant difference with respect to the other subjects (p<10-4), presumably originating from individual differences in microstructure.Discussion and Conclusion
Here,
we propose a high-resolution and highly accelerated 3D T1/T2 mapping protocol
for the brain (1x1x1.2mm3 resolution in 14:05 min). To this end, we
introduced a novel T1- and B1-informed dictionary-fitting for T2 mapping,
overcoming manual tuning of a T1 adjustment factor. Results from phantom
experiments proved the feasibility and accuracy of this fitting compared to
fitting of an analytical model and to SE reference values. Preliminary results
from in vivo data showed comparable
T1 and T2 values in WM across subjects. However, a more comprehensive study
with a larger cohort is required to fully validate the method. In the future,
we plan to establish 3D normative atlases using this protocol, with the aim of
enabling qMRI-based clinical decision support at high resolution.Acknowledgements
No acknowledgement found.References
1. Deoni SCL., “Quantitative relaxometry of the brain.” TMRI, 21(2):101, 2010.
2. Piredda G.F., et al., “Quantitative T1 and T2 Brain Atlases for the Detection of Abnormal Relaxation Times.” Proceedings of the International Society of Magnetic Resonance in Medicine, Paris, France, 2018.
3. Fleysher L., et al., “Optimizing the precision-per-unit-time of quantitative MR metrics: Examples for T1, T2, and DTI.” Magn. Reson. Med., 57(2):380-7, 2007.
4. van Heeswijk R.B., et al., “Free-Breathing 3 T Magnetic Resonance T2-Mapping of the Heart.” JCMG, 5(12):1231–1239, 2012.
5. Marques J. P., et al., “MP2RAGE, a self bias-field corrected sequence for improved segmentation and T1-mapping at high field.” Neuroimage, 49:1271–1281, 2010.
6. Lustig M., Donoho D., and Pauly J. M., “Sparse MRI: The application of compressed sensing for rapid MR imaging.” Magn. Reson. Med., 58(6):1182–1195, 2007.
7. Mussard E., et al., “Accelerated MP2RAGE Imaging Using Sparse Iterative Reconstruction.” Proceedings of the International Society of Magnetic Resonance in Medicine, Singapore, 2016.
8. Nezafat R., et al., “Spectrally selective B1-insensitive T2 magnetization preparation sequence.” Magn. Reson. Med., 61(6):1326–1335, 2009.
9. Mussard E., et al. “High-resolution 3D T2 mapping of the Brain Using T2-prepared Cartesian Spiral Phyllotaxis FLASH and Compressed Sensing.” Proceedings of the International Society of Magnetic Resonance in Medicine, Honolulu, USA, 2017.
10. Bloch F. “Nuclear induction.” Phys Rev, 70:460-474, 1946.
11. Keenan K.E., et al. “Comparison of T1 measurements using ISMRM/NIST system phantom.” Proceedings of the International Society of Magnetic Resonance in Medicine, Singapore, 2016.
12. Schmitter D., et al. “An evaluation of volume-based morphometry for prediction of mild cognitive impairment and Alzheimer's disease.” NeuroImage: Clinical, 7:7-17, 2015.
Figures
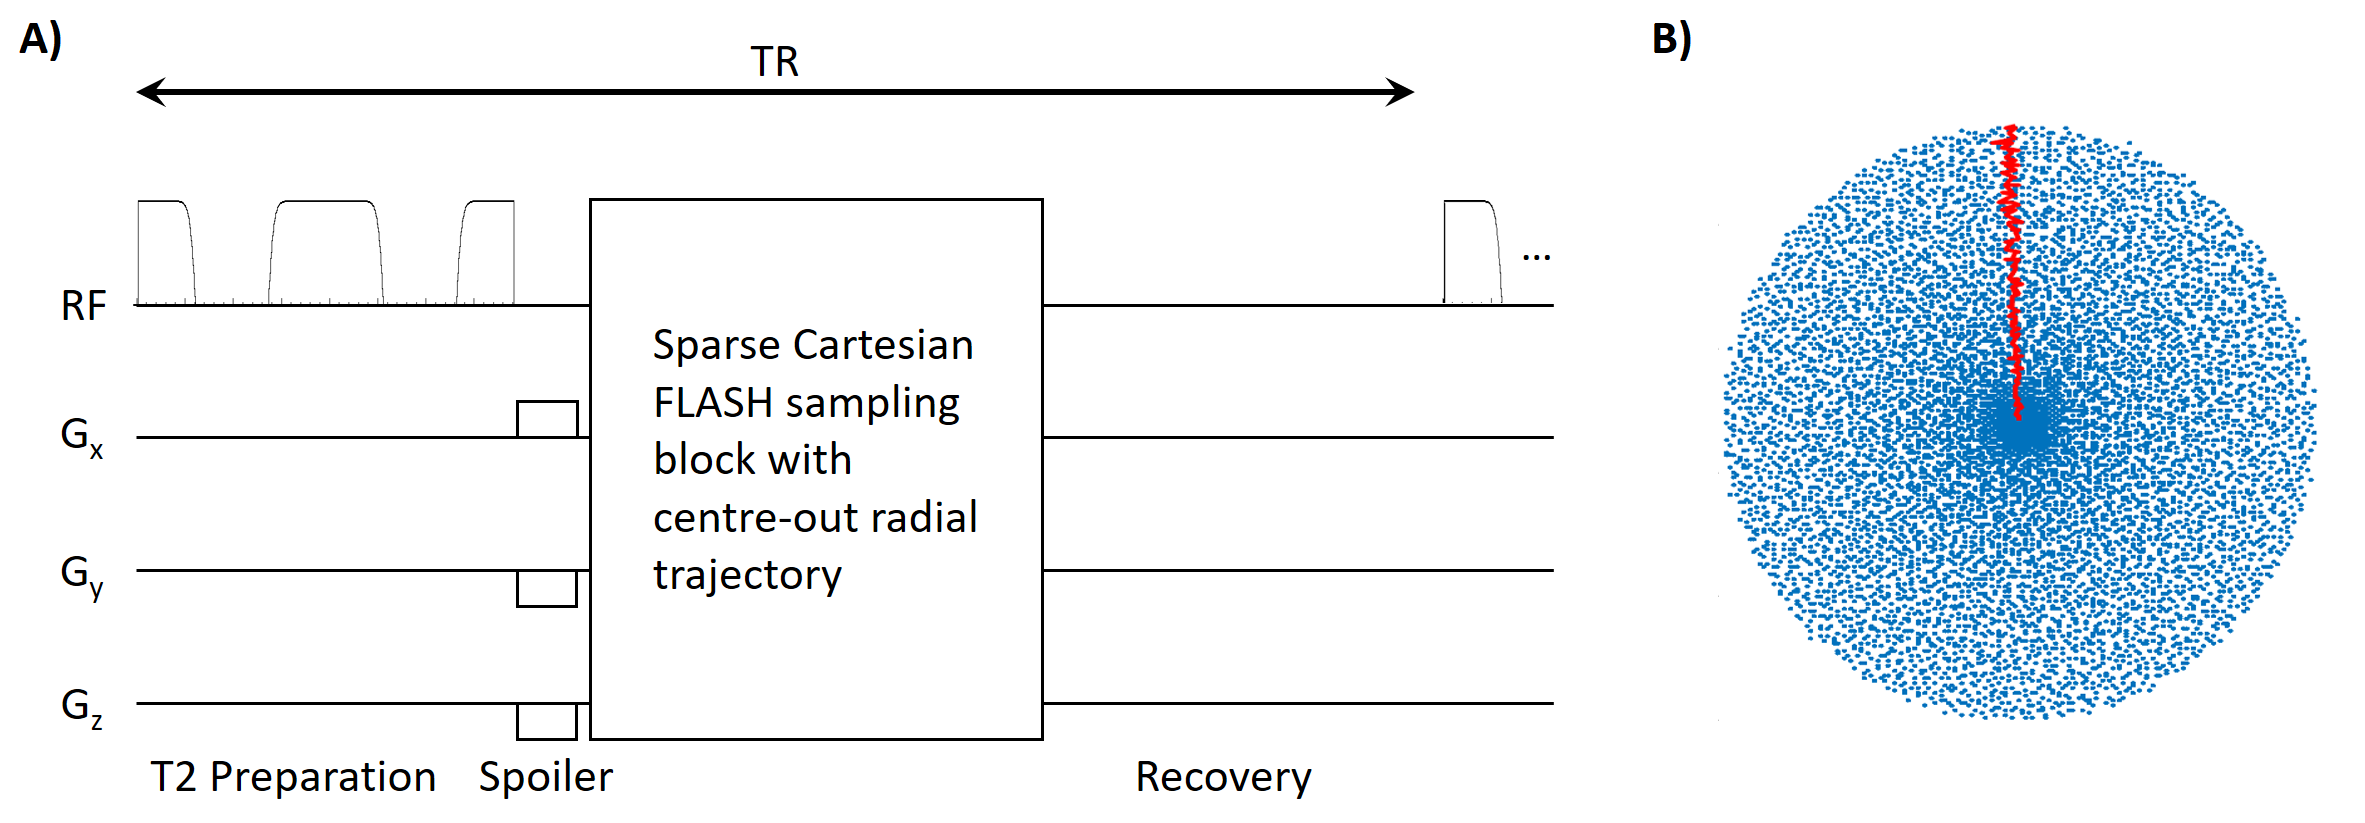
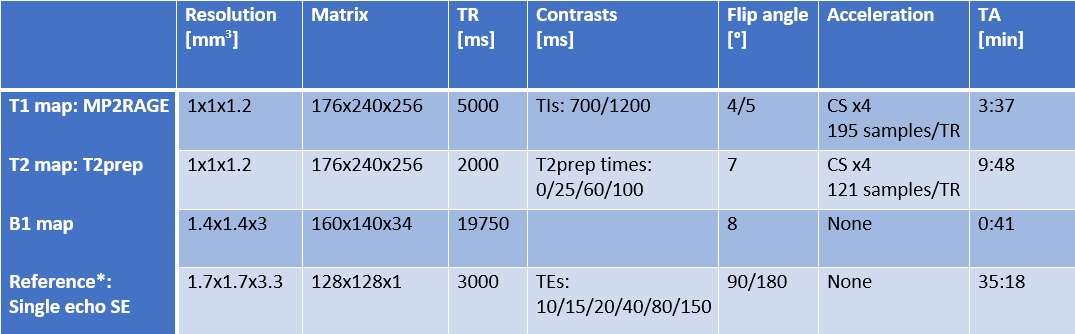
Table 1: Sequence parameters used to acquire T1 map, T2 map, B1 map in the NIST-ISMRM phantom and in vivo as well as parameters for the single-echo spin-echo acquired as a reference in the NIST-ISMRM phantom.
* Single echo SE reference for T2 mapping was only acquired in phantom.