4409
Improving quantification accuracy in whole brain high spatial resolution 3D kinetic mapping: Development of a novel dual temporal resolution DCE-MRI technique1Division of Informatics, Imaging and Data Sciences, University of Manchester, Manchester, United Kingdom, 2Manchester Centre for Clinical Neurosciences, Salford Royal NHS foundation trust, Manchester Academic Health Science Centre, United Kingdom
Synopsis
Mapping microvascular parameters from DCE MRI traditionally requires a compromise between temporal resolution, spatial resolution, and volume coverage. This study developed a dual-temporal-resolution-based analysis method which concatenates acquired high temporal (HT) and high spatial (HS) tissue contrast agent concentration curves into a unified HTHS merged volume and then pixel-by-pixel reconstructed the HT first pass concentration curve to a HS resolution before undertaking kinetic analysis. In vivo assessment of this method was undertaken in 12 patients with neurofibromatosis type II, and demonstrated the potential of the new method to provide high spatial resolution kinetic map with HT comparable accuracy and quality.
INTRODUCTION
In traditional Cartesian MRI, it is difficult to simultaneously achieve both high spatial (HS) (desirable for imaging small lesions and quantifying microvascular heterogeneity within tumors), and high temporal (HT) resolution (required for accurate derivation of pharmacokinetic parameters, such as the fractional volume, vp, transfer constant, Ktrans, and the fractional volume of extravascular extracellular space, ve). A compromise must be made when one sets up the acquisition protocol.
The objective of this study was to develop and test a novel dual temporal resolution (DTR) based kinetic mapping method for providing pharmacokinetic maps with both high spatial resolution and comparable high temporal (∆t < 1.5 s) acquisition accuracy.
METHODS
Patients
Dual-Injection DTR Study was acquired from twelve patients with neurofibromatosis type-2 (NF2) related vestibular schwannomas who were pre-treated with Avastin.
MR imaging
All patients were imaged on a Philips 1.5T scanner with ‘Dual Injection Dynamic Contrast-Enhanced (DICE)’ MRI1. A high temporal resolution (1 s) sequence with a low dose (fixed volume of 3 ml) of contrast agent (CA) was performed (LDHT-DCE), followed by a full CA dose (0.1 mmol/kg), high spatial resolution (voxel size = 1×1×2 mm) acquisition (FDHS-DCE). Variable flip angle (VFA; α = 2°, 8°, 15° and 20°) acquisitions were performed prior to both the LDHT and FDHS DCE for longitudinal relaxation rate mapping.
Theory and key steps of the new method
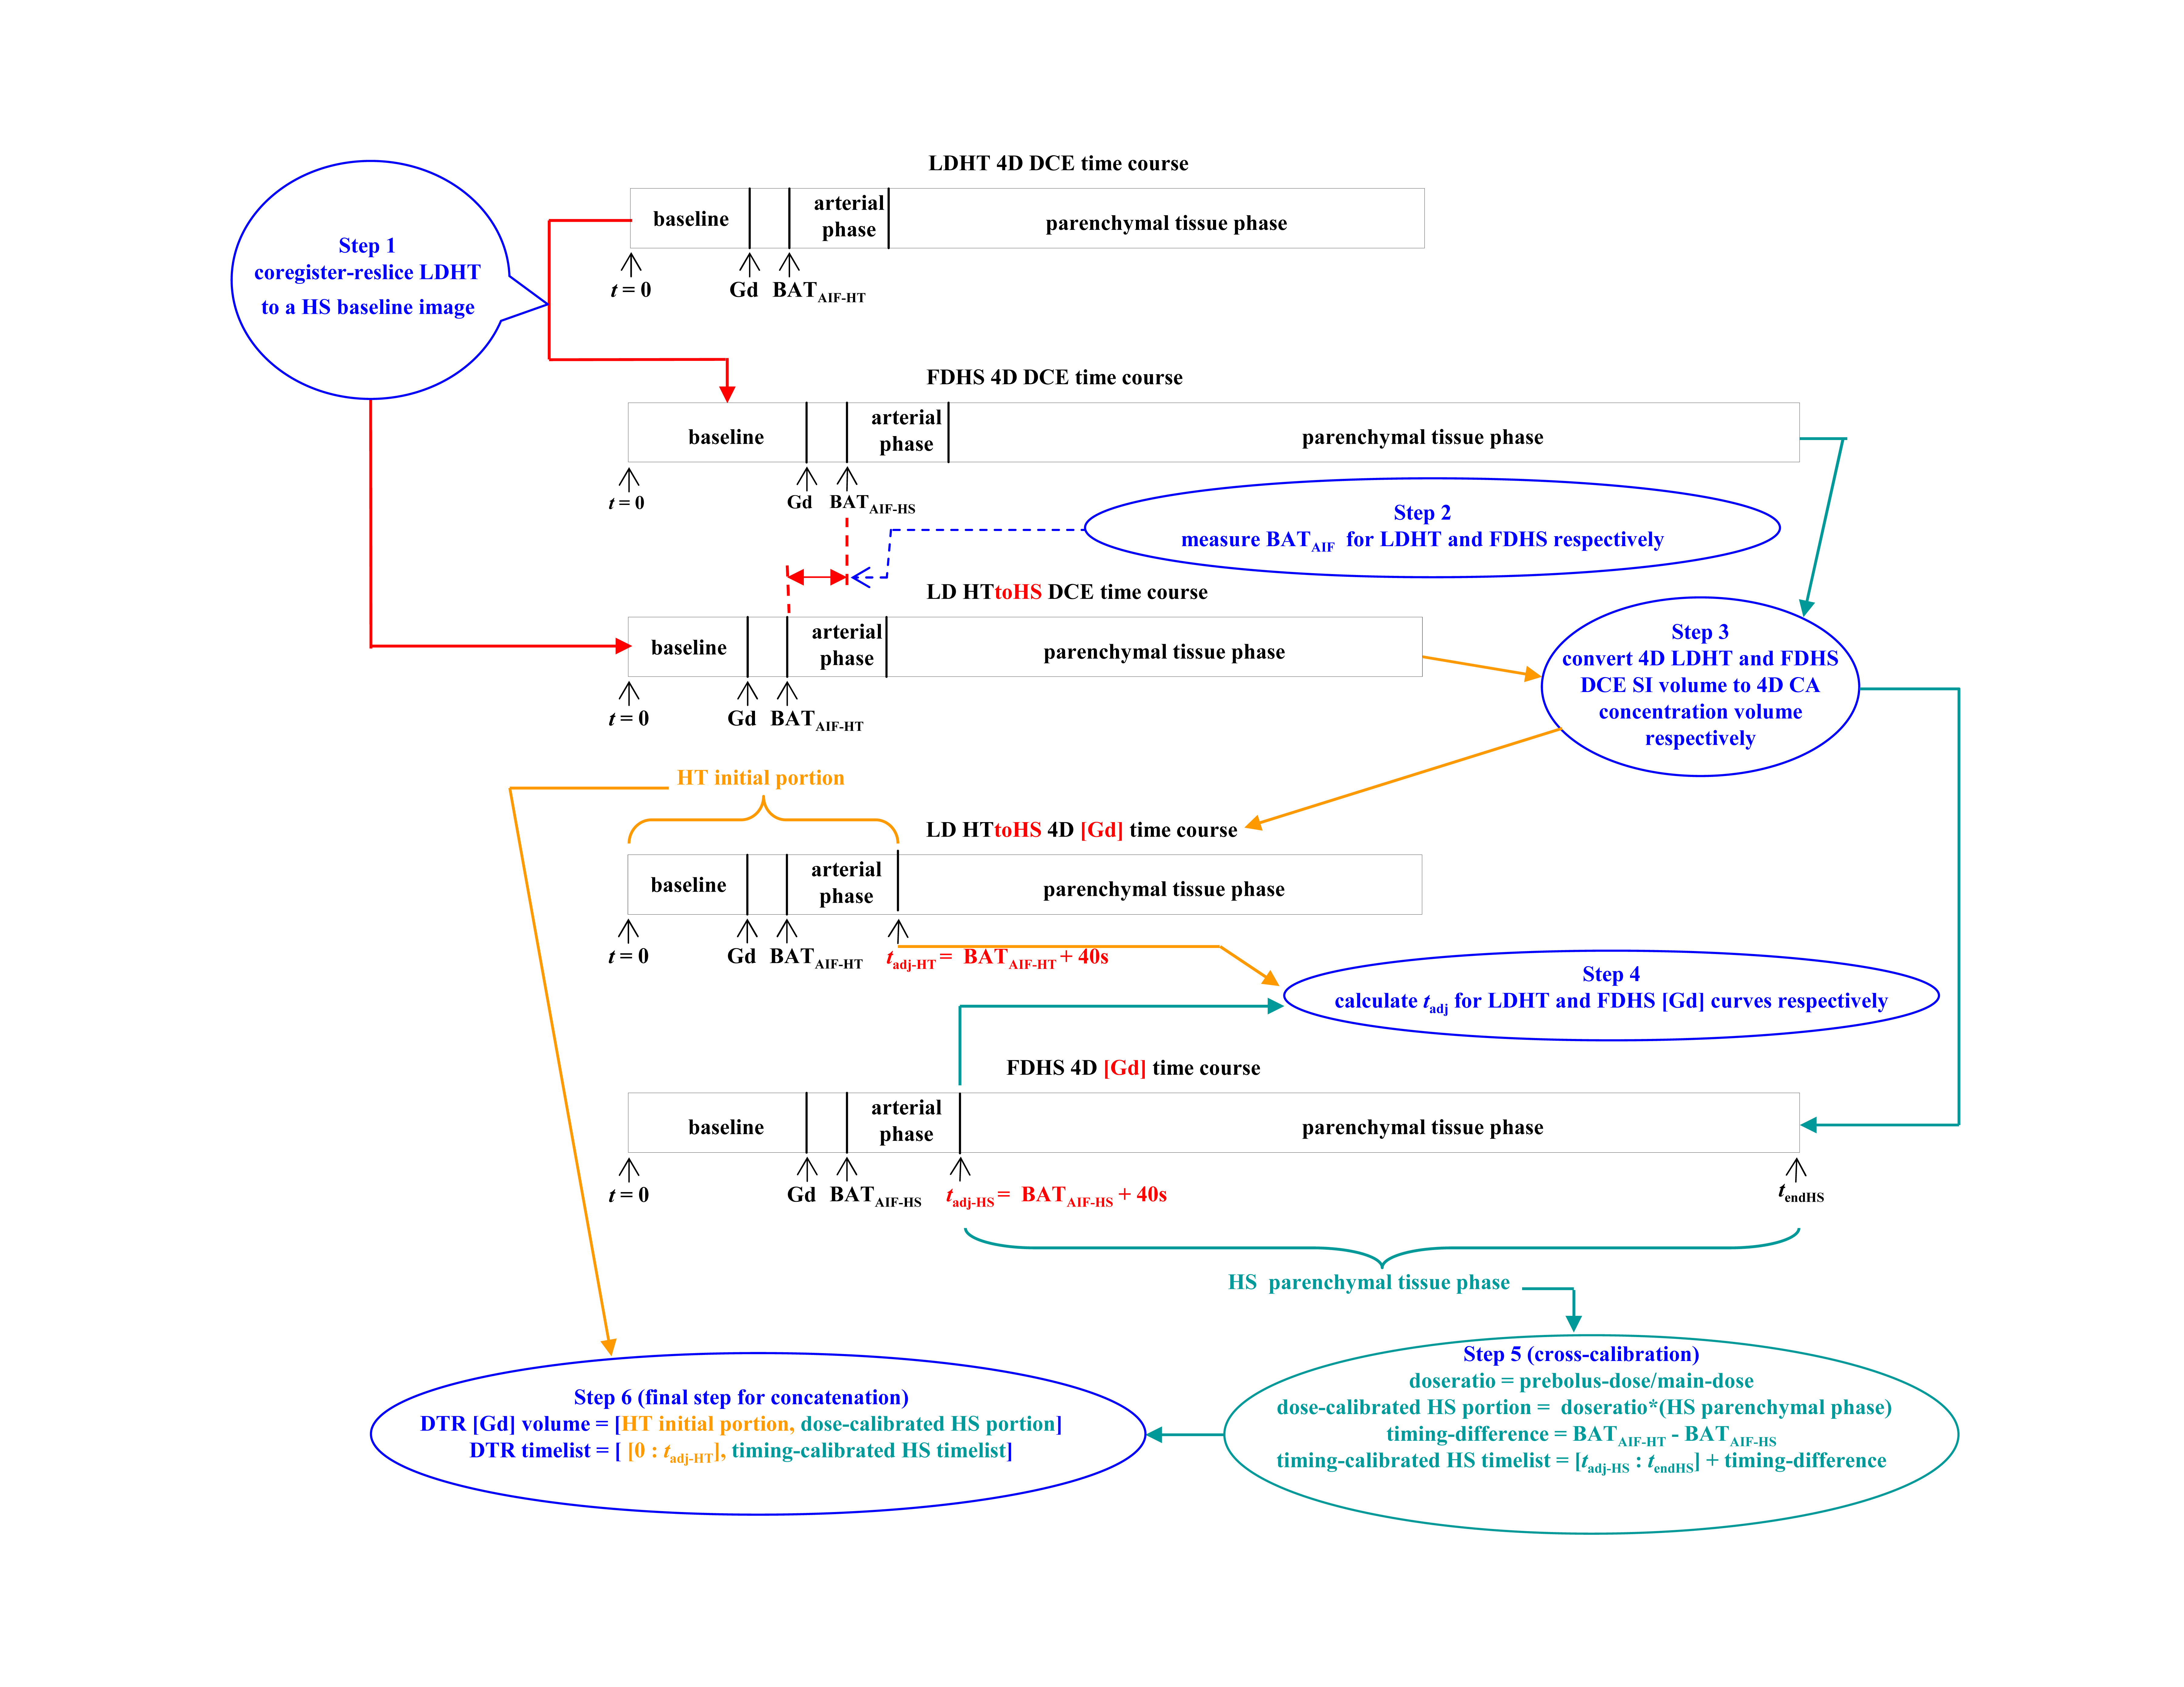
Key step I of our new DTR-based mapping technique is to construct a two-part 4D CA concentration ([Gd]) volume (HTHS-merged) from the high temporal, low spatial resolution and low temporal, high spatial resolution dataset. This construction can be done from either a dual-injection DTR or a single-bolus DTR MRI. Figure 1 illustrates the flow chart for construction of the DTR 4D [Gd] volume from dual-injection DTR MRI.
We hypothesized that kinetic analysis of the HTHS-merged 4D [Gd] volume would produce high spatial resolution Ktrans and ve maps with greatly improved accuracy. This was mainly because the high sampling rate at the start-to-rise location of the arterial input function (AIF) and the tissue response function (TRF) curves in the HTHS-merged 4D [Gd] volume allows more accurate measurement of the bolus arrival time (BAT) for both AIF and TRF2-3, thus reducing errors in the kinetic parameter estimates caused by temporal jitter uncertainty (TJU)4.
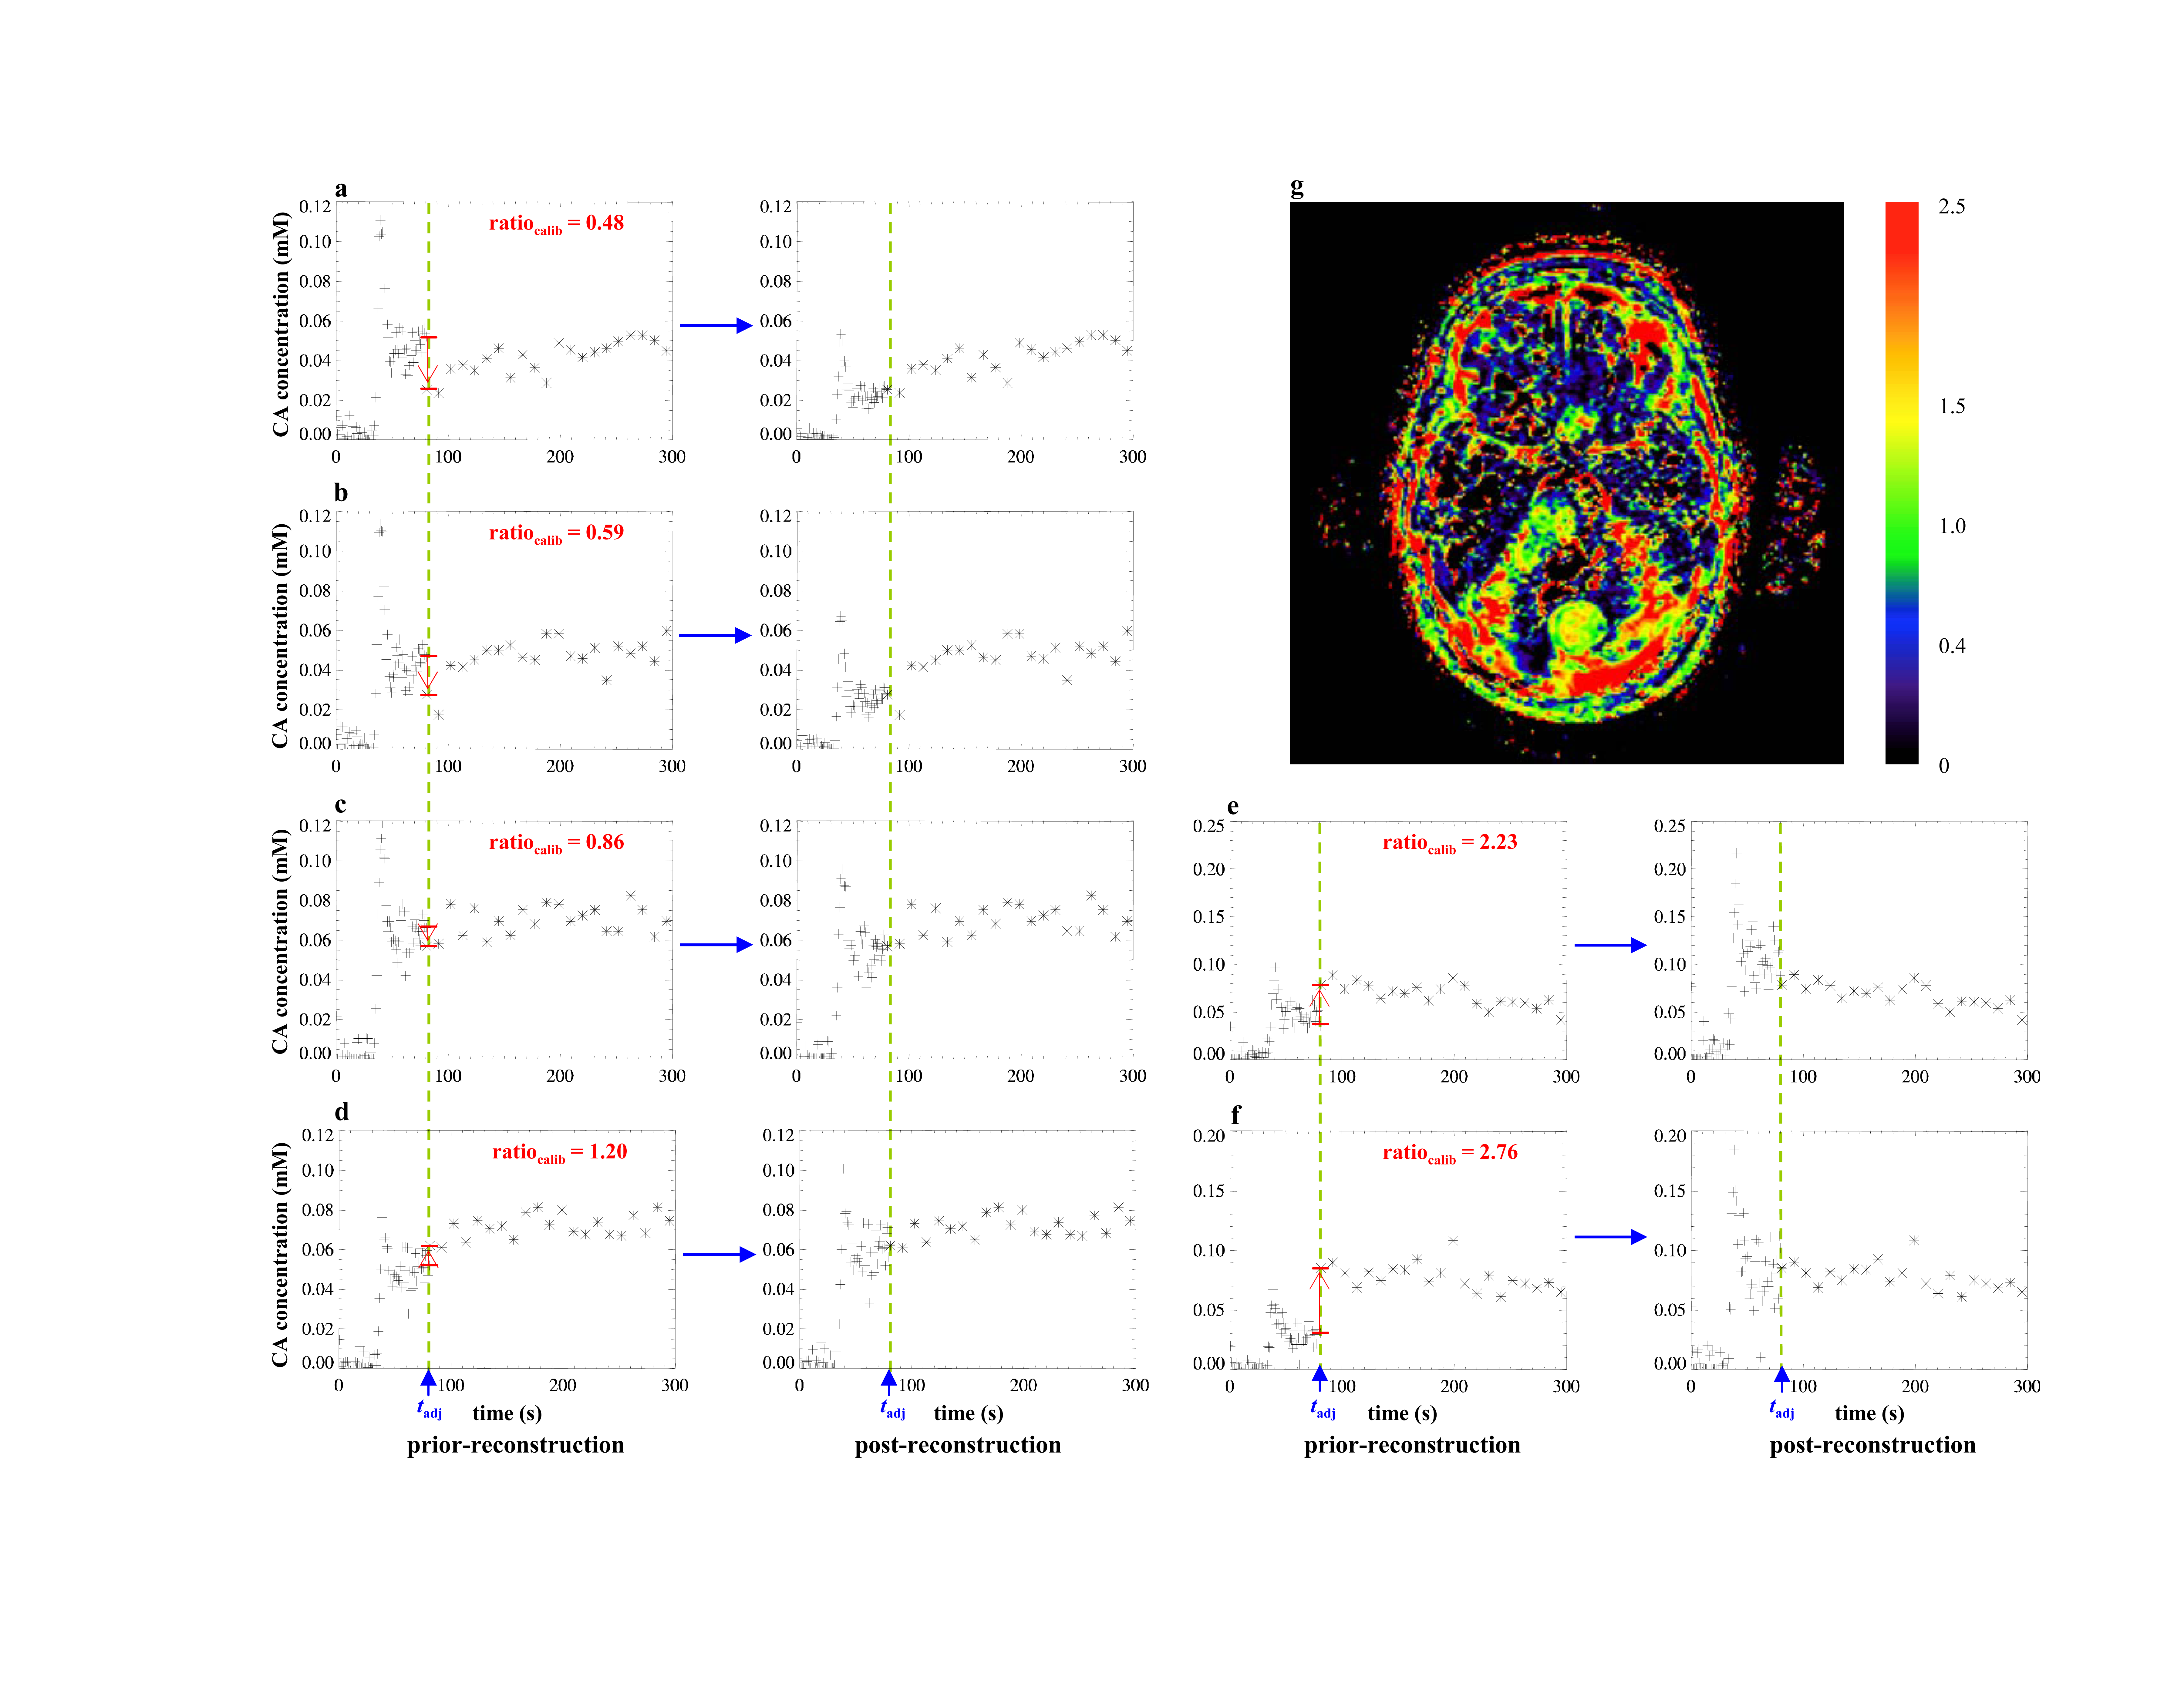
Derived vp maps from the HTHS-merged concentration volume, however, still closely resembled those from the LDHT data. Key step II of the new method is therefore pixel-by-pixel reconstruction of the HT first pass concentration curve to a higher spatial resolution before undertaking kinetic analysis through a process we term LEGATOS (LEvel and rescale the Gadolinium contrast concentrations curves of high-temporal TO high-Spatial DCE-MRI). Figure 2a – 2f show the pixel-by-pixel LEGATOS reconstruction procedure, and the map of the calibration ratio derived (Fig 2g).
Kinetic analysis
Kinetic parameter maps derived using the extended Tofts model (ETM)5 and the following different approaches were compared: the LDHT DCE method, the classical DICE-FDHS method1, and the HTHS-merged concentration volume, which was either directly fitted to the ETM (the HTHS-merged method), or reconstructed following the procedure described above in key step II prior to being fitted (the LEGATOS method).
Statistical Analysis
Estimates of Ktrans and vp derived using the DICE-FDHS1 and the LEGATOS method were compared with estimates derived from the LDHT dataset using scatterplot and linear regression analysis. The HT dataset was utilized for comparison as this method is thought to provide the most accurate kinetic parameter estimates.
RESULTS
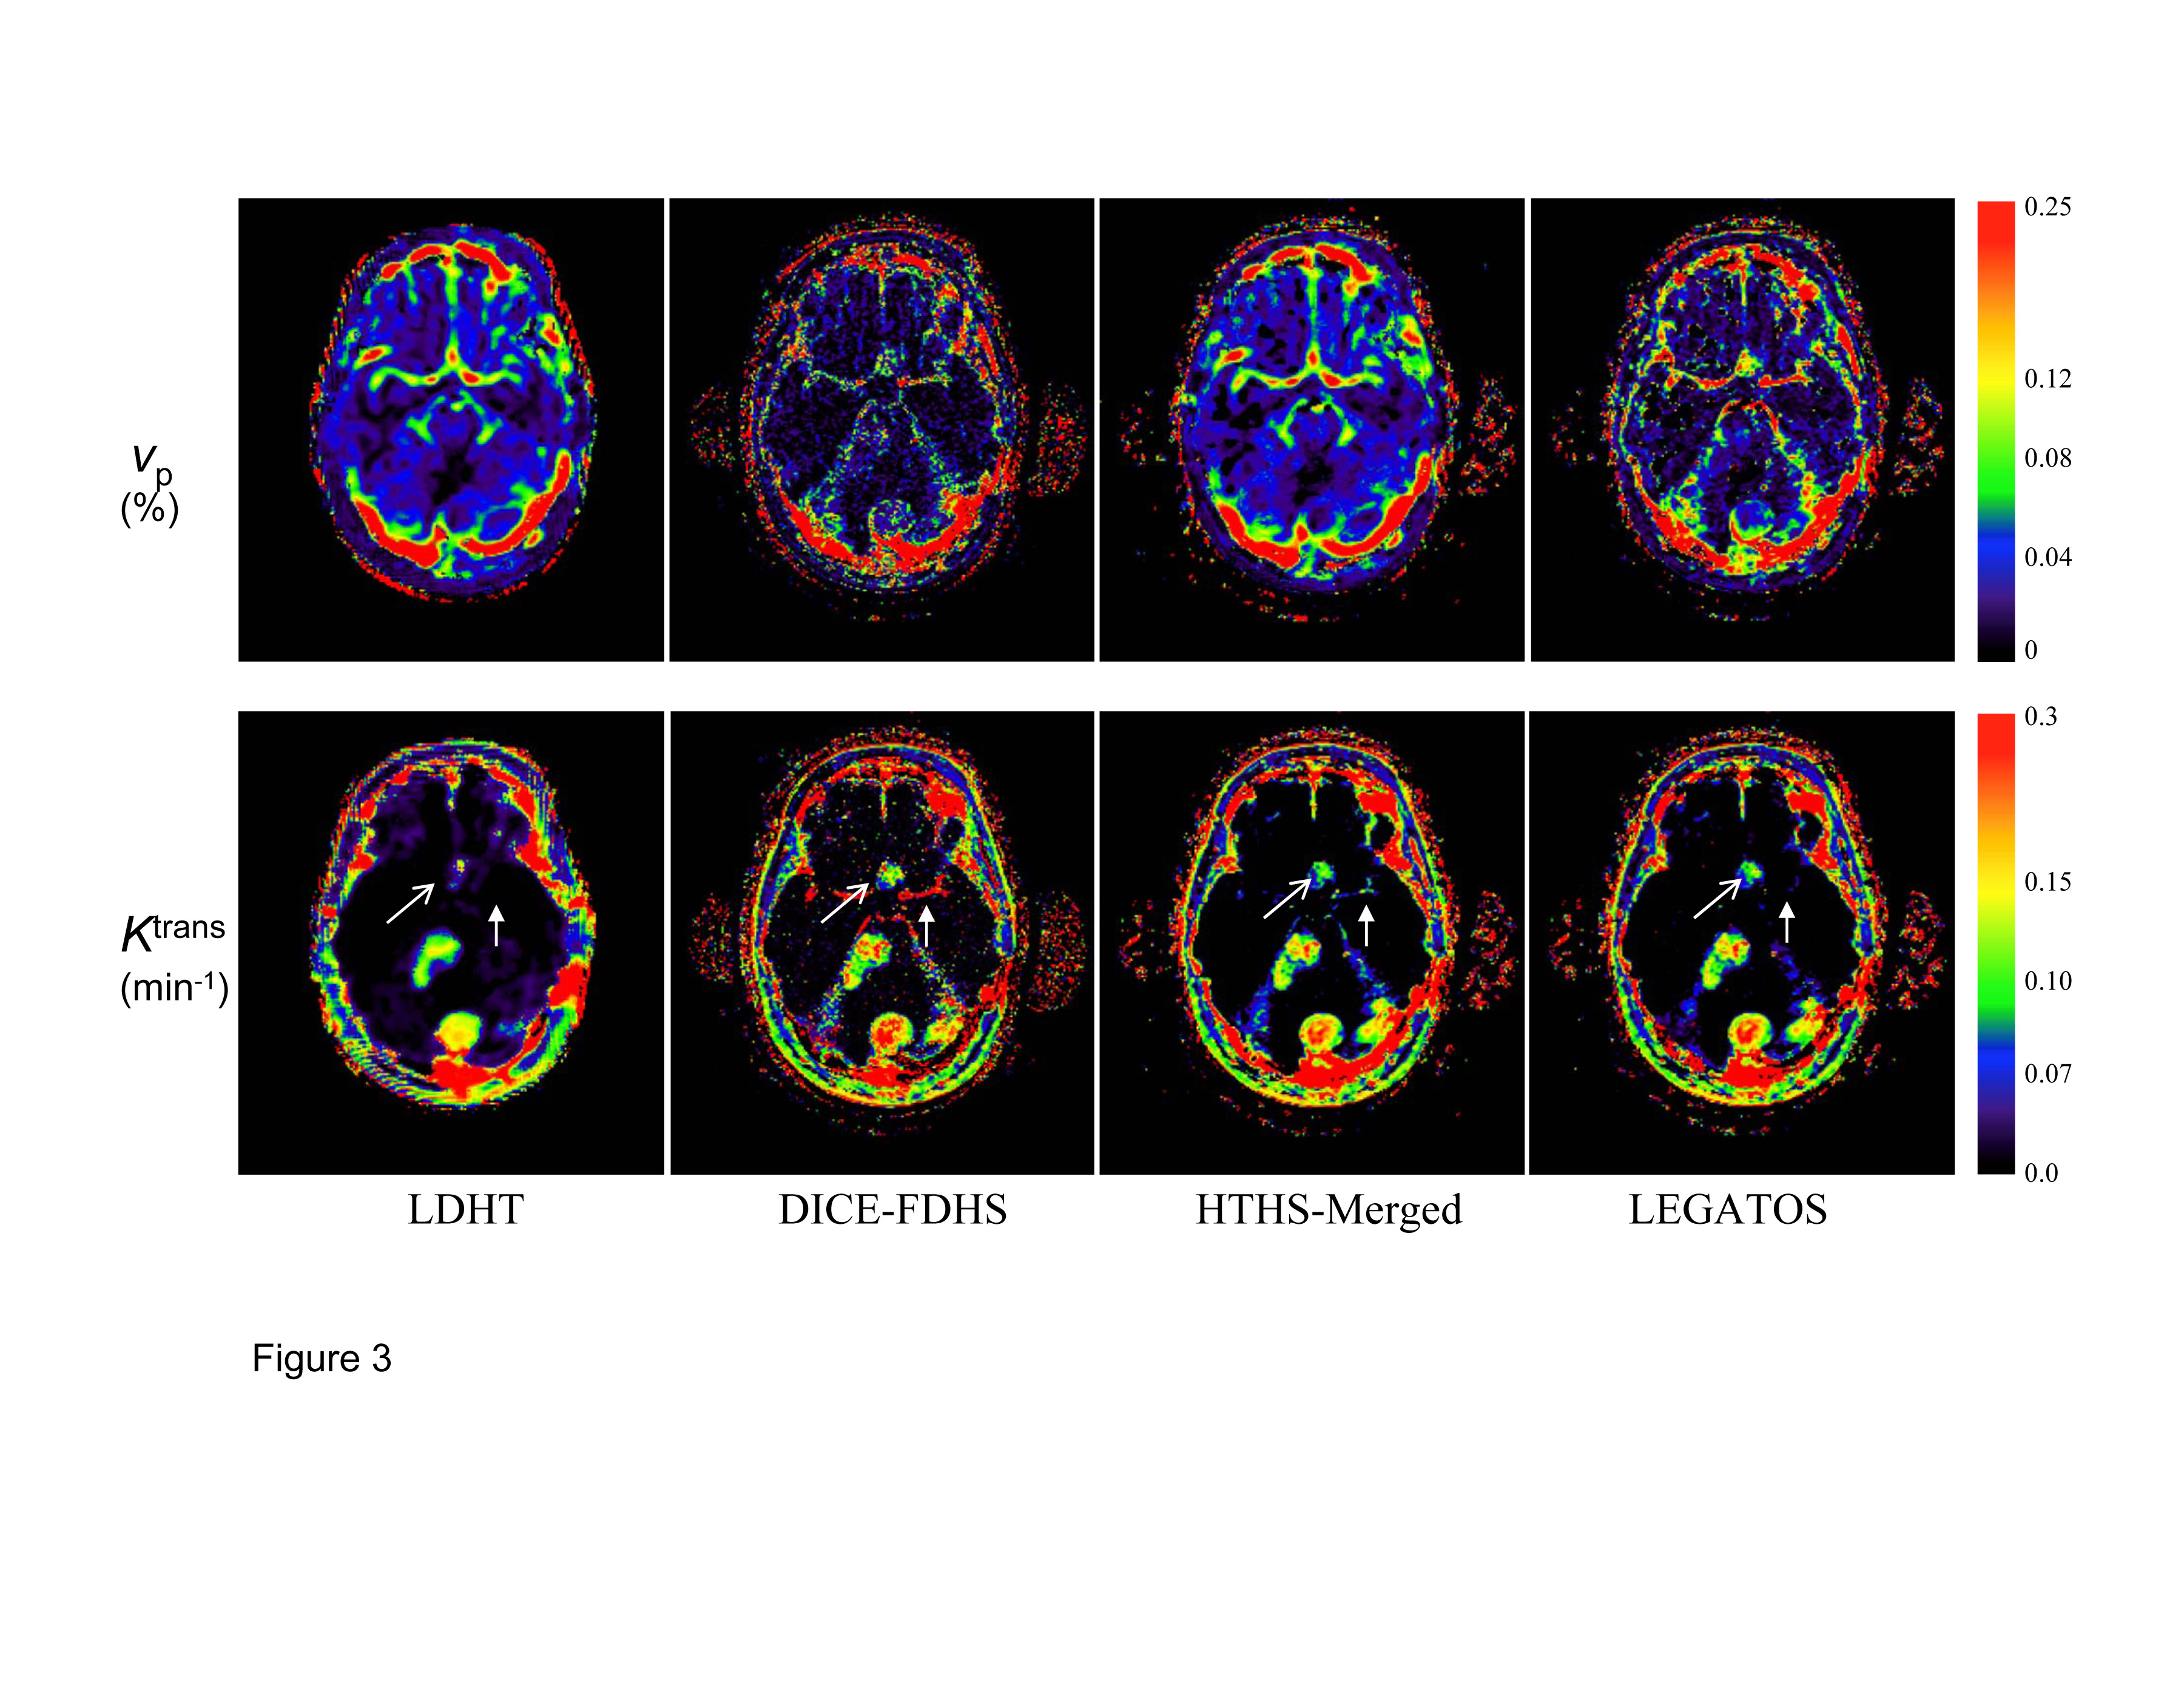
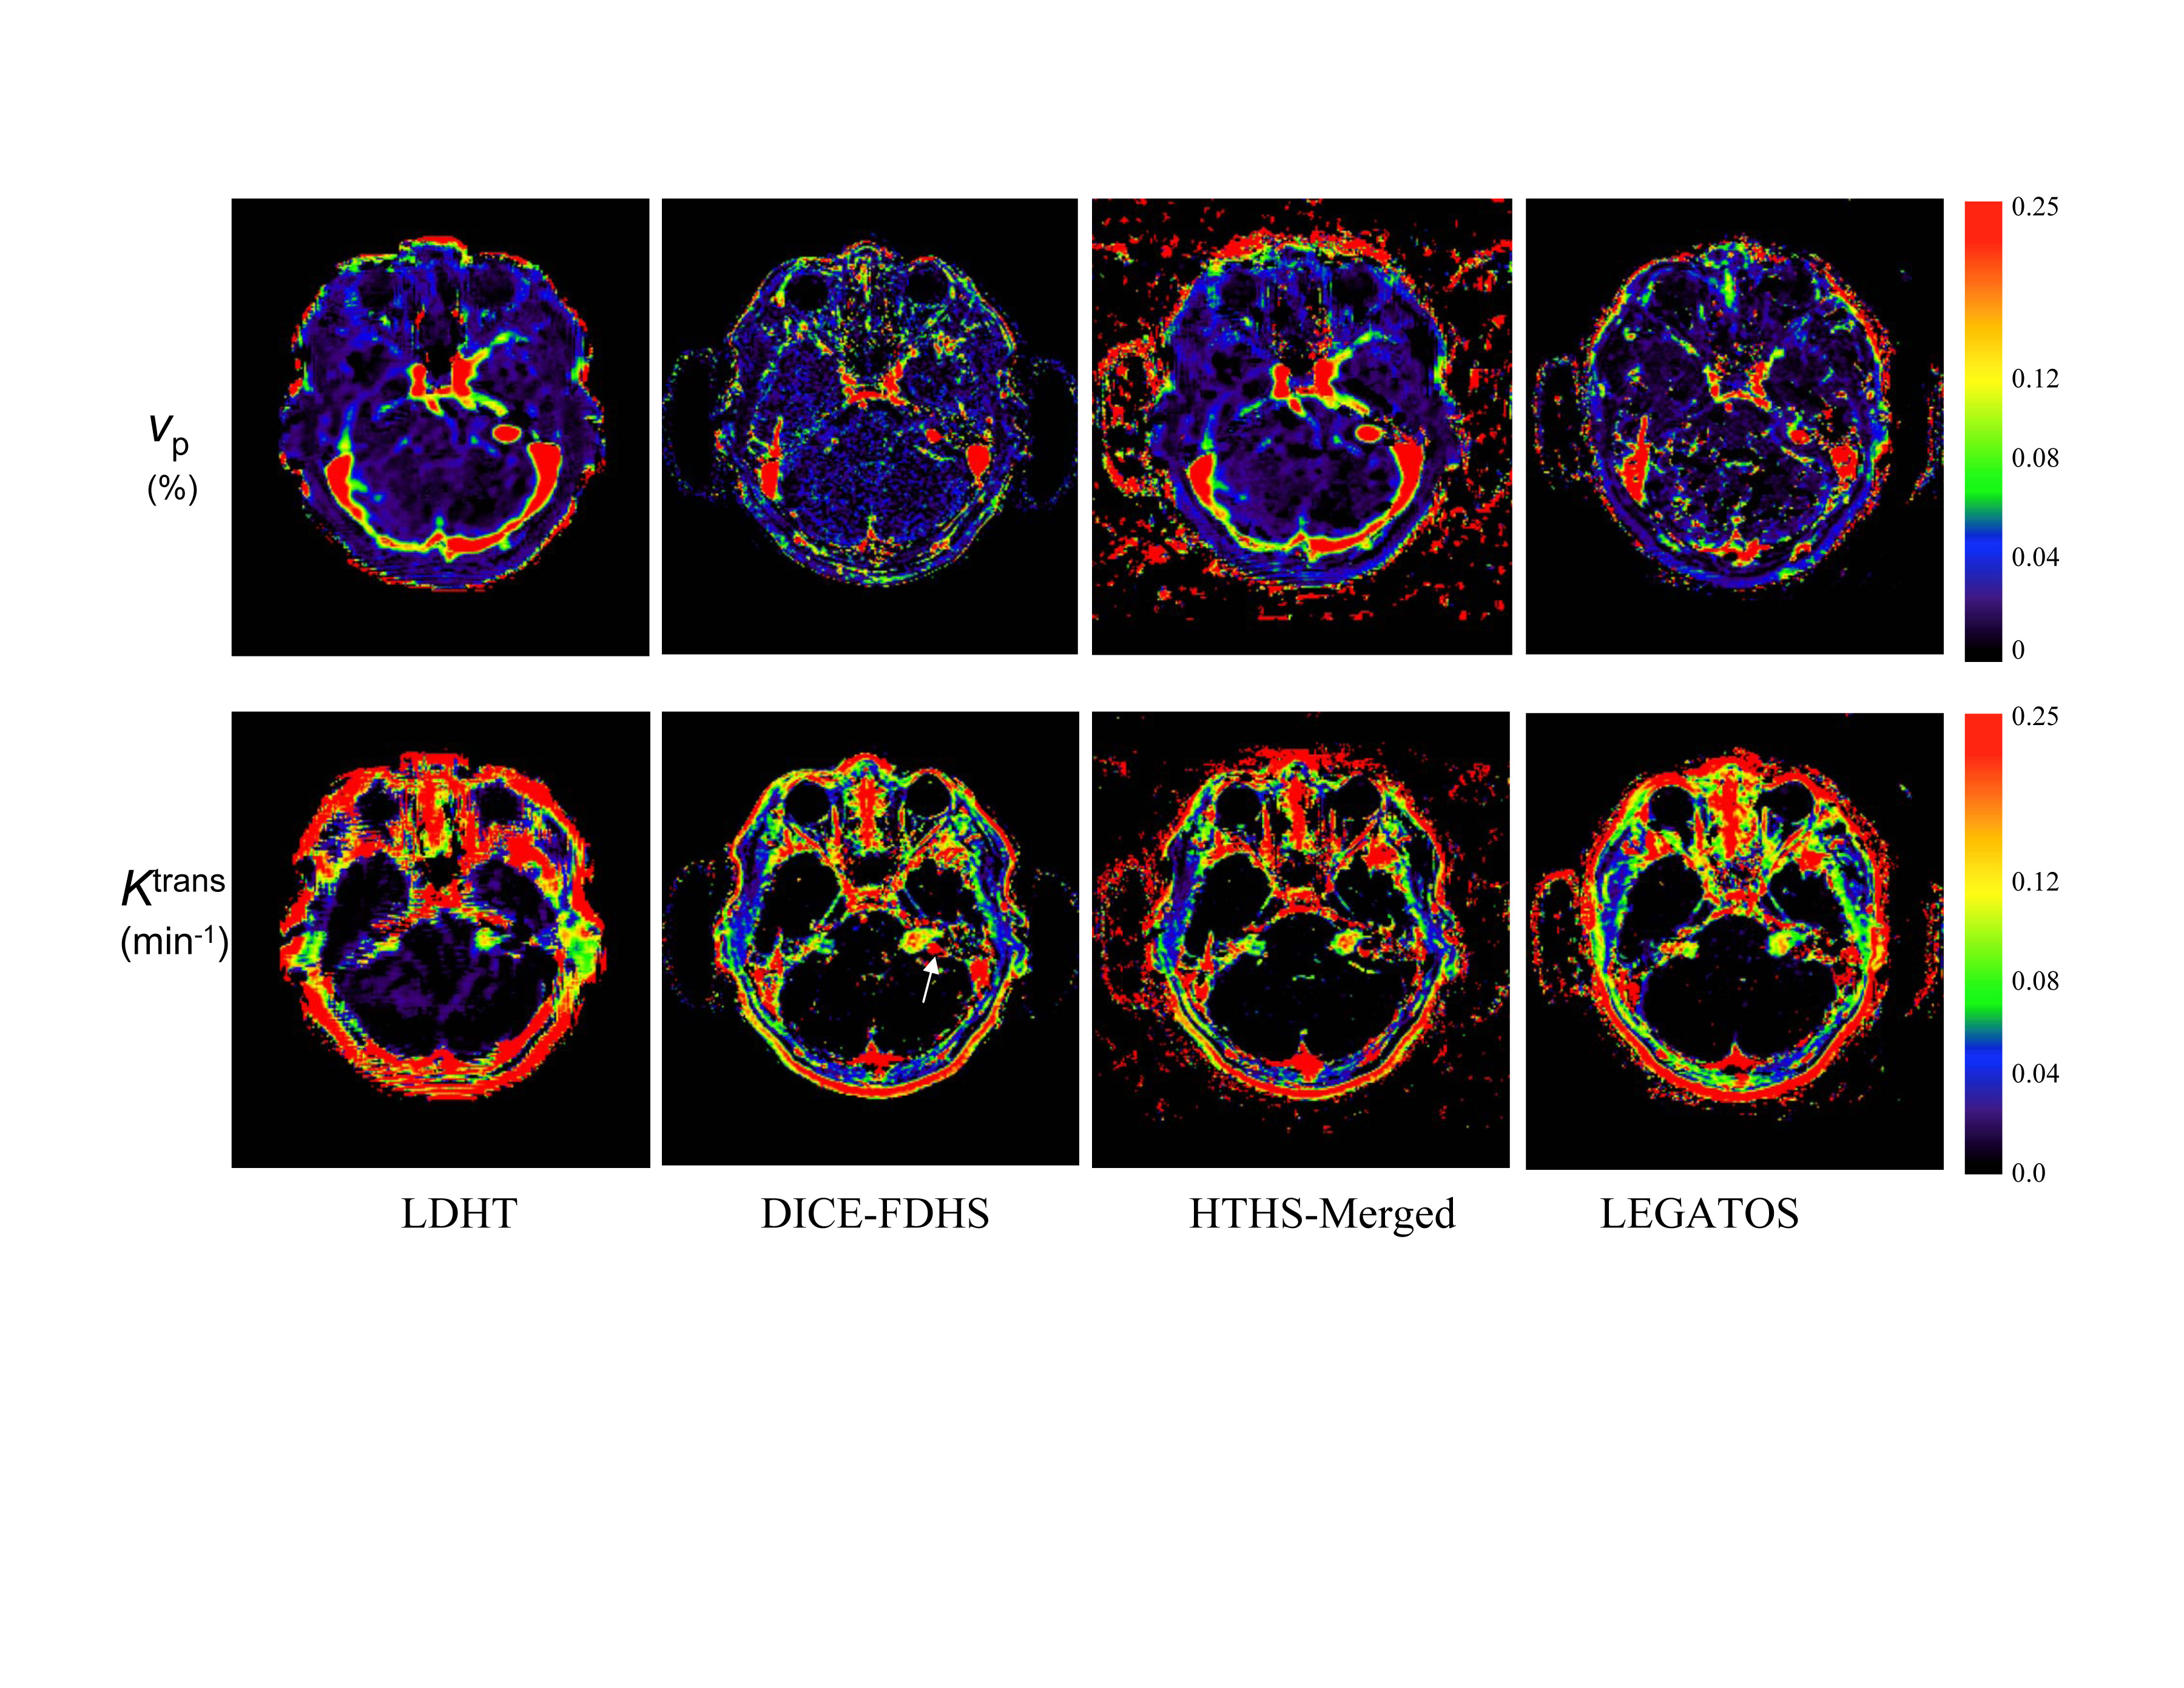
Figures 3 and 4 show images from two representative NF2 patients with comparative kinetic parameter maps derived using the LDHT, DICE-FDHS, the HTHS-merged, and the LEGATOS.
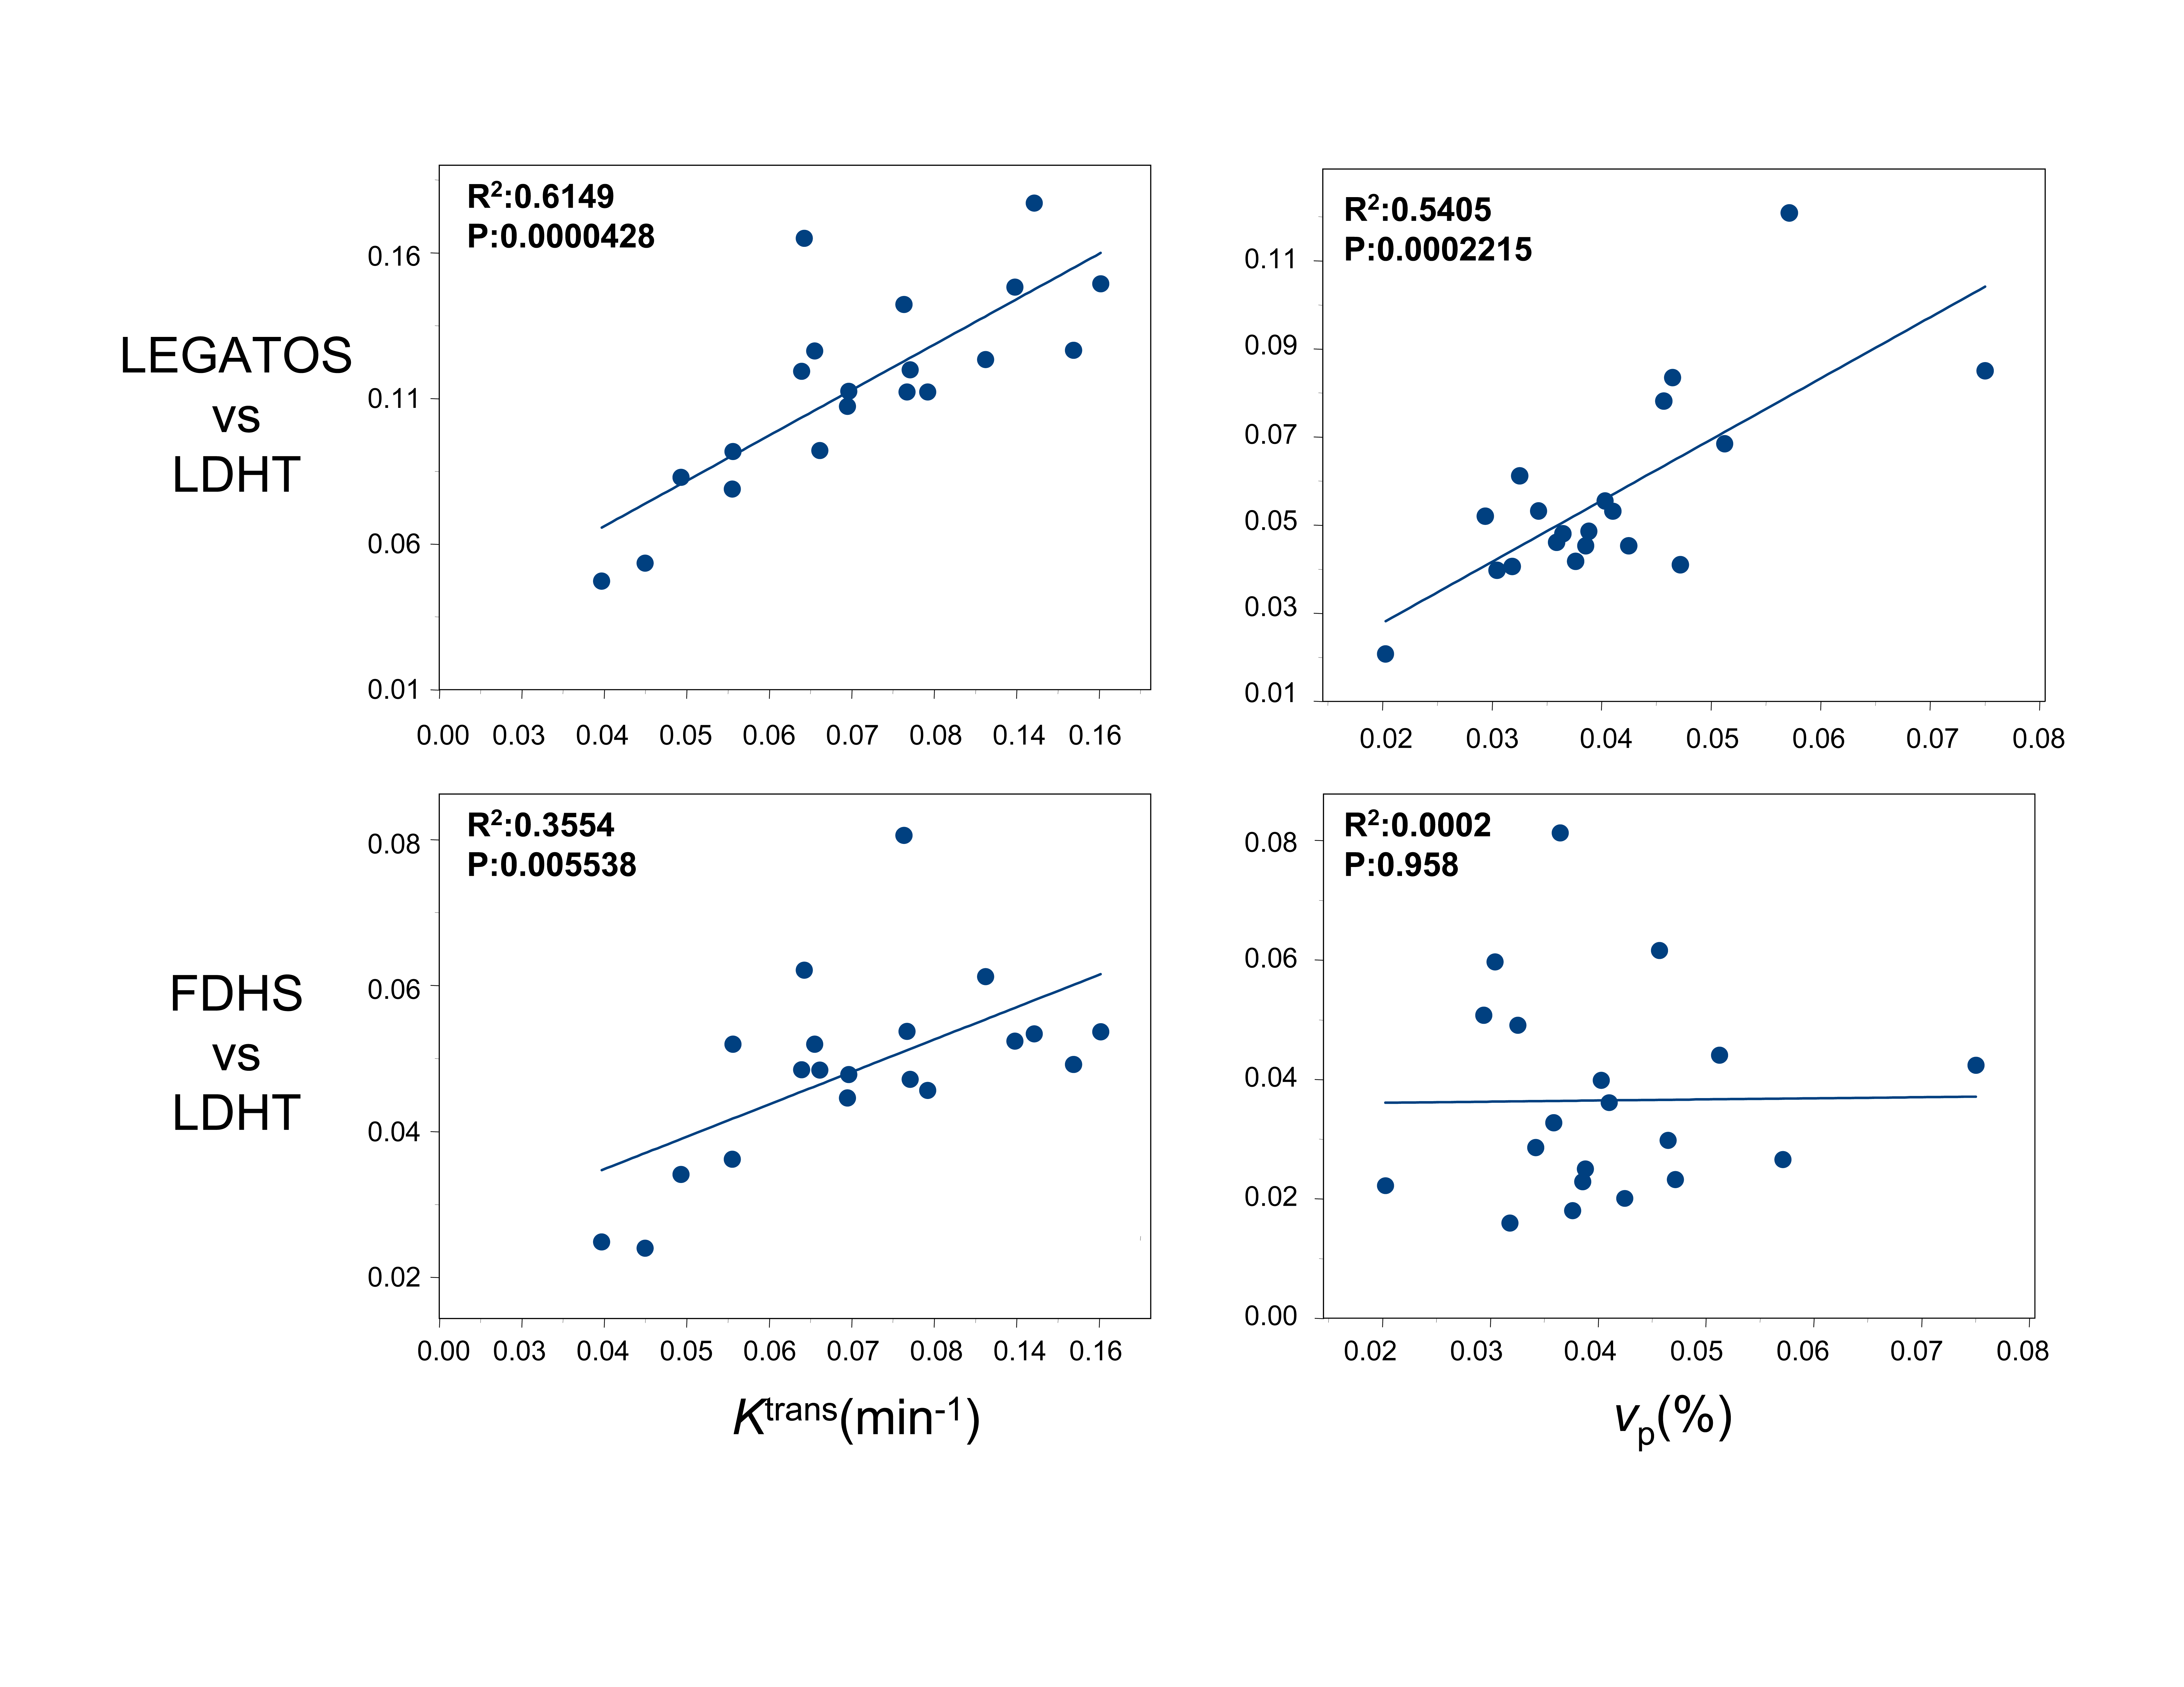
Figure 5 shows scatter plots of the mean tumor Ktrans and vp across the 20 vestibular schwannoma. As can be seen the correlation between LEGATOS and the LDHT derived parameters was much stronger than that between the DICE-FDHS and LDHT methods.
DISCUSSION
Reductions of errors in kinetic parameter estimates caused by TJU are permitted through use of a HT-HS combined 4D [Gd] volume. Reconstruction of the HT arterial phase curves in the HTHS-merged [Gd] volume using the new LEGATOS method allows derivation of high spatial maps, including vp, permitting both superior visualisation of small lesions and intratumour heterogeneity and accurate separation of the intra- and extra-vascular components of the [Gd] enhancing courses. The correlation between LEGATOS and the LDHT derived parameters was much stronger than that between the DICE-FDHS and LDHT methods.
CONCLUSION
The LEGATOS technique has shown to be an alternative way to provide high spatial resolution kinetic map with HT comparable accuracy and quality.
Acknowledgements
No acknowledgement found.References
1. Li KL, Buonaccorsi G, Thompson G, et al. An improved coverage and spatial resolution--using dual injection dynamic contrast-enhanced (ICE-DICE) MRI: a novel dynamic contrast-enhanced technique for cerebral tumors. Magn Reson Med 2012;68(2):452-462.
2. Cheong LH, Koh TS, Hou Z. An automatic approach for estimating bolus arrival time in dynamic contrast MRI using piecewise continuous regression models. Phys Med Biol 2003;48(5):N83-88.
3. Singh A, Rathore RK, Haris M, Verma SK, Husain N, Gupta RK. Improved bolus arrival time and arterial input function estimation for tracer kinetic analysis in DCE-MRI. J Magn Reson Imaging 2009;29(1):166-176.
4. Henderson E, Rutt BK, Lee TY. Temporal sampling requirements for the tracer kinetics modeling of breast disease. Magn ResonImaging 1998;16(9):1057-1073.
5. Tofts PS. Modeling tracer kinetics in dynamic Gd-DTPA MR imaging. J Magn Reson Imaging 1997;7(1):91-101.
Figures