4407
Global relaxometry and volumetry of the brain using synthetic MR: possible implications for the neurobiology of human brain ageing in healthy adults1Beijing Hospital, Beijing, China, 2GE Healthcare, Beijing, China
Synopsis
Synthetic MR is an emerging technique capable of providing quantitative relaxation maps and conventional contrast weighted images simultaneously. This study aims to study the relaxation and volumetric characteristics in the ageing process with synthetic MRI. We found volume is a primary metrics for assessing brain ageing and relaxometry may provide additional quantitative biomarkers and possible implications for studying brain ageing.
INTRODUCTION
Ageing process of human brain accompanies significant structural and biochemical changes, in both gray matter (GM) and white matter (WM). Relaxometry and volumetry characterization of the ageing process may lead to the pathway of detecting atypical alternations in the ageing process with high sensitivity and specificity [1,2,3]. Such efforts were hindered by the practical difficulties in obtaining the desired information within clinically acceptable scan time. Synthetic MR is an emerging imaging technique that may simultaneously provide both conventional contrasts weighted imaging and quantitative relaxation maps. In this study, synthetic MRI was used to explore the relaxation and volumetric characteristics of the brain at different ages, and to evaluate the feasibility and efficiency of quantitative biomarkers in the process of brain ageing.METHODS
A total of 112 healthy volunteers (55 men, 57 women, 56.6 ± 20.3 years of age, range 20~91 years of age) were enrolled in this study. Local ethical approval and consent forms were obtained. The participants were divided into four age groups (20~40 years, 40~60 years, 60~80 years, and 80+ years). All the participants underwent MR exam that consisted of routine sequences and synthetic MR (MAGnetic resonance Imaging Compilation, MAGiC) on a 3.0T whole body MR system (Pioneer, GE Healthcare). MAGiC was performed with the parameters as follows: FOV 240mm * 240mm, matrix 320 * 256, slice thickness/gap 5/1mm. The acquired MAGiC data was further processed with SyMRI version 8.04 (SyntheticMR, Sweden) to generate relaxation maps, partial volume maps of while matter (WM) and gray matter (GM). Volumetric characteristics of brain parenchyma fraction (BPF), myelin water fraction (MYF), white matter fraction (WMF), and gray matter fraction (GMF) were also acquired. The average relaxation parameter of WM and GM was obtained from regions with partial volume exceeding 90% of WM and GM respectively. Kruskal-Wallis test was used to compare the differences in volumes and relaxation parameters among the four groups. Pearson correlation coefficients were calculated to explore the correlations of quantitative relaxation and volume with age. The relations of volume and relaxation change with age and sex were assessed by regression analysis.RESULTS
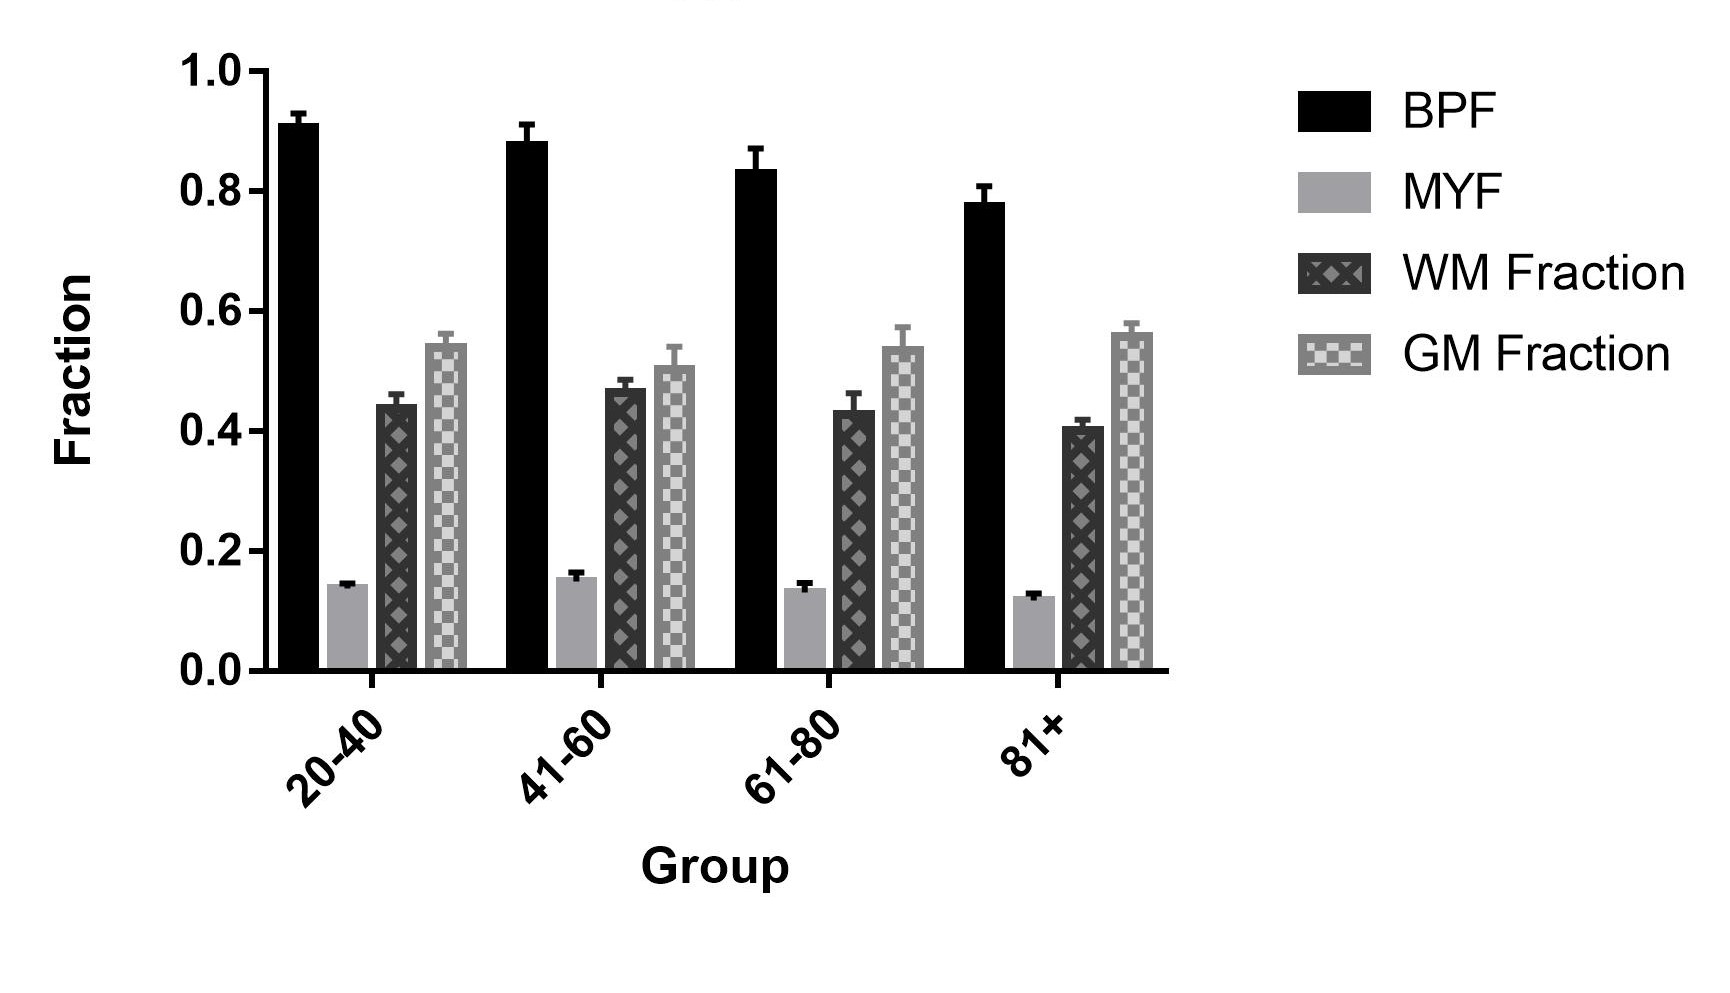
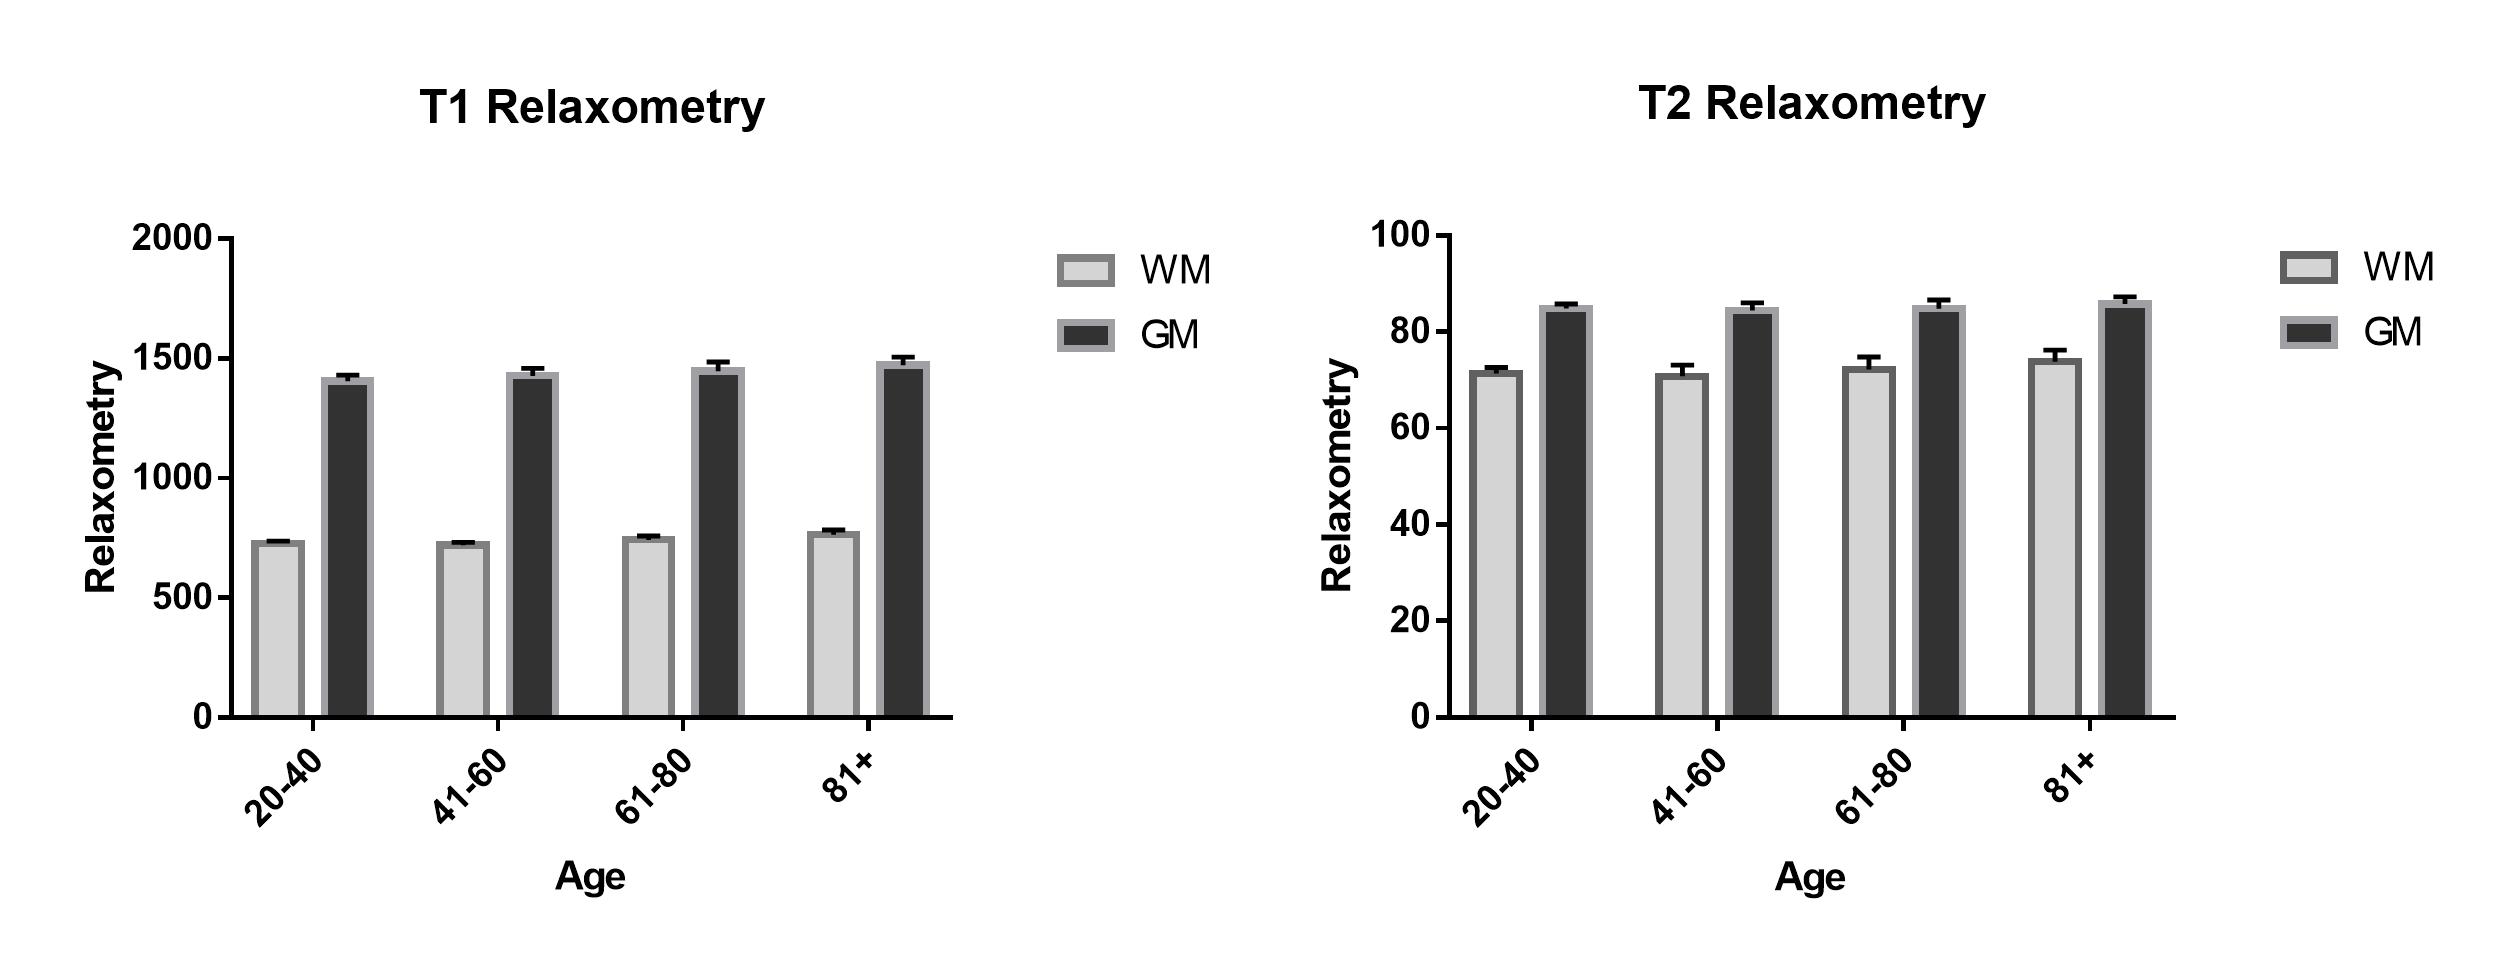
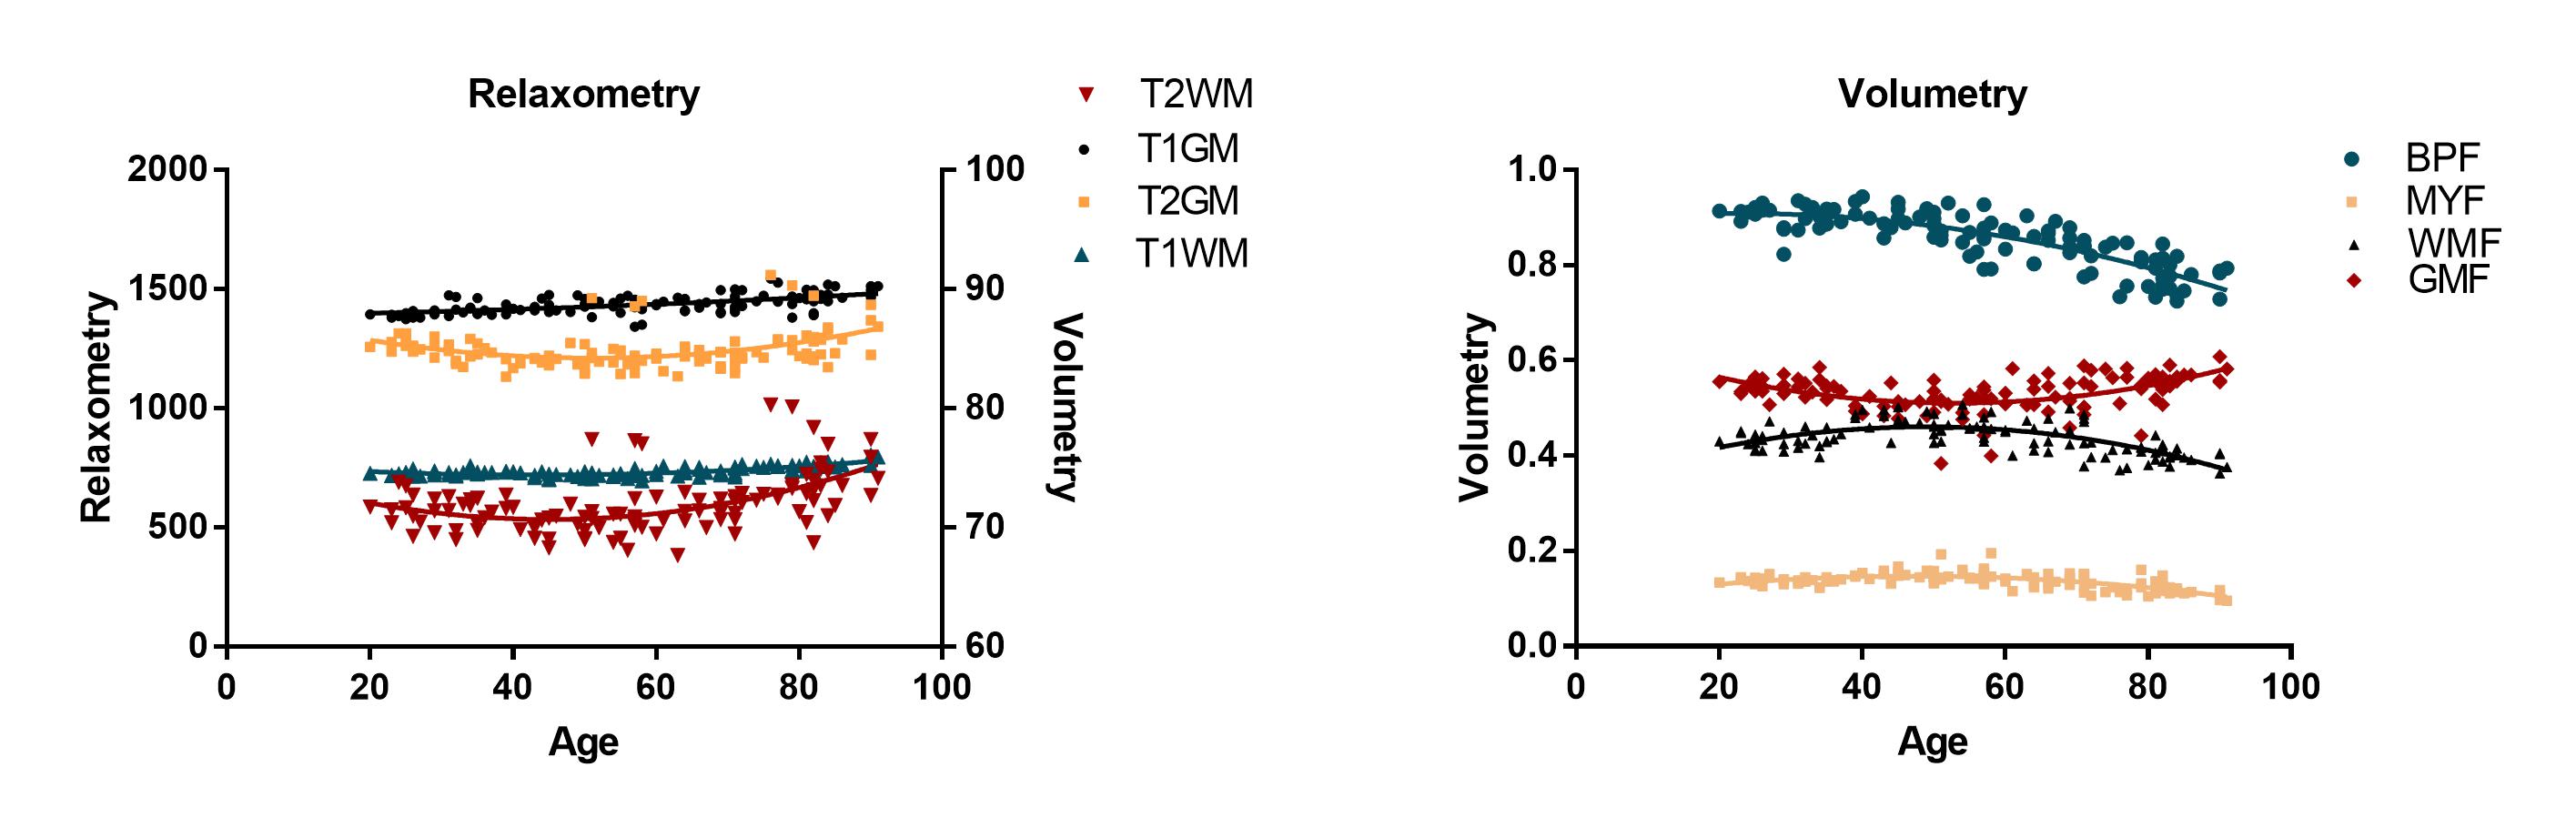
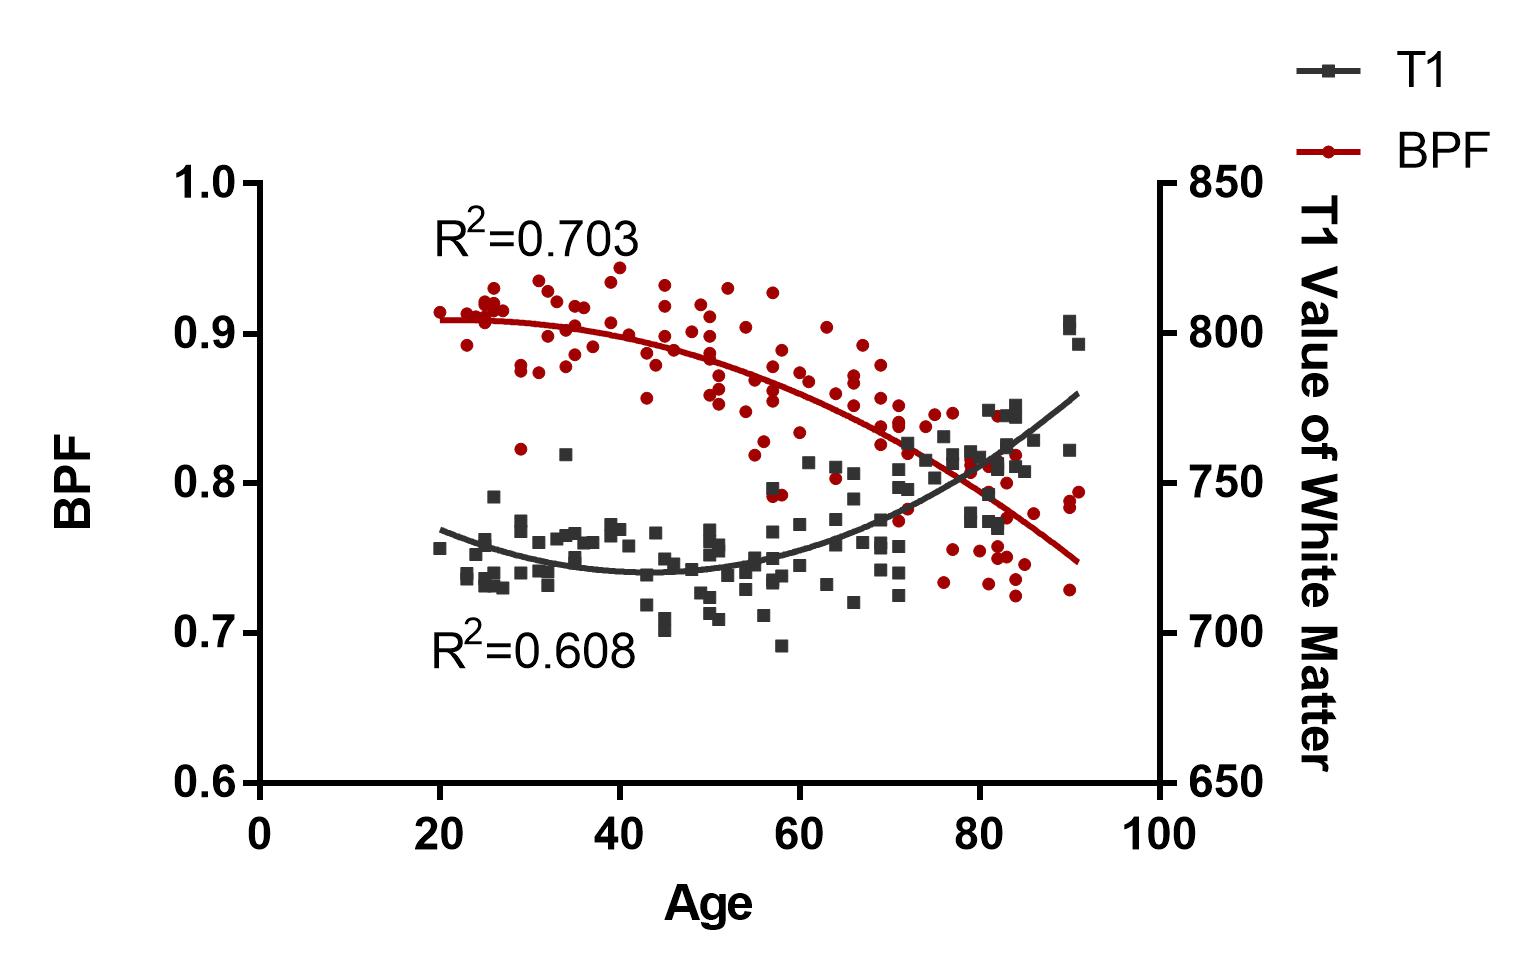
Figure 1 shows representative images of relaxation maps from synthetic MRI of different age groups. Significant differences were observed in BPF (p<0.001), MYF (p<0.001), WMF (p<0.001) and GMF (p<0.001), as shown in Figure 2. The average T1 and T2 relaxation of the WM and GM also exhibit significant difference (p<0.001 for all) (Figure 3). In volumetry analysis, moderate to strong correlation were observed in MYF (r=-0.448, p<0.001), BPF (r=-0.811, p<0.001) and WMF (r=-0.409, p<0.001) with the age. In relaxometry analysis, Pearson correlation coefficients of the average T1 relaxation of the WM and GM with age were 0.632 and 0.603 respectively(p<0.001, p<0.001). T2 relaxation of the WM and GM were also correlated with the age (r=0.397, P<0.001; r=0.188, P=0.047)(Figure 4).The BPF and T1 relaxation of the WM followed a second order polynomial curve (R2=0.703 and 0.608)(Figure 5). BPF decreased with the age while T1 relaxation of the white matter reached its peak between 30 and 50 years of age, and then declined. Gender differences were observed in the BPF.DISCUSSION
In this study, the relaxometry and volumetry characteristics of human brain at different age groups were investigated. The observed relaxation times obtained using synthetic MRI were in line with previous reports [1]. Strong correlations are observed for both relaxation and volumetric characteristics with age. Among different potential biomarkers, T1 of BPF and WM were seen to have the strongest correlation with age, consistence to the study by Hagiwara A [4]. Synthetic MRI may be a potential tool to explore the brain development related changes, as comprehensive measures including both relaxemotry and volumetry may be simultaneously obtained. With the expansion of patient data base and continued longitudinal acquisitions, new insight information of the ageing process may be obtained with synthetic MRI in the future.CONCLUSION
Sythentic MRI has demonstrated potential in the relaxometry and volumetry characterization of age related differences in human brain.Acknowledgements
No acknowledgement found.References
1 Badve C, Yu A, Rogers M,et al. Simultaneous T1 and T2 brain relaxometry in asymptomatic volunteers using Magnetic Resonance Fingerprinting. Tomography. 2015;1(2):136-144.
2 Ganzetti M, Wenderoth N, Mantini D. Whole brain myelin mapping using T1 and T2 weighted MR imaging data. Front Hum Neurosci. 2014;8:1-14.
3.Rosenberg-Katz K, Herman T, Jacob Y, et al. Gray matter atrophy distinguishes between Parkinson disease motor subtypes. Neurology. 2013;80(16):1476-84.
4.Hagiwara A, Hori M, Yokoyama K, et al. Utility of multiparametric quantitative MRI model that assesses myelin and edema for evaluating plaques, periplaque white matter, and normal appearing white matter in patients with multiple sclerosis: a feasibility study. AJNR Am J Neuroradiol. 2017;38(2):237-242.
Figures