4406
Development of quantitative water content mapping in human brain at high magnetic field1Center for Environmental Measurement and Analysis, National Institute for Environmental Studies, Tsukuba, Japan
Synopsis
The method for quantitative water content mapping
of a human brain at high magnetic field was proposed. We demonstrated that B1-
is proportional to B1+ in a uniform area even on a nonuniform image
measured at 4.7T. B1-s of the reference phantom and a human brain
can be compared by measurable B1+s in uniform areas and water
content of human brain can be computed from that comparison. Our method was
validated in the experiments of the mixture phantom of H2O and D2O. Quantitative
water content maps of human brains were obtained by our method.
Introduction
MR images measured at high static magnetic field have advantages in high sensitivity and contrast. However, they suffer from non-uniform signal intensity (SI) due to B1 inhomogeneity. Both of transmission and reception fields that are represented as B1+ and B1-, respectively differ in spatial distribution at high field. While B1+ can be measured, B1- cannot be measured in human brains because it is always associated with SI. SI in an image of a human brain cannot be calibrated by an external 1H reference because the reception sensitivities of B1-s cannot be compared between a human brain and the reference. Then, quantitative water mapping in human brain is difficult at high field.
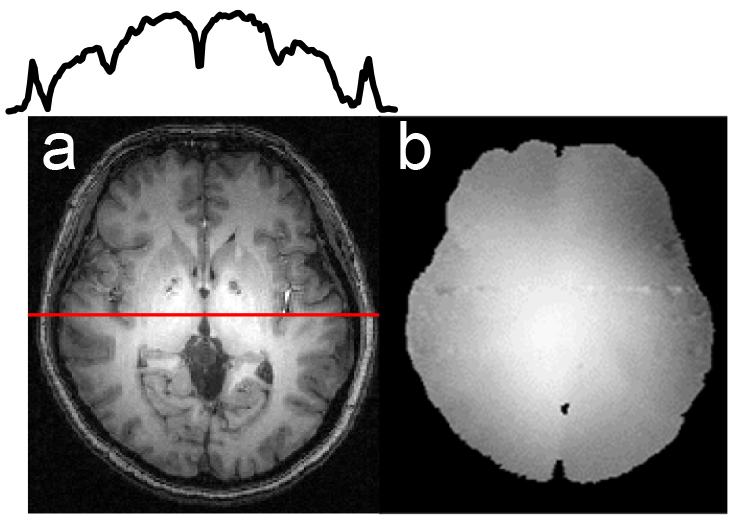
Figure 1 shows a T1 weighted image and a B1+ image of a human brain measured with a volume RF coil at 4.7T. Both images show uniform patterns only in the central area on that non-uniform image. While B1± can be expressed as [(B1xyMag2 ± B1xyPhase2)/2]1/2 where B1xyMag = [(B1x2+B1y2)/2]1/2 and B1xyPhase = B1xB1ysin(θx-θy),1 we thought that the phase term of B1xyPhase will be neglected and the equivalence between B1+ and B1- will hold in that uniform area. Then, unmeasurable B1- will be calculated by this relationship.
In this work, we will demonstrate that relationship between B1+ and B1- in the phantom experiments. We will also propose a method of quantitation of water content using this relationship and will map water content in human brains.
Methods
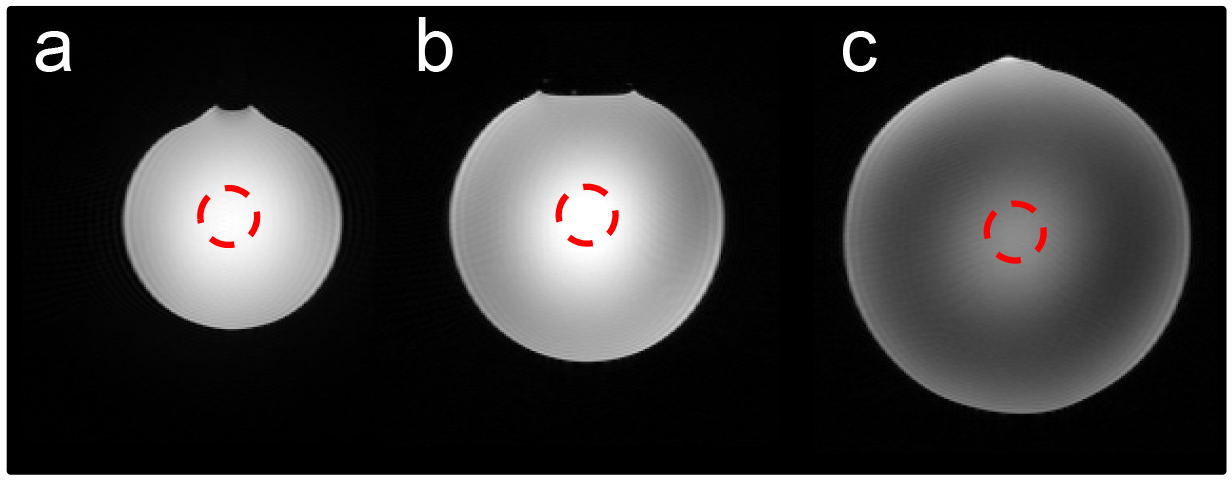
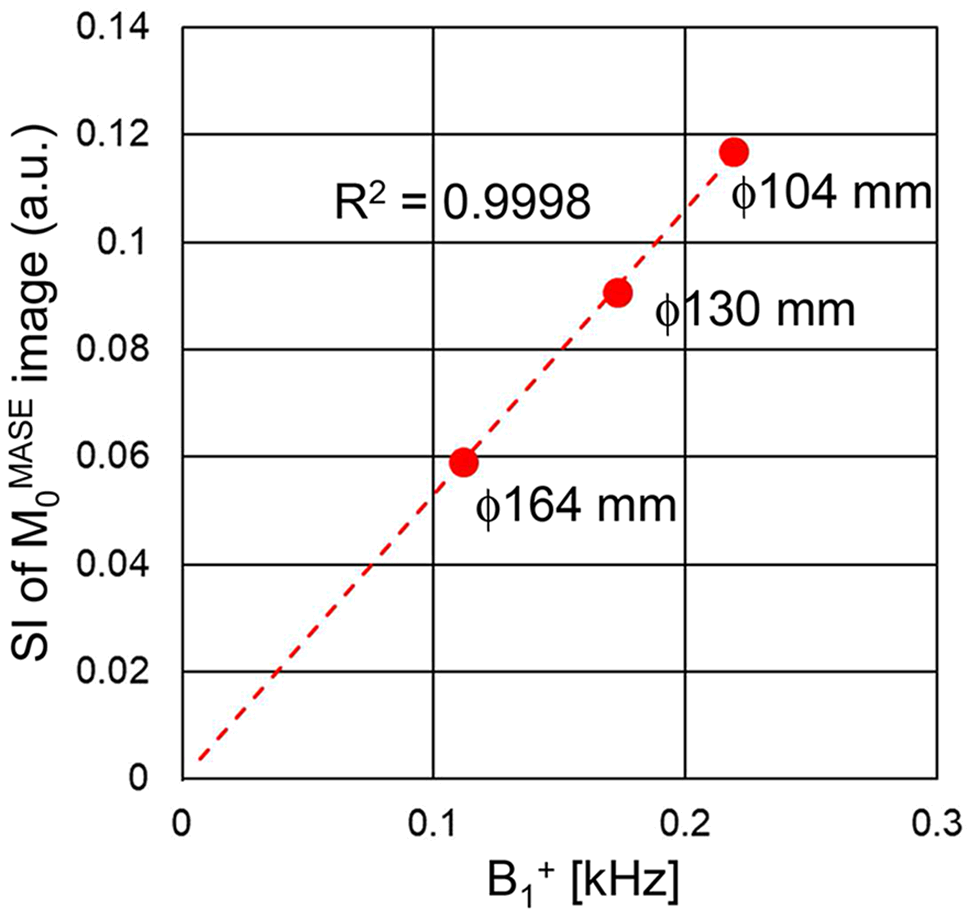
All experiments were performed using a 4.7T whole-body MR system (INOVA, Agilent) by using a volume QD TEM coil both for transmission and reception. To demonstrate the equivalence in B1 in the uniform area, we performed experiments with three saline spherical phantoms with 104-mm, 130-mm and 164-mm diameters adding 0.1% CuSO4. All B1+ maps were measured by the phase method2 under the same conditions of RF transmission power. For B1- measurement we used the multiecho adiabatic spin echo (MASE) sequence3 to avoid B1+ inhomogeneity with condition of TR/TE = 4000/26, 52, 78, 104, 156, 182 ms. By fitting a single exponential curve by the equation of SI = M0MASEexp(-TE/T2) in each pixel on the six MASE images, M0MASE and T2 maps were generated. Then, the magnitude values of B1+ and the SIs of M0MASE in the central uniform region were compared between three phantoms (Fig. 2).
The water reference phantom was measured before human studies. SI is proportional to water concentration and B1-. When B1- may be calculated from measurable B1+ in the uniform area, both B1-s of the reference and the human brain can be compared. Then, the water concentration in the human brain can be computed by that comparison. To validate this proposed method, we did experiments of the phantom with the water content adjusted to 0.846 by mixture of H2O (500.3 g) and D2O (100.5 g).
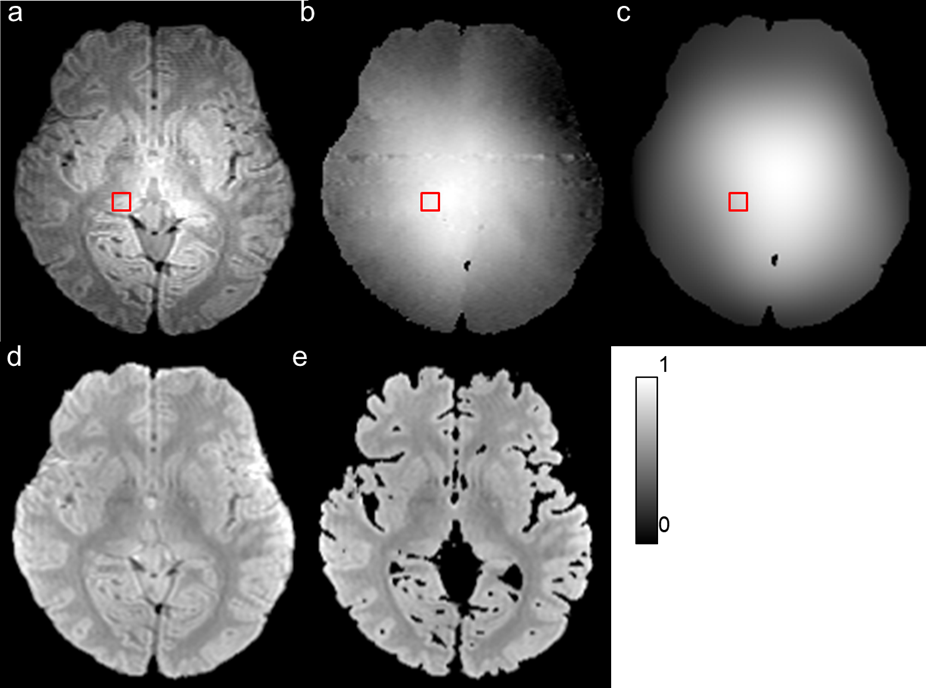
Human brain measurements were performed on five healthy female (38 ± 2.6 years) subjects. B1+ mapping and MASE imaging were also performed with T1 mapping by IR Turbo Flash sequence in all subjects. After curve fitting, T1 correction and B1- correction by the ration map method,4 M0MASE images were generated. The water content in the central area, shown as the red square in Fig. 4 was computed by the proposed method and the quantitative water content map of the human brain was generated.
Results & Discussion
Figure 3 shows the relationship between magnitude values of B1+ and SI of M0MASE images in the central area at 4.7T in all three phantoms. Significant linear relationship was shown with correlation coefficient of 0.9998 between phantoms having varied diameters. It means that B1- is proportional to B1+ in a uniform area in a sample at 4.7T. In the validation experiments of the mixture phantom, calculated water content was 0.832, close to the water content of 0.846. Figure 4a shows the M0MASE image of the human brain. The B1- map (Fig. 4c) was calculated from the B1+ map (Fig. 4b) by the ratio map method.4 After water content was calibrated in the central area shown as the red square in Fig. 4, quantitative water content map was generated (Fig.4 d, e). The fractions of water averaged on images measured from five subjects were 0.76 ± 0.01for gray matter and 0.60 ± 0.01 for white matter. The differences between reported values of 0.78 and 0.655 are less than 10 %.
Conclusions
Linear relationship exists between B1+ and B1- in a uniform area even at high field. Our proposed quantitation method using this relationship is useful for water content mapping of human brain at high field MRI.Acknowledgements
No acknowledgement found.References
1. Watanabe H. Investigation of asymmetric distributions of RF transmission and reception fields at high static field. Magn. Reson. Med. Sci. 2012; 11(2):129-135.
2. Lee Y., Han Y., Park H.W., Watanabe H., Garwood M., Park J.Y. New phase-based B1 mapping method using two-dimensional spin-echo imaging with hyperbolic secant pulses. Magn Reson Med 2015;73(1):170-181.
3. Mitsumori F., Watanabe H., Takaya N., Garwood M. Apparent transverse relaxation rate in human brain varies linearly with tissue iron concentration at 4.7 T. Magn. Reson. Med. 2007;58(5):1054-1060.
4. Watanabe H., Takaya N., Mitsumori F. Non-uniformity correction of human brain at high field by RF field mapping of B1+ and B1-. J. Magn. Reson. 2011;212(2):426-430.
5. Ernst T., Kreis R., Ross B.D. Absolute quantitation of water and metabolites in the human brain. I. compartments and water. J. Magn. Reson B. 1993;102(1):1-8.
Figures