4405
Single-point macromolecular proton fraction mapping at 7T in healthy and demyelinated mouse brain1Aix-Marseille Univ. CRMBM UMR 7339, Marseille, France, 2Université de Strasbourg, CNRS, ICube, FMTS, Strasbourg, France
Synopsis
Assessment of myelin content in the brain is essential for monitoring pathologies such as multiple sclerosis. Quantitative MRI methods including quantitative magnetization transfer imaging (qMTI) have been employed in animal and human studies to assess demyelination processes. Animal studies have reported high correlations between myelin content and the macromolecular proton fraction (MPF), a metric derived from qMTI. The single-point MPF mapping method requires the acquisition of a single MT-weighted image, hence reducing protocol scan duration. In this work, we propose the adaptation of this method at 7T in a study involving healthy and demyelinated mice.
Introduction
The macromolecular proton fraction (MPF) derived from quantitative Magnetization Transfer (qMT) imaging is a potential biomarker of myelin in brain tissues1,2. Methods to reduce the necessary amount of MT-weighted images for 3D-MPF mapping were previously proposed and adapted at 1.5T (humans only)3, 3T (humans and animals)3-8 and 11.7T (animals only)9. Yarnykh's single-point MPF (SP-MPF) method consists in estimating the MPF by constraining the values of other two-pool model parameters; $$$R$$$ (cross-relaxation rate constant), $$$T_{2,r}$$$ ($$$T_2$$$ of the restricted pool), and $$$R_{1,f}T_{2,f}$$$ (product of the relaxation quantities $$$R_{1,f}$$$ and $$$T_{2,f}$$$ of the free pool).
In this study we provide an optimized protocol for robust SP-MPF mapping at 7T, based on a comprehensive qMTI method of healthy and demyelinated mice.
Method
Experiments were conducted on a 7T preclinical scanner (Bruker BioSpec, Ettlingen, Germany), using a 86-mm volume Tx coil and a mouse head surface Rx coil. Male C57BL/6 mice (4 healthy vs. 3 cuprizone-fed with a respective mean weight of $$$28.1\pm2.1$$$ g and $$$23.2\pm0.9$$$ g) were scanned at 16 weeks of age. Demyelination was induced by cuprizone administration in standard chow (0.2%)10 for 8 consecutive weeks prior to scanning. During scans, animal respiratory rate and temperature were monitored and maintained at $$$100\pm10$$$ breaths-per-minute and $$$37.6\pm0.1~^\circ$$$C, respectively.
Table 1 shows the acquisition protocol. In T1 (Variable Flip Angle GRE), B1 (Actual flip angle imaging; AFI) and qMT (MT-GRE) protocols, a strong gradient spoiling was systematically included to crush the remaining transverse magnetization through diffusion effects, along with an appropriate RF spoiling increment11,12. B0 maps were acquired throughout the protocol to provide an additional correction in the qMT post-processing step. Axial FOV were tilted so that their respective edge was parallel to the corpus callosum along the genu-splenium line determined on a contrasted T2-weighted sagittal scan.
All images were denoised using BM4D13 and subject-wise rigidly registered onto the 10-degrees volume of the $$$T_1$$$ mapping protocol using ANTs14. Partial brain extraction (from genu to splenium) were manually performed using ITK-Snap. Finally, $$$T_1$$$ maps were estimated using an in-house implementation, and qMT maps ($$$T_{2,f}$$$, $$$T_{2,r}$$$, MPF and $$$R$$$) were estimated using a two-pool model15 implemented in the qMTLab toolbox16, with $$$R_{1,r}=R_{1,f}$$$.
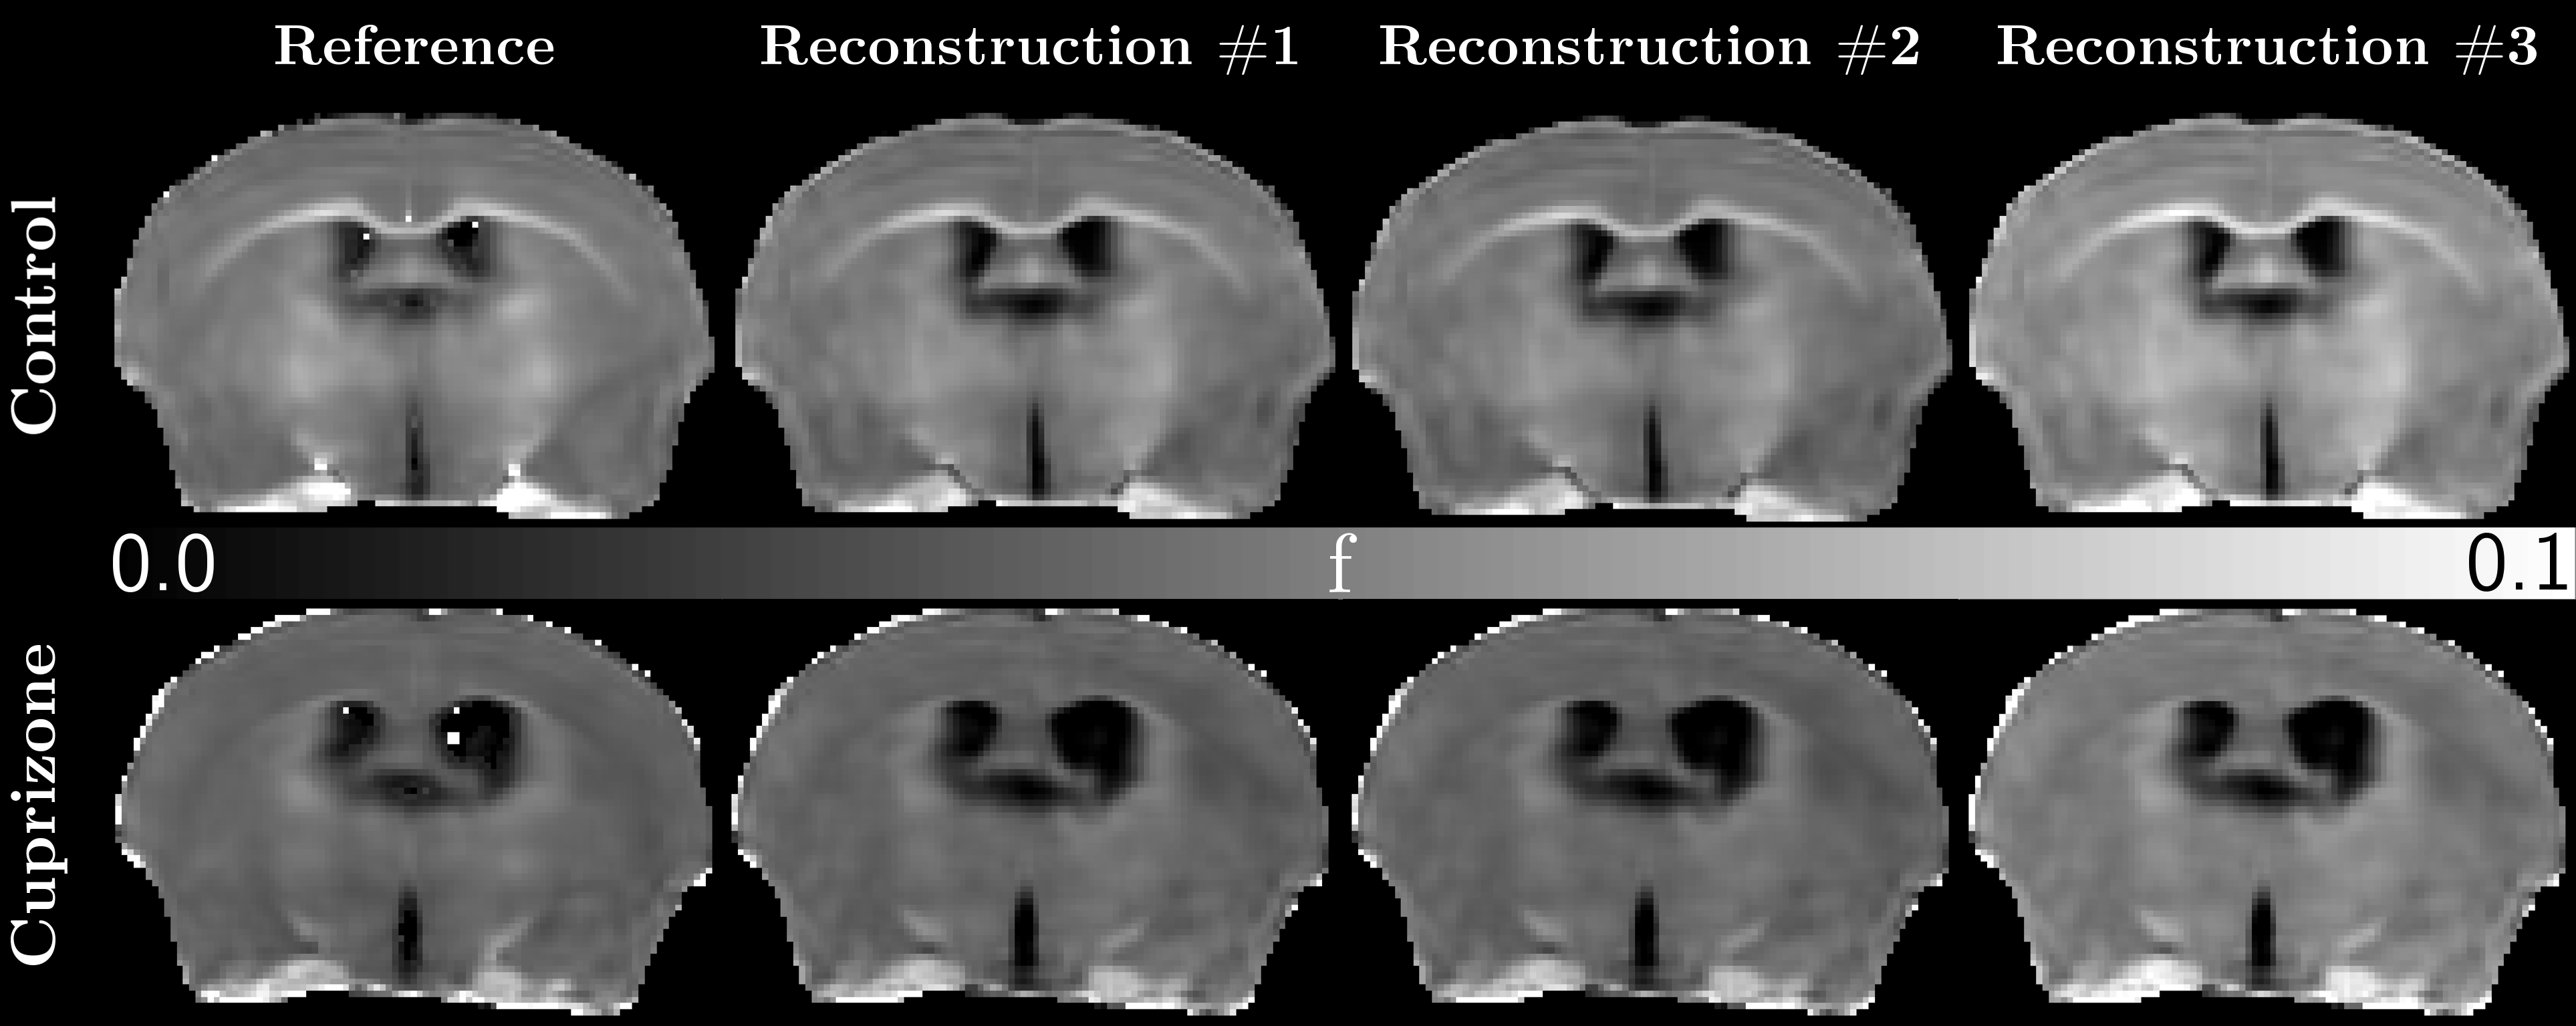
MPF maps for each animal were reconstructed by the single-point method for each combination of saturation pulse frequency offset $$$\Delta$$$ and flip angle $$$\alpha_\text{sat}$$$ as follow:
- #1: using the medians of the estimated histograms parameters from the present study (i.e. respectively for Control and Cuprizone groups);
- #2: using the medians of the estimated joint histogram parameters from the present study;
- #3: using published constrained parameters estimated at 3T for the human brain6.
The mean absolute percentage error per voxel for each SP-MPF reconstructions was computed as6: $$\delta_f=\frac{1}{N}\sum_\nu^N\frac{|f_\text{ref}(\nu)-f_\text{SP}(\nu)|}{f_\text{ref}(\nu)},$$
where $$$\nu$$$ is a voxel from the brain parenchyma across all mice.
Optimal $$$\Delta$$$ and $$$\alpha_\text{sat}$$$ were determined for MPF reconstruction #1 and #2 as the values minimizing $$$\delta_f$$$. To evaluate the agreement between the reference qMTI method and the SP-MPF method within optimal setup conditions, mean values of MPF estimated in the somato-sensory cortex and the corpus callosum were plotted against each other.
Results
Averaged histograms for $$$R_{1,f}T_{2,f}$$$, $$$T_{2,r}$$$, $$$R$$$ and MPF parameters from both groups are shown in Figure 1. Although $$$R_{1,f}T_{2,f}$$$ does not seem to vary much between the two groups, $$$R$$$, $$$T_{2,r}$$$ and MPF distributions are clearly affected by the global brain demyelination following the cuprizone diet10. Medians of the separate Control and Cuprizone distributions amounted to $$$R_{1,f}T_{2,f}=0.0191/0.0185$$$, $$$R=41.9/45.4~\text{s}^{-1}$$$ and $$$T_{2,r}=10.2/9.6~\mu\text{s}$$$, respectively. Alternatively, the joint distributions resulted in $$$R_{1,f}T_{2,f}=0.0190$$$, $$$R=43.6~\text{s}^{-1}$$$ and $$$T_{2,r}=9.9~\mu\text{s}$$$.
The SP-MPF reconstructions #1 and #2 for $$$\Delta=6$$$ kHz and $$$\alpha_\text{sat}=600^\circ$$$ were found to provide the smallest experimental mean percentage errors ($$$\delta_f=7.4\%$$$ and $$$\delta_f=7.6\%$$$, respectively) at 7T (Figure 2).
A good agreement was found between reference MPF values and those estimated using the SP-MPF method from reconstruction #1 and #2 (Figures 3 and 4). Using group-specific parameters does not seem to improve the accuracy of the results. In contrast, MPF values were overestimated using published constrained parameters, estimated at 3T in the human brain.
Conclusion
We demonstrated that MPF maps in mouse brain at 7T can be estimated accurately and efficiently using the SP-MPF methodology. We also showed that constrained parameters and optimal $$$\Delta$$$ and $$$\alpha_\text{sat}$$$ values must be experimentally determined for robust and accurate SP-MPF mapping.Acknowledgements
References
1. Odrobina EE, Lam TYJ, Pun T, Midha R, Stanisz GJ. MR properties of excised neural tissue following experimentally induced demyelination. NMR in Biomedicine 2005;18:277–284.
2. Schmierer K, Tozer DJ, Scaravilli F, Altmann DR, Barker GJ, Tofts PS, Miller DH. Quantitative magnetization transfer imaging in postmortem multiple sclerosis brain.Journal of Magnetic Resonance Imaging 2007;26:41–51.
3. Yarnykh V, Korostyshevskaya A. Implementation of fast macromolecular proton fraction mapping on 1.5 and 3 Tesla clinical MRI scanners: preliminary experience. Journal of Physics: Conference Series 2017;886:012010.
4. Underhill HR, Yuan C, Yarnykh VL. Direct quantitative comparison between cross-relaxation imaging and diffusion tensor imaging of the human brain at 3.0 T. NeuroImage 2009;47:1568–1578.
5. Underhill HR, Rostomily RC, Mikheev AM, Yuan C, Yarnykh VL. Fast bound pool fraction imaging of the in vivo rat brain: Association with myelin content and validation in the C6 glioma model. NeuroImage 2011;54:2052–2065.
6. Yarnykh VL. Fast macromolecular proton fraction mapping from a single off-resonance magnetization transfer measurement. Magnetic Resonance in Medicine 2012;68:166–178.
7. Yarnykh VL, Bowen JD, Samsonov A, Repovic P, Mayadev A, Qian P, Gangadharan B, Keogh BP, Maravilla KR, Jung Henson LK. Fast Whole-Brain Three-dimensional Macromolecular Proton Fraction Mapping in Multiple Sclerosis. Radiology 2015;274:210–220.
8. Yarnykh VL. Time-efficient, high-resolution, whole brain three-dimensional macromolecular proton fraction mapping. Magnetic Resonance in Medicine 2016;75:2100–2106.
9. Khodanovich MY, Sorokina IV, Glazacheva VY, Akulov AE, NemirovichDanchenko NM, Romashchenko AV, Tolstikova TG, Mustafina LR, Yarnykh VL. Histological validation of fast macromolecular proton fraction mapping as a quantitative myelin imaging method in the cuprizone demyelination model. Scientific Reports 2017;7:46686.
10. Torkildsen Ø, Brunborg LA, Myhr KM, Bø L. The cuprizone model for demyelination. Acta Neurologica Scandinavica 2008;117:72–76.
11. Zur Y, Wood ML, Neuringer LJ. Spoiling of transverse magnetization in steady-state sequences. Magnetic Resonance in Medicine 1991;21:251–263.
12. Nehrke K. On the steady-state properties of actual flip angle imaging (AFI). Magnetic Resonance in Medicine 2009;61:84–92.
13. Maggioni M, Katkovnik V, Egiazarian K, Foi A. Nonlocal Transform-Domain Filter for Volumetric Data Denoising and Reconstruction. IEEE Transactions on Image Processing 2013;22:119–133.
14. Avants BB, Tustison NJ, Song G, Cook PA, Klein A, Gee JC. A reproducible evaluation of ANTs similarity metric performance in brain image registration. NeuroImage 2011;54:2033–2044.
15. Yarnykh VL, Yuan C. Cross-relaxation imaging reveals detailed anatomy of white matter fiber tracts in the human brain. NeuroImage 2004;23:409–424.
16. Cabana
JF, Gu Y, Boudreau M, Levesque IR, Atchia Y, Sled JG, Narayanan S,
Arnold DL, Pike GB, CohenAdad J, Duval T, Vuong MT, Stikov N.
Quantitative magnetization transfer imaging made easy with qMTLab :
Software for data simulation, analysis, and visualization. Concepts in
Magnetic Resonance Part A 2015;44A:263–277.
Figures