4402
Non-negative least squares fitting of multi-exponential T2 decay data: Are we able to accurately measure the fraction of myelin water?1Physics and Astronomy, University of British Columbia, Vancouver, BC, Canada, 2Pediatrics, University of British Columbia, Vancouver, BC, Canada, 3UBC MRI Research Centre, University of British Columbia, Vancouver, BC, Canada, 4Radiology, University of British Columbia, Vancouver, BC, Canada, 5Lund University, Lund, Sweden
Synopsis
The ability to determine the myelin water fraction (MWF) in vivo is essential to assessments of neurodevelopmental myelination and myelin damage in neurodegenerative diseases. The analysis of multi-exponential T2 decay data relies on the non-negative-least-squares (NNLS) fitting, which may be sensitive to the chosen fitting parameters. We performed simulations to explore the outcomes of NNLS under different parameter selection. The lowest allowed T2 was found to have the largest effect on correctly estimating the T2 of different water pools as well as the MWF. Lower refocusing FAs led to further underestimation of the MWF.
Introduction
The ability to determine the myelin water fraction (MWF) in vivo1 is essential to assessments of neurodevelopmental myelination and myelin damage in neurodegenerative diseases. Multi-echo spin-echo imaging has been shown to correlate with optical density measurements of myelin lipids2,3. However, as MW imaging has been extended to 48-echoes, applied at higher magnetic fields3 and investigated post-mortem during fixation4, selection of post-processing parameters for the non-negative least squares fitting (NNLS) needs to be revisited. We used simulations to explore the outcomes of NNLS fitting for different parameter selections in a given water environment at 3T and drew parallels to in vivo data.Methods
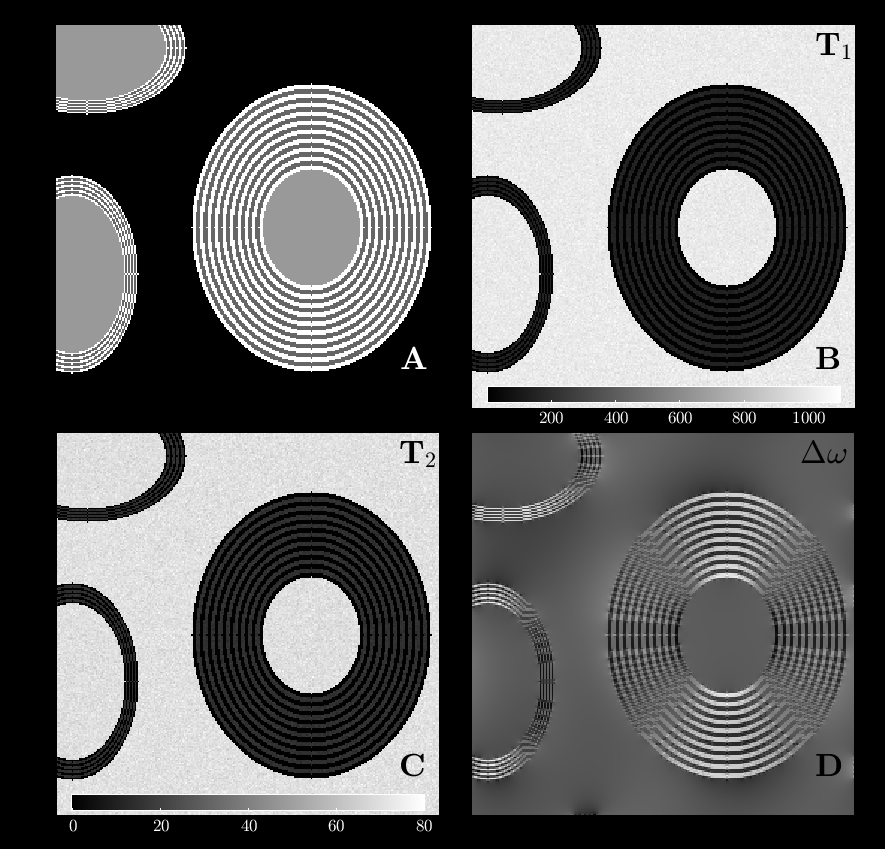
Independent decay data were computed by multi-echo spin-echo simulations of the magnetization of 256x256 spins in with given T1 and T2-properties, taken from literature to mimic white matter values5,6. Various resonance frequencies were assigned to the different water compartments7, after computing the local magnetic environment from tissue magnetic susceptibilities. All T1's, T2's and resonance frequencies were assigned to each spin by random sampling from a Gaussian distribution. Finally, Gaussian noise was added to the images. The voxel and its properties are shown in Figure 1. The MWF, i.e. the amount of MW relative to all water within a voxel, was 21%. Decay data were computed assuming a signal-to-noise ratio of 300, imperfect refocusing flip angles (FA=30,150,170,180º) and MWT2-times (5,10,15,20 ms) using a 32-echo sequence with TE/ΔTE/TR=10/10/1000ms. Decay curves were analyzed by fitting the measured decay curve with decay curves estimated by the extended-phase-graph algorithm to estimate FA in the presence of stimulated echoes8,9, while minimizing χ2 with respect to FA. Regularized NNLS was employed with varying numbers of T2-components (nT2) to fit the decay curves. The estimated parameters, i.e. the FA, the geometric mean T2 of the intra/extracellular water (GMT2 IEW), GMT2 of the MW and the MWF were computed under varying nT2s (20,32,40,80,120) and different T2-ranges for which the shortest T2 was varied (T2,1=5-15ms, T2,end=2s).Results
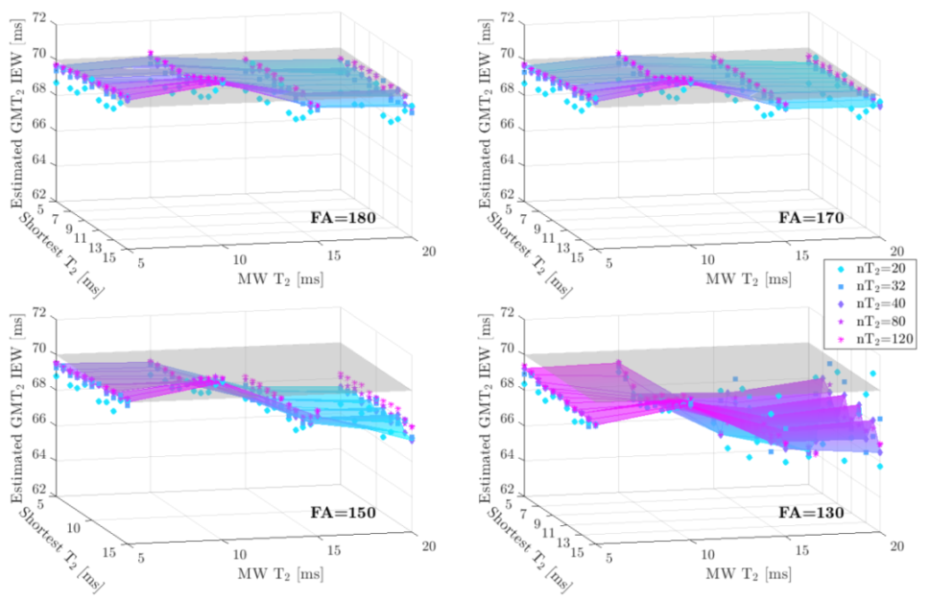
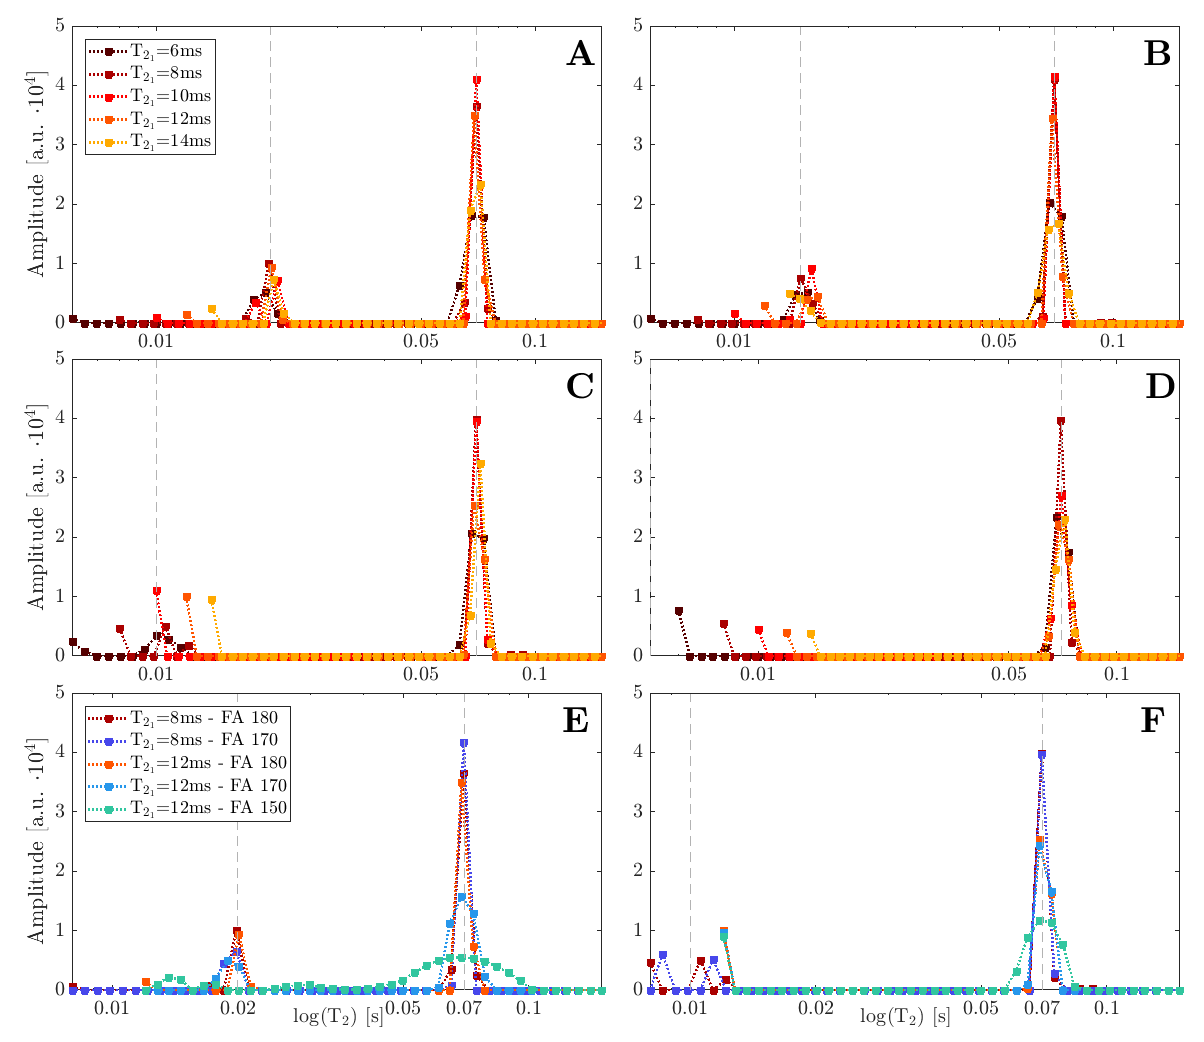
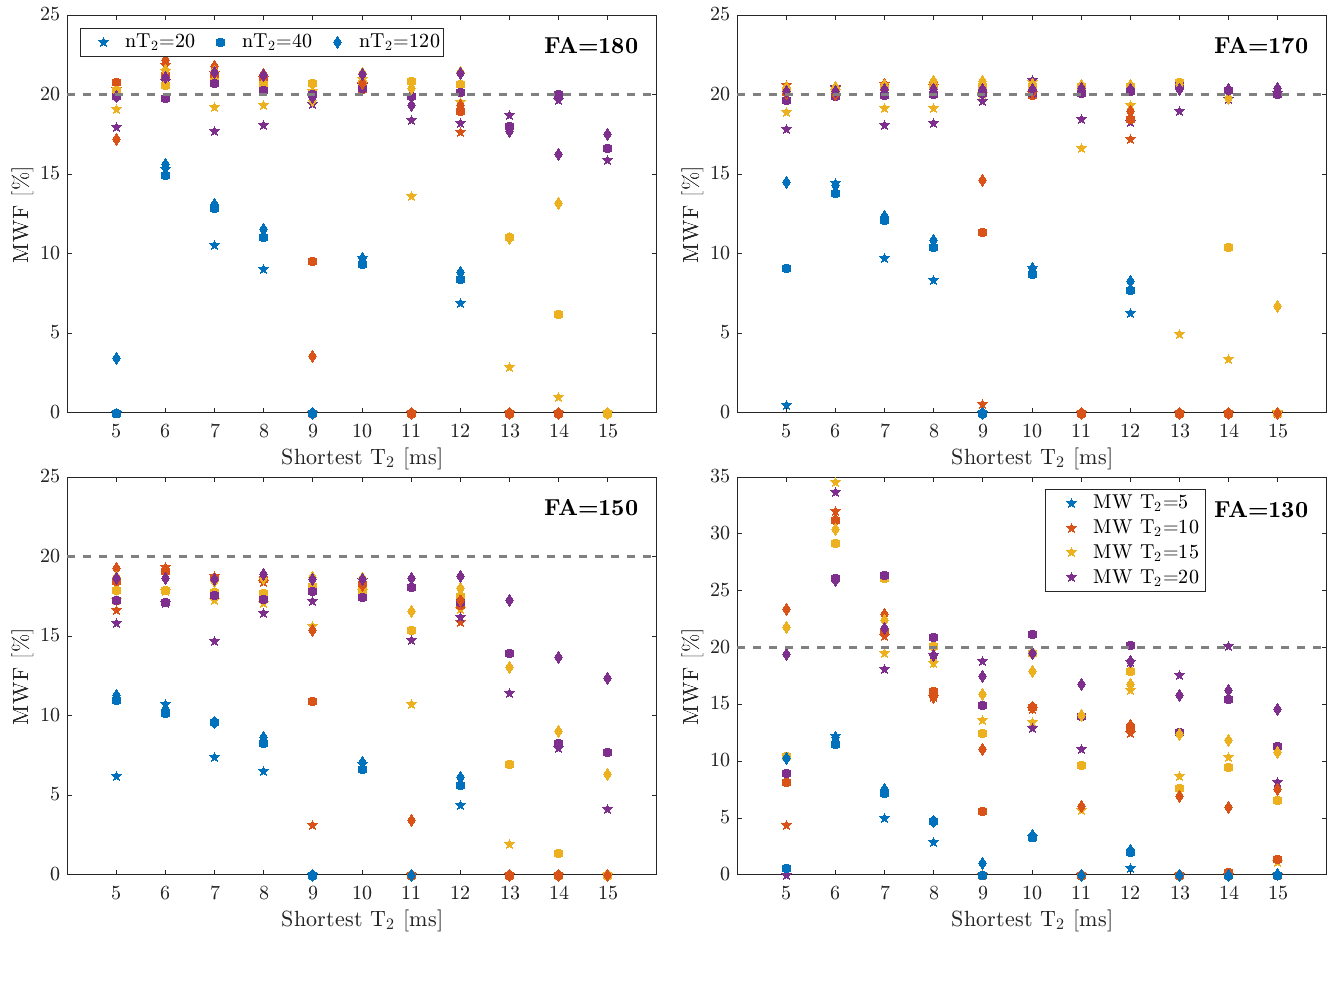
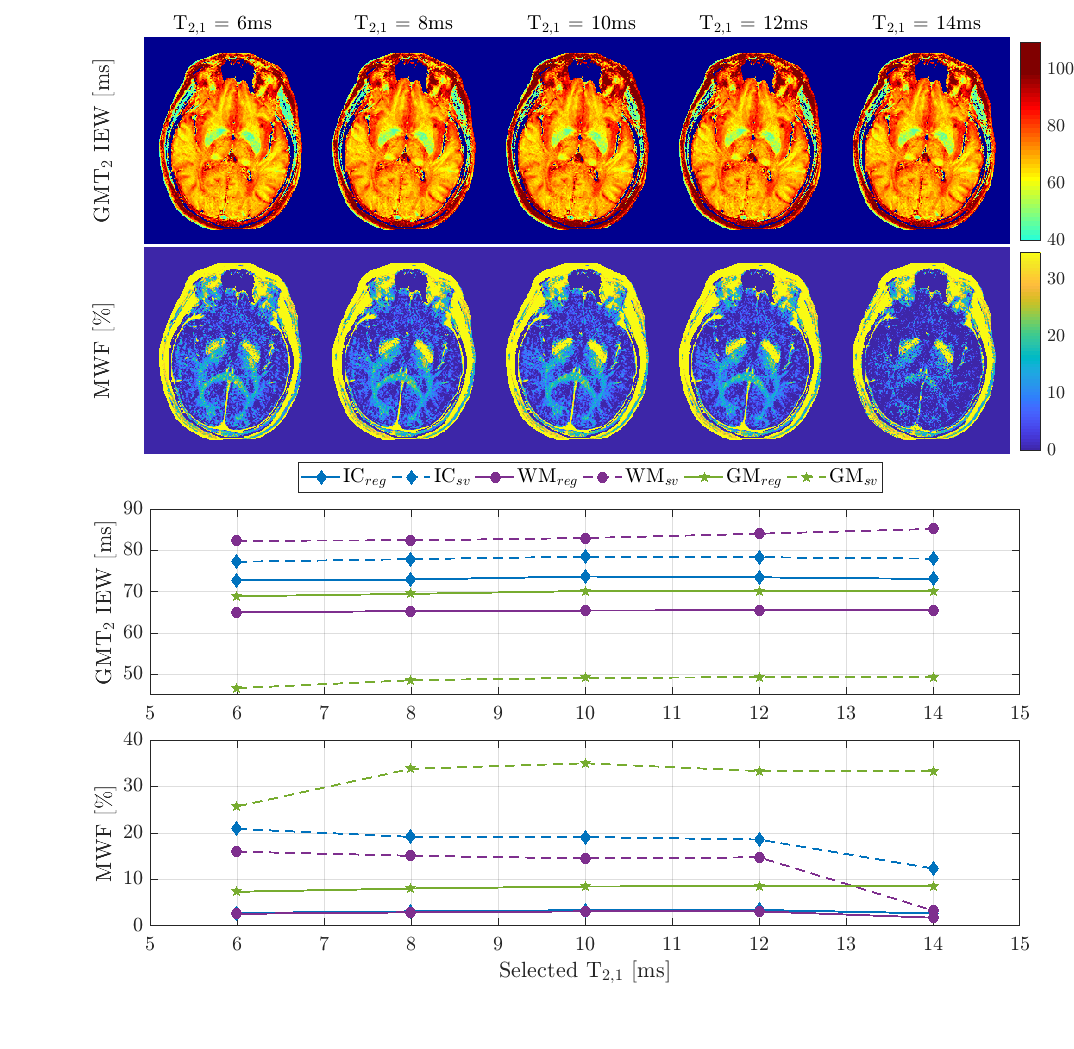
The FA estimation was independent of nT2. The computed FAs differed from the true FAs by 2.46±1.49, 3.00±0.51, 1.99±0.58 and 2.36±0.51 for 130,150,170,180º, respectively. Figure 2 shows the estimated GMT2 IEW values. As FA decreaed, the GMT2 IEW moved further away from the reference: 69.70±0.71ms (180º), 69.74±0.62ms (170º), 68.85±1.08ms (150º), 67.93±1.38ms (130º). For MWT2 values, lower refocusing FAs resulted in greater deviations from the true GMT2 IEW. This was explored in more detail in Figure 3, by comparing the computed T2-distributions. For all FAs, the GMT2 of MW and IEW were well determined when T2,1 was less than T2 of MW. When T2 MW was shorter than the first allowed T2, the MW peak was incompletely described and the estimated MWT2 depended on the value of T2,1. However, the GMT2 IEW was accurately estimated. Finally, we compared the estimated MWF, with respect to FA, nT2's and T2,1 (Figure 4). Again, MWFs were well estimated if T2,1 was less than MWT2. Note that once the MW peak was fully captured, further shortening of T2,1 did not change the MWF. With decreasing FA, the MWF was underestimated. When assessing the impact of changed analysis parameters on in vivo data acquired at 3T with the imaging parameters matching the simulation parameters (Figure 5), we noted visually an improvement in the assessed MWF when lowering T2,1 from 14 to 12ms. Both GMT2 IEW and MWF were in line with the observations of the simulation, with stronger effects observed for single voxels. FAs in the regions-of-interest were 151.7,164.3,154.3º in the internal capsule, white matter and globus pallidus, respectively.Discussion
Although the true FAs were well captured by the extended-phase-graph algorithm, MWF may be under-estimated, even when the MWT2 was within the T2-range. The GMT2 of IEW and MW shortened slightly at lower FAs if T2,1<MW T2, but MWT2 estimation failed if T2,1 was chosen too long. FAs at 3T are generally greater than 150, but regions of low FA as well as further T2-shortening at higer magnetic field strength, or due to fixation, will be problematic for estimating MWF correctly. In vivo data showed good correspondence with the simulations. Single-voxel data were affected by the choice of parameters, but averages within regions containing multiple voxels provided stable estimates.Conclusions
The MWF was robustly estimated with respect to many parameters. Successfully measuring the MWF however depends on the actual MWT2, which is unknown, and the chosen T2-range, relative to the MWT2. By lowering the T2-range, the MW signal is better captured. Further work should investigate how underestimations of the MWF at lower, known FAs can be recovered.Acknowledgements
No acknowledgement found.References
1. MacKay A, Whittall K, Adler J, et al. In vivo visualization of myelin water in brain by magnetic resonance. Magn Reson Med 1994;31(6):673-677.
2. Laule C, Leung E, Li DKB, et al. Myelin water imaging in multiple sclerosis: quantitative correlations with histopathology. Mult Scler 2006;12(6):747-753.
3. Laule C, Kozlowski P, Leung E, et al. Myelin water imaging of multiple sclerosis at 7T: correlations with histopathology. NeuroImage 2008;40(4):1575-1580.
4. Shatil, AS, Uddin MN, Matsuda KM, et al. Quantitative Ex Vivo MRI Changes due to Progressive Formalin Fixation in Whole Human Brain Specimens: Longitudinal Characterization of Diffusion, Relaxometry, and Myelin Water Fraction Measurements at 3T. Frontiers in medicine 2018;5:31.
5. Labadie C, Lee JH, Rooney WD, et al. Myelin water mapping by spatially regularized longitudinal relaxographic imaging at high magnetic fields. Magnetic resonance in medicine 2014;71(1):375-387.
6. MacKay A, Laule C, Vavasour I et al. Insights into brain microstructure from the T2 distribution. Magnetic resonance imaging 2006;24(4):515-525.
7. Alonso-Ortiz E, Levesque IR, Pike GB. Impact of magnetic susceptibility anisotropy at 3 T and 7 T on T2*-based myelin water fraction imaging. NeuroImage 2017;182:370-378.
8. Hennig J. Multiecho imaging sequence with low refocusing flip angles. JMRI 1988;78(3):397-407.
9. Prasloski T, Mädler B, Xiang Q-S, et al. Applications of stimulated echo correction to multicomponent T2 analysis. Magn Reson Med 2012;67(6):1803-1814.
Figures