4399
Direct Myelin Volume Fraction Mapping with Correction for Magnetization Transfer and Diffusion Effects Using a Four-pool White Matter Model1Department of Neurology and Neurosurgery, Montreal Neurological Institute and Hospital, McGill University, Montreal, QC, Canada, 2Department of Biomedical Engineering, McGill University, Montreal, QC, Canada
Synopsis
We propose an accelerated myelin water fraction (MWF) imaging technique that employs wave encoding combined with double inversion-recovery weighting (wave-CAIPI
Introduction
Magnetic resonance imaging (MRI) can provide quantitative, non-invasive measurements myelin water fraction (MWF) that are applicable for assessing demyelination and remyelination in neurological diseases such as multiple sclerosis (MS). Recently, myelin volume fraction (MVF) has been proposed as a tool for identifying WM integrity in human brain in vivo [1]. To date, two common MRI methods have been applied for MVF mapping: (i) T2 or T2*-based myelin water imaging (MWI) [2,3] and (ii) quantitative magnetization transfer (qMT) imaging [4]. Standard MWI methods, using multi-echo CPMG or multi-echo GRE acquisitions, can suffer from instabilities due to ill-conditioned model fitting and high sensitivity to initial parameter selection. Although qMT can achieve high accuracy in MVF mapping, it is associated with longer scan times for whole-brain imaging. This study presents a method for MVF mapping using direct visualization of short transverse relaxation time component (wave-CAIPI ViSTa) [5] with correction for magnetization transfer (MT) and diffusion effects.Methods
One healthy subject was scanned on a 3T Prisma MRI scanner (Siemens, Germany). A recently proposed whole brain, direct myelin water imaging sequence using double inversion recovery (DIR) preparation (Wave-CAIPI ViSTa) [5] was applied for MWF mapping. As a reference, we also collected magnetization transfer saturation (MTsat) [6] maps for each subject (MT-on, MT-off, T1 weighted). The wave-CAIPI ViSTa sequence used TI1 = 560 ms, TI2 = 222 ms, TD = 378 ms, TR = 1160 ms, TE = 7 ms, flip angle = 90 degrees, matrix size = 192 × 192 × 32 and voxel size = 1.15 × 1.15 × 3 mm3. For MT-on and MT-off sequences, acquisition parameters were as follows: TR = 36 ms, TE = 4.92 ms, flip angle = 5 degrees, matrix size = 256 × 192 × 192 and 1 mm3 isotropic voxel size. For the MT-on acquisition, the MT pulse off-resonance offset was set to 2.732 kHz and the MT flip angle was 142°. An associated gradient echo scan was also collected with similar acquisition parameters, but with a TR of 28 ms and flip angle of 25 degrees to provide a reference T1 weighted imaging volume.
MVF calculation was carried out by scaling MWF values obtained from wave-CAIPI ViSTa. First, a previously proposed four-pool WM model (Figure 1A) [7] was used for modeling the impact of MT and diffusion between WM compartments. The T1 value of myelin water was set to 120 ms according to literature findings [8]. MT and diffusion were modeled using a recently proposed extended phase graph framework (EPG-X) [9]. In this study, the EPG-X method was extended from two-pools (free and bound water compartments) to four-pools (including myelin semi-solids and non-myelin semi-solids, Figure 1B). MVF was then calculated from MT- and diffusion-corrected MWF using a recently proposed geometric model of myelin [2]. MVF maps obtained from wave-CAIPI ViSTa data were compared to those obtained by MTsat mapping.
Results
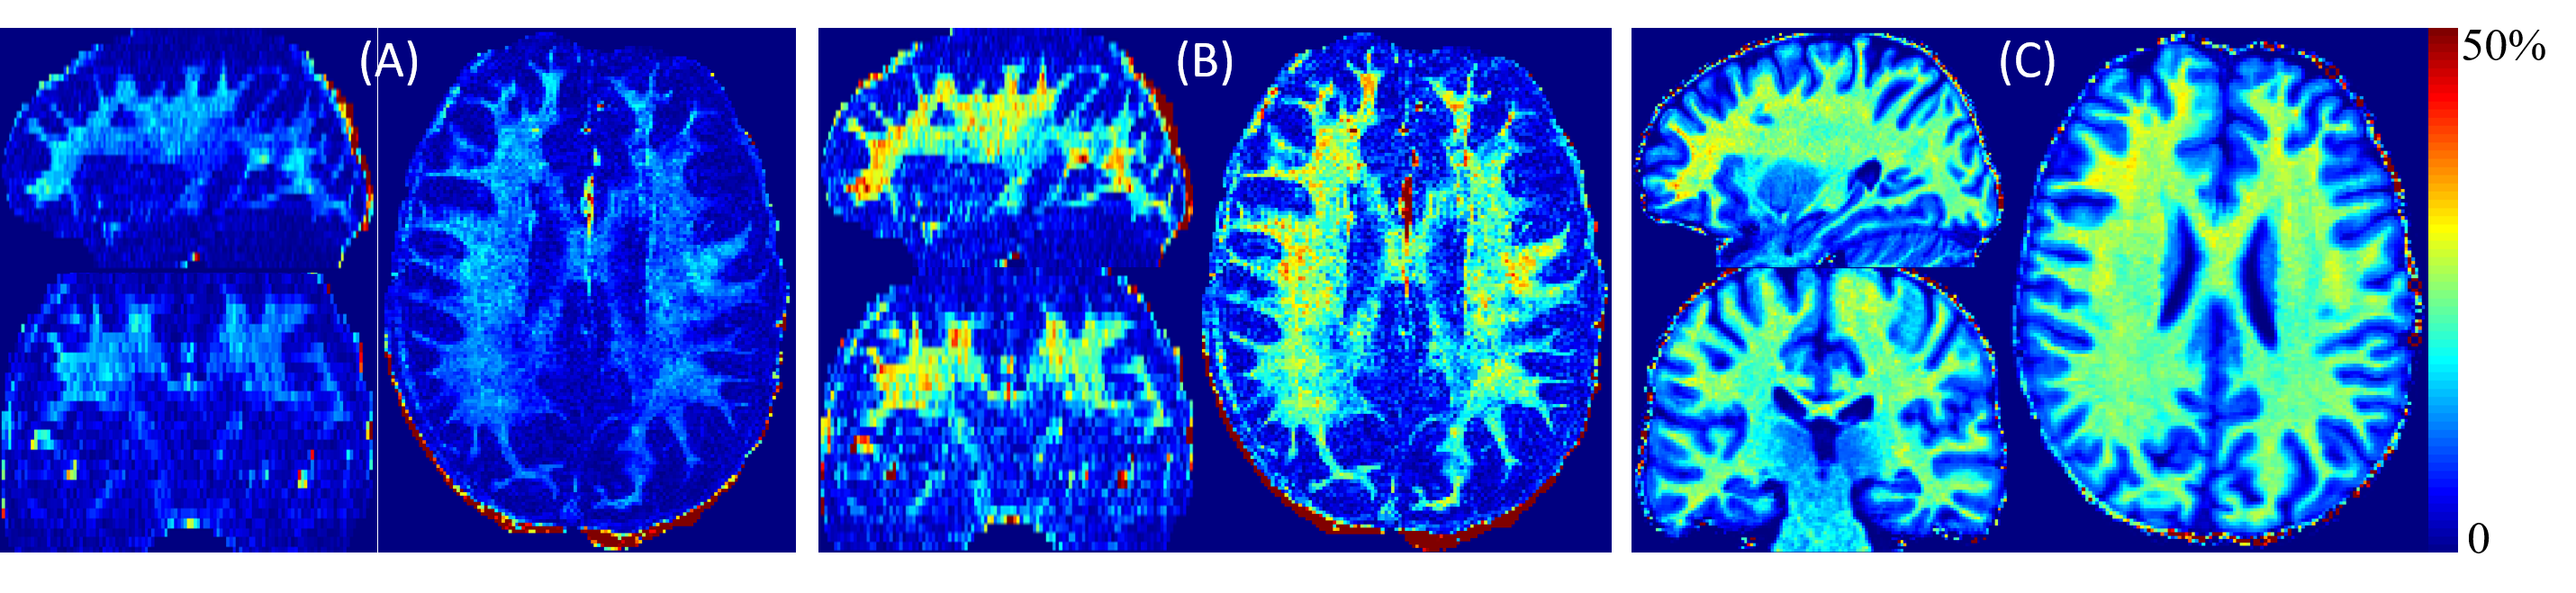
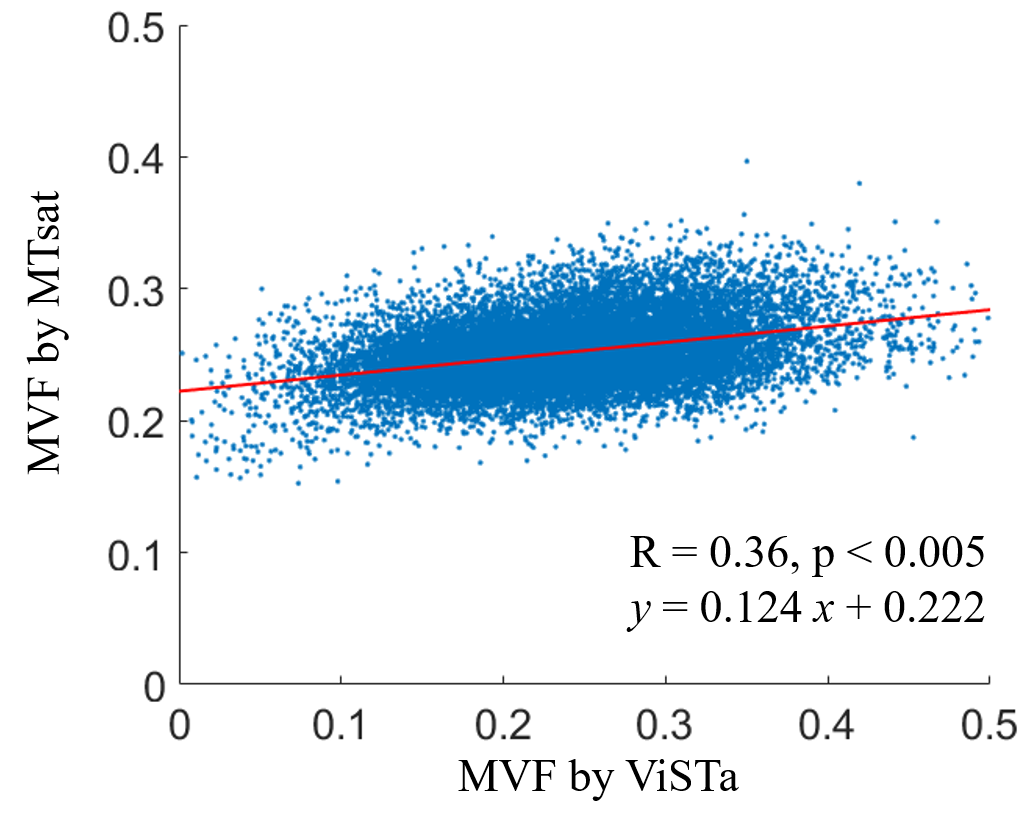
Figure 2A shows the RF timing diagram of the wave-CAIPI ViSTa sequence. The corresponding EPG-X signal simulation for the signal fraction of myelin water that exists after each RF pulse is displayed in Figure 2B. A steady state condition for the myelin water signal is achieved after the second TR period. The proportion of steady-state myelin water signal (normalized to its equilibrium magnetization) after the second TR period was 0.5034. Figure 3 demonstrates MVF maps calculated using wave-CAIPI ViSTa (w/wo MT & diffusion corrections) compared to those from the MTsat acquisition. Figure 4 displays the linear correlation between ViSTa MVF (with MT and diffusion correction) and the corresponding MTsat MVF values. The slope and intercept of the linear regression between these two MVFs were 0.124 and 0.222, respectively. The Pearson correlation coefficient was 0.36 (p < 0.005).Discussion and conclusion
The MTsat method has been suggested as an efficient alternative for MVF measurement with reduced scan time. Under controlled conditions, MTsat signal is closely correlated with qMT-derived macromolecular pool size [4]. In our study, MTsat was employed as a gold standard reference for MVF measurement. Whole-brain MWF mapping using wave-CAIPI ViSTa is an alternative to MTsat with similar scan time for whole-brain imaging. Although it is currently implemented with a lower through-plane resolution, our initial results (with MT and diffusion modeling) demonstrate ViSTa MVF is linearly correlated with the corresponding MTsat-derived measurement. The slope and non-zero intercept in Figure 4 reflects the different sources governing the MTsat and ViSTa signal. Overall, the ViSTa MVF method is a useful alternative for myelin water fraction measurement that is uniquely sensitized to T1-relaxation components and devoid of model fitting challenges.Acknowledgements
No acknowledgement found.References
[1] Nikola Stikov, Jennifer S.W. Campbell, Thomas Stroh, Mariette Lavelée, Stephen Frey, Jennifer Novek, Stephen Nuara, Ming-Kai Ho, Barry J. Bedell, Robert F. Dougherty, Ilana R. Leppert, Mathieu Boudreau, Sridar Narayanan, Tanguy Duval, Julien Cohen-Adad, Paul-Alexandre Picard, Alicja Gasecka, Daniel Côté, G. Bruce Pike. In vivo histology of the myelin g-ratio with magnetic resonance imaging. NeuroImage 2015; 118: 397–405.
[2] Woojin Jung, Jingu Lee, Hyeong-Geol Shin, Yoonho Nam, Hui Zhang, Se-Hong Oh, and Jongho Lee. Whole brain g-ratio mapping using myelin water imaging (MWI) and neurite orientation dispersion and density imaging (NODDI). NeuroImage 2018; 182: 379-388.
[3] Kathryn L. West, Nathaniel D. Kelm, Robert P. Carson, Daniel F. Gochberg, Kevin C. Ess, Mark D. Does. Myelin volume fraction imaging with MRI. NeuroImage 2018; 182: 511-521.
[4] Jennifer S.W. Campbell, Ilana R. Leppert, Sridar Narayanan, Mathieu Boudreau,Tanguy Duval, Julien Cohen-Adad, G. Bruce Pike, Nikola Stikov. Promise and pitfalls of g-ratio estimation with MRI. NeuroImage 2018; 182: 80-96.
[5] Zhe Wu, Berkin Bilgic, Hongjian He, Qiqi Tong, Yi Sun, Yiping Du, Kawin Setsompop, Jianhui Zhong. Wave-CAIPI ViSTa: highly accelerated whole-brain direct myelin water imaging with zero-padding reconstruction. Magnetic Resonance in Medicine 2018; 80: 1061–1073.
[6] Gunther Helms, Henning Dathe, Kai Kallenberg, Peter Dechent. High-resolution maps of magnetization transfer with inherent correction for RF inhomogeneity and T1 relaxation obtained from 3D FLASH MRI. Magnetic Resonance in Medicine 2008; 60:1396–1407.
[7] Ives R. Levesque, G. Bruce Pike. Characterizing healthy and diseased white matter using quantitative magnetization transfer and multicomponent T2 relaxometry: a unified view via a four-pool model. Magnetic Resonance in Medicine 2009; 62:1487–1496.
[8] Christian Labadie, Jing-Huei Lee, William D. Rooney, Silvia Jarchow, Monique Aubert-Frecon, Charles S. Springer, Jr., Harald E. Moller. Myelin water mapping by spatially regularized longitudinal relaxographic imaging at high magnetic fields. Magnetic Resonance in Medicine 2014; 71:375–387.
[9] Shaihan J. Malik, Rui Pedro A.G. Teixeira, Joseph V. Hajnal. Extended phase graph formalism for systems with magnetization transfer and exchange. Magnetic Resonance in Medicine 2018; 80: 767–779.
Figures
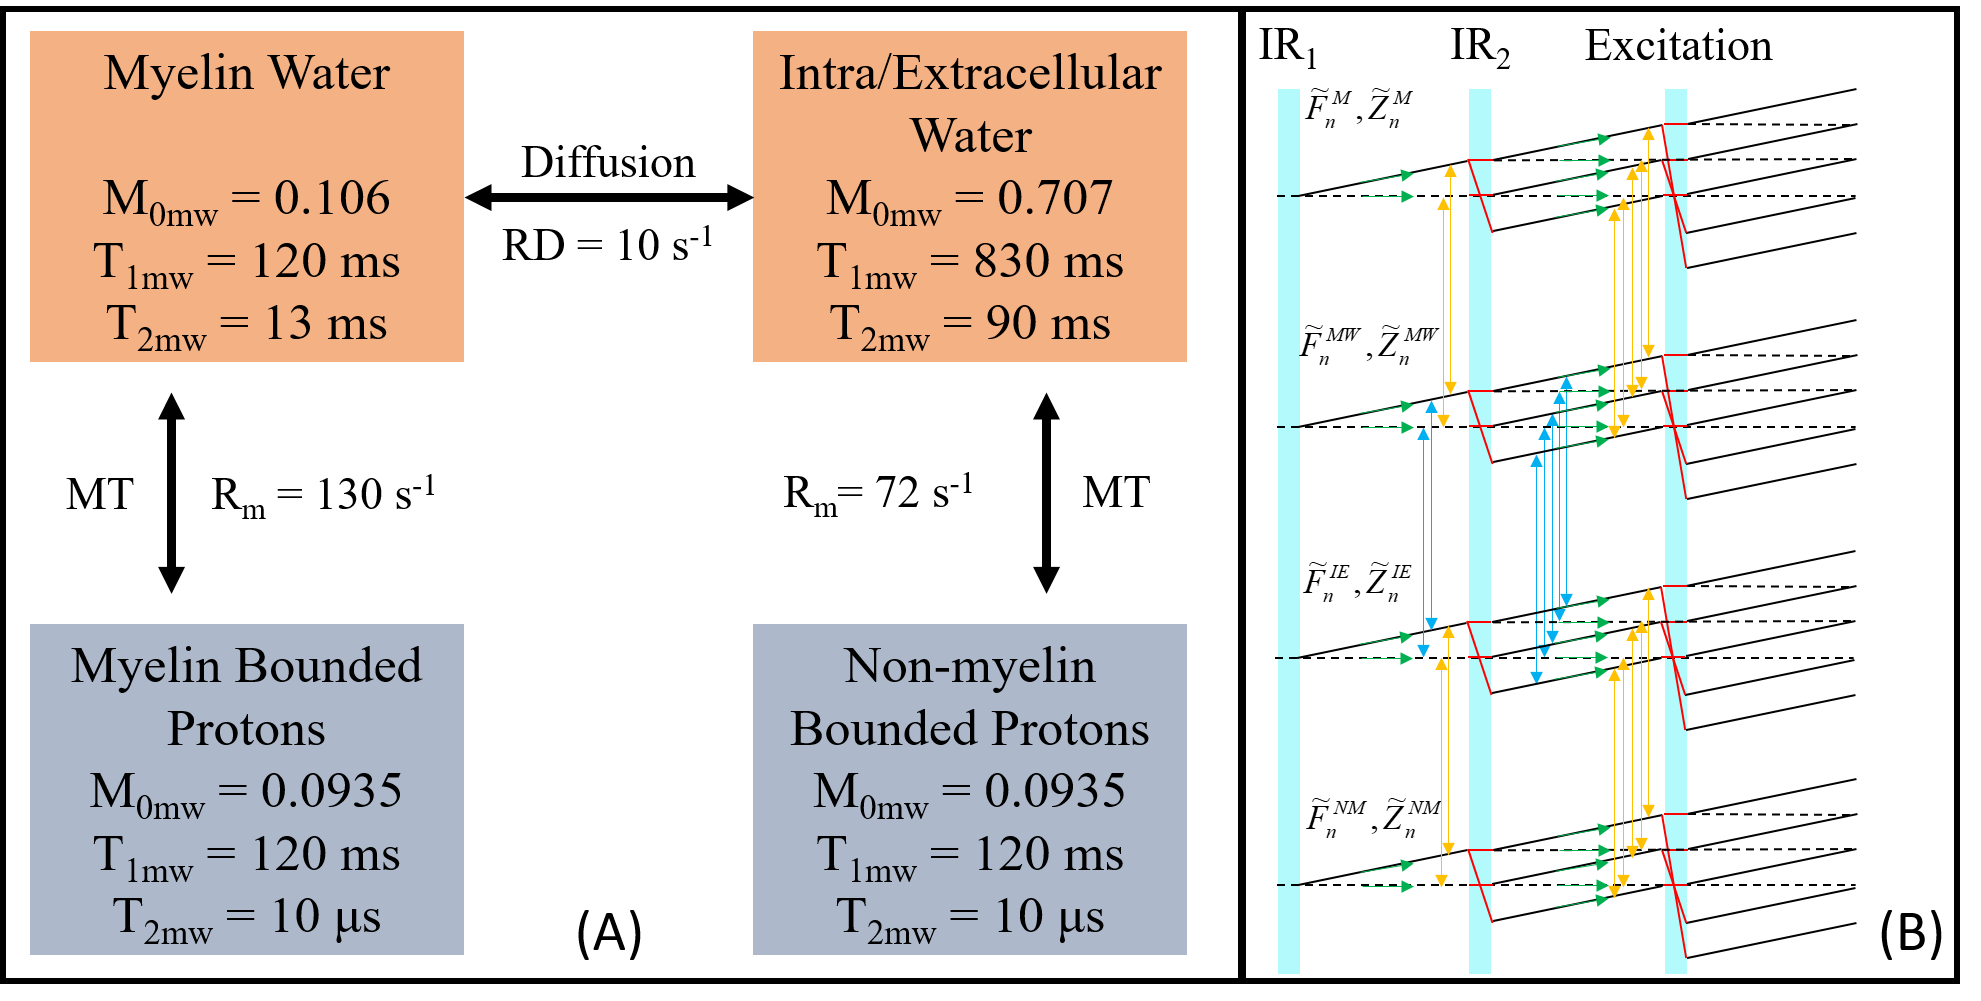
Figure 1 A: Four-pool white matter model used for MT / diffusion modelling;
B: Illustration of modified EPG-X method used in the proposed method.
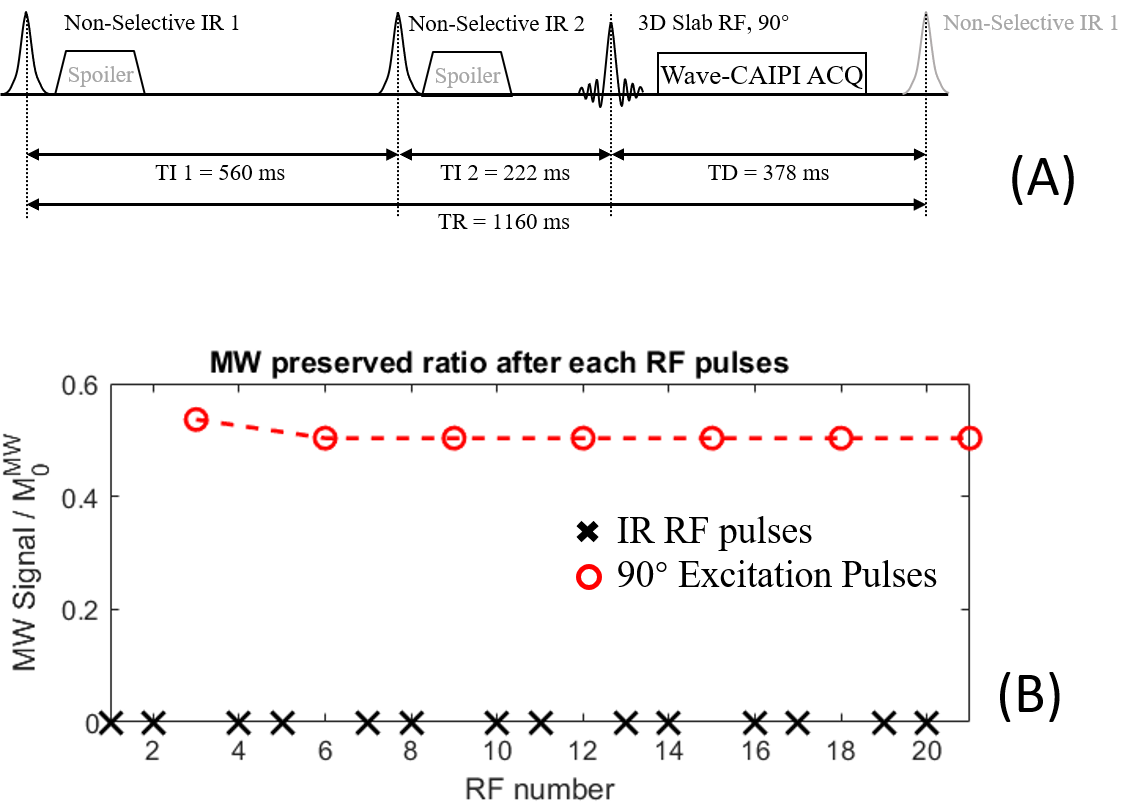
Figure 2 A: Timing diagram of DIR and excitation RF pulses used in wave-CAIPI ViSTa sequence;
B: The fraction of preserved myelin water signal after each RF pulse (IR1 – IR2 – Exc – IR1 …) as predicted by EPG-X simulation. A steady-state in the preserved myelin water signal (0.5034) is achieved after the second TR period.