4397
Diagnostic performance of chemical shift in/opposed phase (IOP) and fat-fraction to evaluate the presence of intra-tumoral fat in HCCKritisha Rajlawot1, Jing Zhou2, Churong Lin1, Sichi Kuang1, Jingbiao Chen1, Yao Zhang1, Hao Yang1, Ying Deng1, Bingjun He1, Diego Hernando3, Jin Wang1, and Scott B Reeder3
1Department of Radiology, The third affiliated hospital of Sun Yat-sen University, Guangzhou, China, 2The third Affiliated Hospital, Sun Yat-Sen University, Guangzhou, China, 3Departments of Radiology and Medical Physics, University of Wisconsin, Madison, W, University of Wisconsin, Madison, WI, Madison, WI, United States
Synopsis
Hepatocellular carcinoma (HCC) is the most common primary malignancy of the liver. Previous studies have
Introduction
Fatty change is known to be an important marker for the transformation of premalignant lesions to HCC. Proton Density Fat Fraction(PDFF) and IOP are the commonly used MR Imaging methods to diagnose fatty infiltration in the liver. Fatty change in liver parenchyma or intra-lesional can be diagnosed as drop in signal intensity in opposed-phase2, while PDFF defines the ratio of density of mobile protons from triglycerides and the total density of protons from mobile triglycerides and mobile water3. Up to 19.6% of HCC have been shown to contain intra-tumoral fat by standard light microscopy and up to 10% of HCCs with fat on opposed-phase chemical-shift MR imaging2-4. The purpose of this study was to compare the diagnostic accuracy of quantitative fat fraction imaging at three different flip angles (FA) using IDEAL-IQ compared to chemical shift imaging (IOP) to evaluate intra-tumoral fat in HCC.Methods
Our institutional review board approved this retrospective study and waived informed consent requirement. From January 2018 to July 2018, 26 male patients, with 27 biopsy proven HCC were included in our study, who underwent MR imaging on 3.0T (MR750, GE Healthcare, Waukesha, WI). A 3D quantitative chemical shift encoded MRI (CSE-MRI) method (IDEAL-IQ, GE Healthcare, Waukesha, WI) was acquired within a single 24s breath-hold in all patients. This method automatically generates a fat fraction map. The acquisition parameters for IDEAL IQ included: FA 3°, 8° and 9°; TR/TE = 7.9/0.9ms, FOV = 400mm*320mm; slice thickness = 8 mm, data matrix = 128*128; NEX = 0.75. Increasing flip angles were chosen to increase the relative signal from fat and therefore increase the SNR of the fat signal. Although this leads to T1-related bias in the fat-fraction measurement, we hypothesized that the improvement in SNR performance may improve the detection of intra-tumoral fat. A 3D dual echo Dixon method (LAVA-FLEX, GE Healthcare, Waukesha, WI) was acquired to generate in-phase, out-phase, water and fat images within a single 19s breath-hold. The acquisition parameters for IOP were TR/TE = 4.4/1.9ms, FOV = 360mm*288mm; slice thickness/gap = 5.0/2.5mm, data matrix 320*224; NEX = 0.7. All HCCs were confirmed histopathologically by an experienced pathologist. All MR images were evaluated by two experienced abdominal radiologists, blind to clinical and pathologic reports by consensus. The same region of interests (ROI) in both methods were chosen from three slices, one being the maximum area of mass covering liver and other two were just above and below the maximum area. Fat fraction for IOP was calculated using (IP-OP)/(2*IP), and fat fraction for IDEAL-IQ was calculated from the mean value obtained from each ROI. Receiver operating characteristics (ROC) curve analysis and Logistic regression were performed to compare the diagnostic accuracy of IOP and PDFF images at three different flip angles of IDEAL-IQ sequence to evaluate intra-tumoral fat in HCC, the respective Area under curve (AUC) and cut-off values were obtained.Results
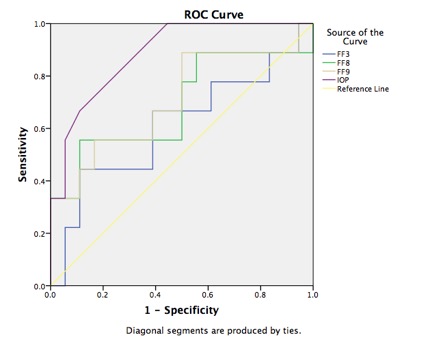
On pathology, 10 of 26 patients with 27 tumors had histologically confirmed intra-tumoral fat, while the remaining 17 tumors had no fat. Chemical shift MR imaging (IOP) images (AUC=87.2%, p=0.001) showed the greater accuracy than fat-fraction using IDEAL IQ at FA 3° (AUC=61.1%, p=0.35), FA 8° (AUC=69.1%, p=0.11) and FA 9° (AUC=71%, p=0.08) (Table 1, Figure 1-3). The cut-off values of IOP, PDFF at FA 3°, FA 8° and FA 9° were 6.0%, 5.3%, 9.0% and 4.3% respectively. Higher positive rates of IOP(100%) compared to IDEAL IQ at FA 3° (44.4%), FA 8° (55.6%) and FA 9° (88.9%), specificity of IOP and PDFF at FA 3°, FA 8° and FA 9° with their PPV and NPV are shown in Table 2.Discussion
IOP and MRI-PDFF are widely used radiological methods to detect fatty changes in diffuse hepatic steatosis and also within HCC4-8. MRI-PDFF is documented as an accurate, repeatable and reproducible quantitative assessment of liver fat over entire liver1. Our results favored IOP with higher positive rates (100%) than PDFF at FA 3° (44.4%), FA 8° (55.6%) and FA 9° (88.9%). We hypothesize that the superior spatial resolution of IOP acquisitions may explain the higher performance to detect intra-lesional fatty changes in HCC. Limitations of our study were that small number of patients in single-center only on 3.0T were enrolled, and it was a retrospective study.Conclusion
In this study, IOP had higher diagnostic accuracy for the detection of intra-tumoral fat in HCC than quantitative CSE-MRI. Increasing the flip angle, which improves the SNR of fat signal, improves the accuracy of CSE-MRI. The discrepancy in diagnostic accuracy may be related to the lower spatial resolution of CSE-MRI. Further studies may be required in large number of patients.Acknowledgements
The authors wish to acknowledge support from the NIH (R01 DK100651, R01 DK088925, K24 DK102595, as well GE Healthcare who provides research support to UW-Madison.References
1)Ji Hye Min, Young Kon Kim, Sanghyeok Lim, Woo KyoungJeong, Dongil Choi, Won Jae Lee. Prediction of microvascular invasion of hepatocellular carcinomas with gadoxetic acid-enhanced MR imaging: Impact of intra-tumoral fat detected on chemical-shift images. European Journal of Radiology 84 (2015) 1036–1043. 2)Siripongsakun S, Lee JK, Raman SS, Tong MJ, Sayre J, Lu DS. MRI detection of intratumoral fat in Hepatocellular Carcinoma: potential biomarker for a more favorable prognosis. Am J Roentgenol 2012;199(5):1018–25. 3)CyrielleCaussy, Scott B. Reeder, Claude B. Sirlin and Rohit Loomb, et al. Non-invasive, quantitative assessment of liver fat by MRI-PDFF as an endpoint in NASH trials. Hepatology 2018;68:763-772. 4)Kadoya M, Matsui O, Takashima T, Nonomura A. Hepatocellular carcinoma: correlation of MR imaging and histopathologic findings. Radiology 1992;183(3):819–25. 5)Noureddin M, Lam J, Peterson MR, Middleton M, Hamilton G, Le TA, Bettencourt R, et al. Utility of magnetic resonance imaging versus histology for quantifying changes in liver fat in nonalcoholic fatty liver disease trials. Hepatology 2013;58:1930-1940. 6)Yokoo T, Shiehmorteza M, Hamilton G, Wolfson T, Schroeder ME, Middleton MS, Bydder M, et al. Estimation of hepatic proton-density fat fraction by using MR imaging at 3.0 T. Radiology 2011;258:749-759. 7)Hamilton G, Middleton MS, Hooker JC, Haufe WM, Forbang NI, Allison MA, Loomba R, et al. In vivo breath-hold (1) H MRS simultaneous estimation of liver proton density fat fraction, and T1 and T2 of water and fat, with a multi-TR, multi-TE sequence. J MagnReson Imaging 2015;42:1538-1543. 8)Yu H, Shimakawa A, Hines CD, McKenzie CA, Hamilton G, Sirlin CB, Brittain JH, et al. Combination of complex-based and magnitude-based multiecho water-fat separation for accurate quantification of fat-fraction. MagnReson Med 2011;66:199-206.Figures

ROC curve analysis for accuracy of IOP and PDFF at FA 3°, FA8°, FA9°
AUROC
of IOP and PDFF at FA 3°, FA8°, FA9°

Logistic regression of
IOP and PDFF at FA 3°, FA 8°, FA9°

55
year’s old man with histologically proven moderately differentiated HCC. MRI
shows a small hepatic mass in S6 with moderate T1 hypo-intense lesion on
T1WI(a) shown by arrow, moderately hyper-intense signal on T2WI(b). Arterial
phase (c) shows mild enhancement, portal venous phase(d) and delayed phase(e)
shows washout, hypo-intense lesion shown by arrow. In-phase(f) spoiled
gradient-echo MR image shows iso-intense lesion and opposed phase spoiled
gradient-echo MR image(g) corresponding to (f) shows significant signal drop. MRI-PDFF
shows hyper-intense signal at FA 3° (h), FA 8° (i) and FA 9°
(j).

51 year’s old man with
histologically proven moderately differentiated HCC. MRI shows a hepatic mass
in S4/S8 with moderate T1 hypo-intense signal(a), hyper-intense signal on T2(b).
Arterial phase(c), and portal venous phase(d) shows enhancement, delayed phase
(e) shows washout. In-phase(f) spoiled gradient-echo MR image shows moderate
hyper-intense lesion and opposed phase spoiled gradient-echo MR image(g)
corresponding to (f) shows significant signal drop shown by arrow. MRI-PDFF
shows hyper-intense signal at FA 3° (h), FA 8° (i) and FA 9°
(j).