4395
Texture analysis of multi-phase magnetic resonance images to discriminate expression of Ki67 in hepatocellular carcinoma1Radiology, First Affiliated Hospital of Fujian Medical University, Fuzhou, China
Synopsis
Aims: This study aimed to determine whether texture analysis of preoperative magnetic resonance images could predict expression of Ki67 in hepatocellular carcinoma(HCC).
Methods: 83 patients confirmed HCC were included. Texture analysis on 3.0 Tesla MR Unit included histogram, co-occurrence matrix, run-length matrix, gradient, auto-regressive model, and wavelet transform features as calculated by MaZda software.
Results: HCC with higher Ki67 label index tend to display a lower differentiation pattern. Larger tumors usually had higher Ki67 label index. Texture parameters generated from arterial phase imaging was the most frequently significant correlation.
Conclusions: Texture analysis could be used to discriminate Ki67proliferation status in HCC.
Abstract
Introduction: Hepatocellular carcinoma (HCC) is a global health problem, which is ranked as the sixth most common neoplasm and the third leading cause of cancer-related death[1]. The elevated expression of Ki67 is closely associated with tumor aggressiveness and higher mortality[2]. As previously reported[3], Ki67 label index may be a valuable biomarker for clinical deterioration and the prognosis of an HCC patient. Texture analysis is a sophisticated imaging technique which can generate extensive data from medical imaging[4]. These so called texture features reflect the spatial distribution and signal intensity characteristics of pixels in the images.The aim of our study was to retrospectively evaluate the accuracy of texture analysis derived from MRI to discriminate Ki67 proliferation status in HCC.
Methods: In all 83 patients were included, 25 with low Ki67 (Ki67≤10%) hepatocellular carcinoma (HCC) expression and 58 with high Ki67 (Ki67≥10%) HCC expression as demonstrated by retrospective surgical evaluation. All patients were examined on 3.0 Tesla MR Unit with one standard protocol. The region of interest (ROI) was drawn manually by one radiologist. Texture analysis included histogram, COM (co-occurrence matrix), RLM (run-length matrix), GRA (gradient), ARM (auto-regressive model), and WAV (wavelet transform) features as calculated by MaZda (version 4.6), a quantitative texture analysis software. The features reduced by the Fisher, probability of classification error and average correlation coefficient (POE+ACC), mutual information were used to select the features which predicted Ki67 proliferation status with highest accuracy and then using B11 program for data analysis and classification.
Results: The misclassification rate of the principal component analysis (PCA) in hepatobiliary phase (HBP), T2 weighted imaging (T2WI), arterial phase (AP), and portal vein phase (PVP) was 36/83(43.37%), 35/82(42.68%), 40/83(48.19%), and 34/83(40.96%), respectively. The misclassification of the linear discriminant analysis in HBP, T2WI, AP, and PVP phase was 13/83(15.66%), 21/82(25.61%), 9/83(10.84%), and 8/83(9.64%) respectively. The misclassification of the nonlinear discriminant analysis in HBP, T2WI, AP, and PVP phase was 7/83(8.43%), 6/82(7.32%), 5/83(6.02%), and 7/83(8.43%), respectively.
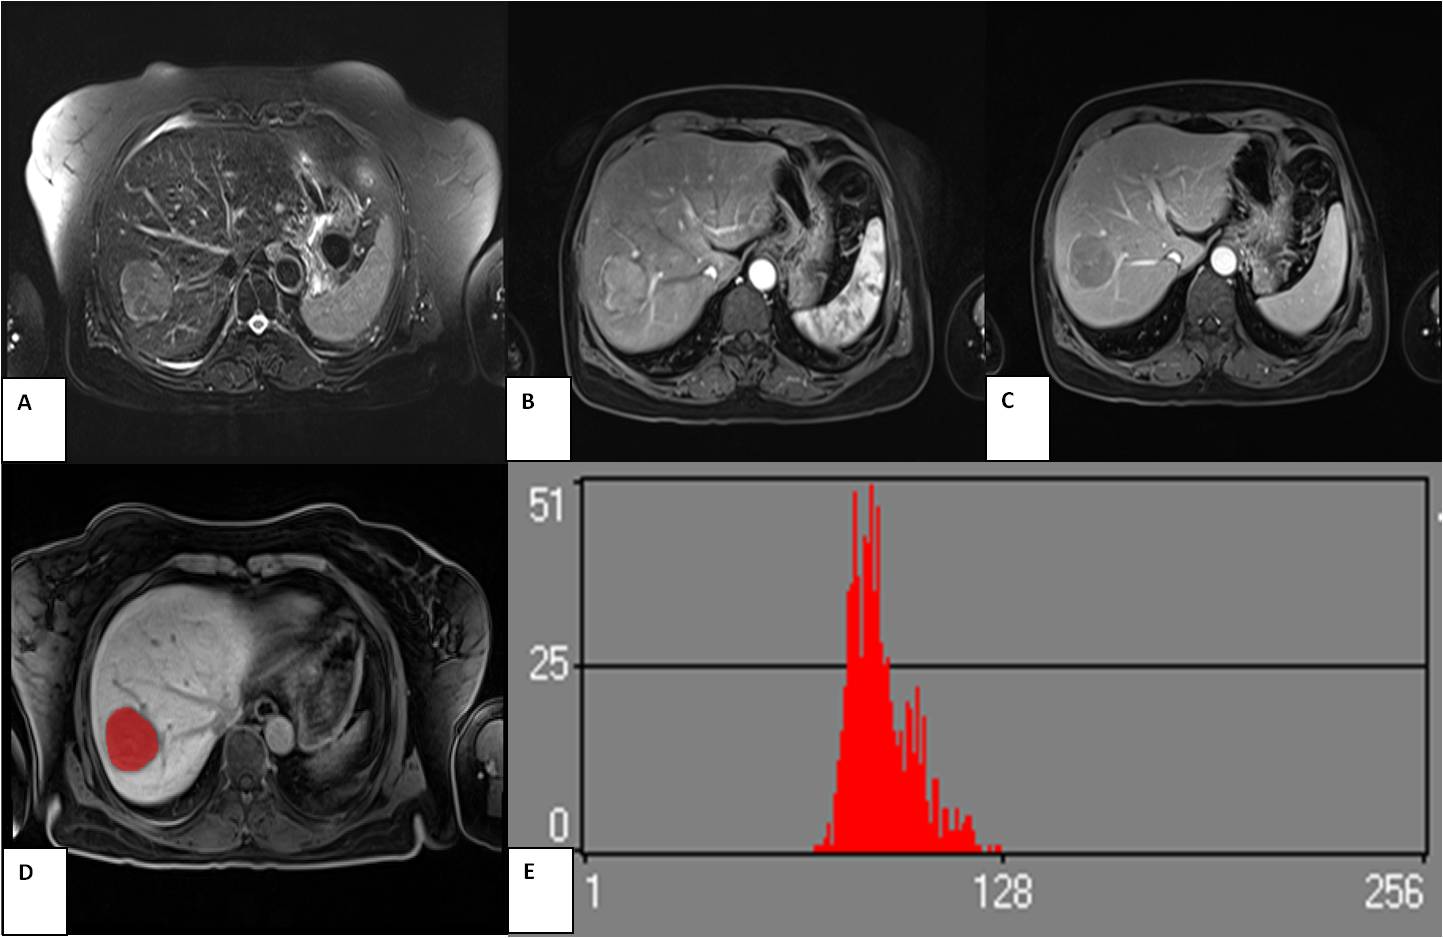
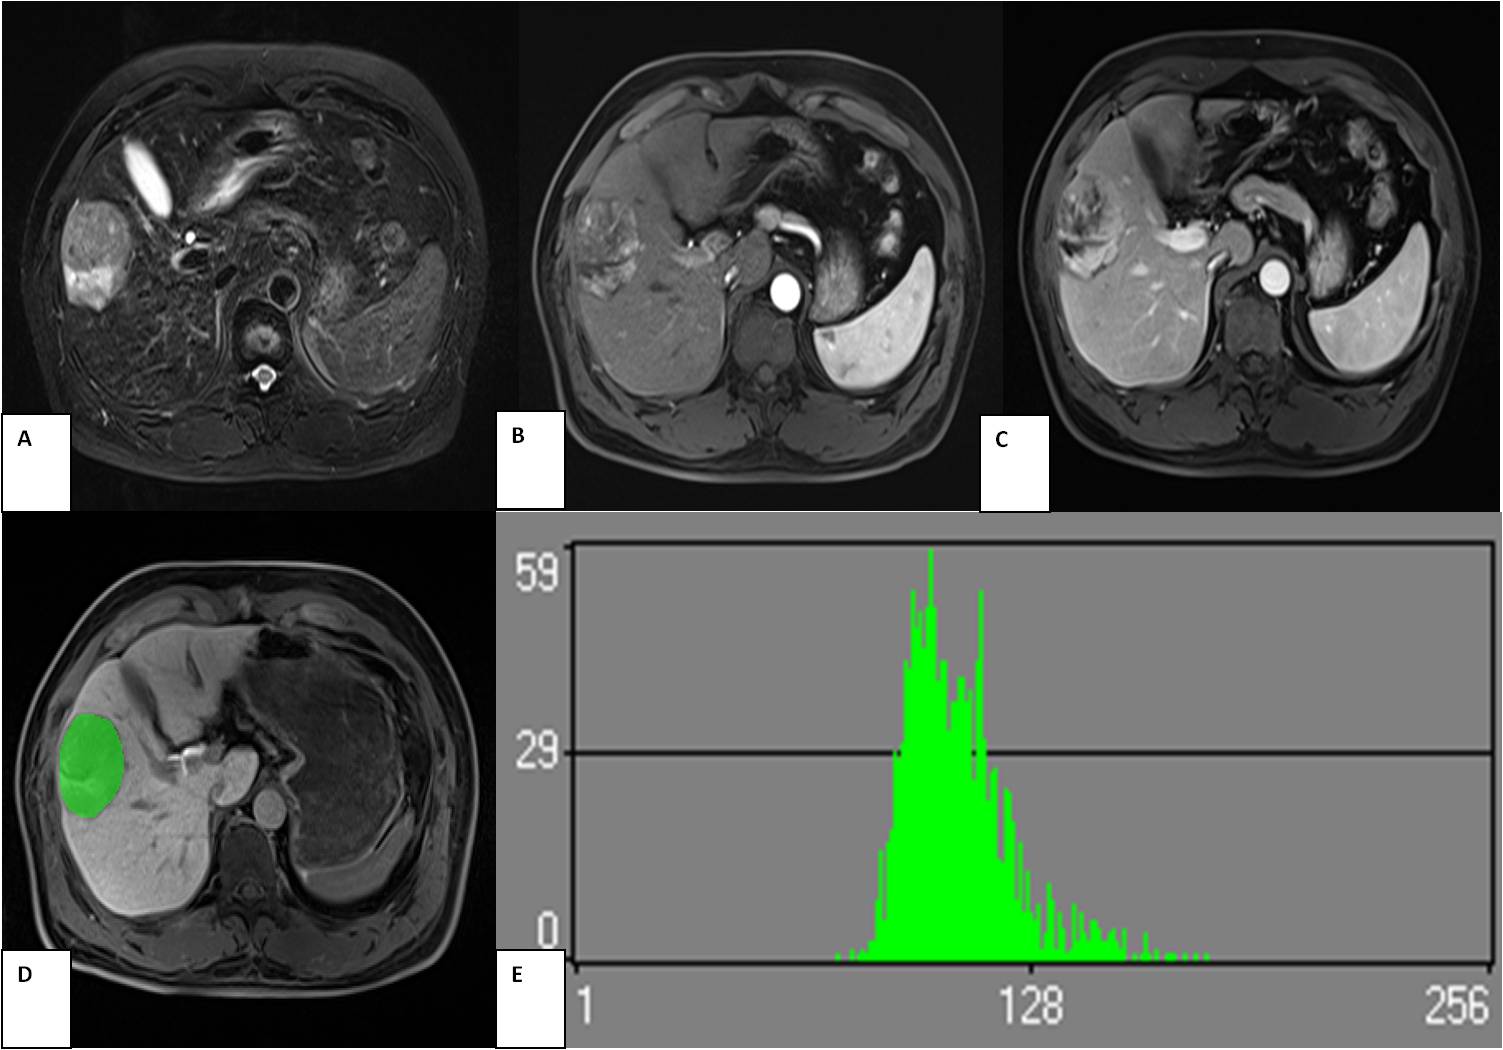
Discussion: HCCs with higher Ki67 LI indicate faster growth and poorer prognosis. In our study, we demonstrated a significant correlation between tumor size and Ki67 index, indicating that larger tumors had higher Ki67 LI. Histological grades were also significantly different between the two groups (high versus low Ki67), suggesting that HCCs with higher Ki67 LI tend to display a lower differentiation pattern. In this study, we used the texture analysis to demonstrate whether texture features can accurately differentiate between low and high Ki67 expressing groups using standard MR scanning imaging. From this research we found that histogram-derived parameters including Variance, Perc.90% and Perc.99% of HBP were positively correlated with Ki67 LI (rho: from 0.252 to 0.272). This suggested that the signal intensity in HBP imaging was detectably higher in the high Ki67 expressing group such that the gray scale of the image changes greatly, which can facilitate visualization of Ki67 (Figure 1 and Figure 2). We could also observe that the five texture parameters derived from the GLRLM of HBP were noticeably different, where signal intensity was more heterogeneous in given directions such as horizontal, vertical, in the high Ki67 group. We speculate that HCCs with high Ki67 LI appear more heterogeneous due to the internal structure of neoplasm. This may be associated with faster growth in high Ki67 expressing groups. Our study findings suggested that the signal intensity is slightly brighter in high Ki67 group compared to the low Ki67 group. We hypothesize this may be indicative of cystic degeneration or necrosis caused by relative insufficient blood supply in the procedure of faster growth. The greater the Contrast, the deeper the texture groove, and the clearer the visual effect. In this study, the AP images were clearer in the low Ki67 expressing group. Correlat, on the other hand, reflects the correlation of the local grayscale between image pixels. When the local grayscale of image pixels is uniformly equal, the correlation is greater. In conclusion, our results suggest that texture analysis of HBP, T2WI, AP and PVP may be used for discriminating Ki67 proliferation status in HCCs. These MRI texture features may directly or indirectly reveal underlying structures similar to traditional histopathology. Therefore, this strategy may provide useful preoperative information beneficial to establishing a treatment plan. Moreover, during the monitoring and follow-up of HCC during and after treatment, this novel application may also offer a non-invasive alternative.
Conclusions: Texture analysis of HBP, AP and PVP were helpful for predicting the Ki67 expression and may provide less-invasive achievement of critical histopathology markers for HCC.
Acknowledgements
This study has received funding by Fujian Provincial Health and Family Planning Commission (CN) (Award Number: 2017-CX-27),Fujian Provincial Department of Science and Technology (CN) (Award Number: 2015J0105) and Fujian Medical Elite Cultivation Program (CN) ( Award Number: 2015-ZQN-ZD-19).References
References
[1] Forner A, Reig M, Bruix J. Hepatocellular carcinoma. Lancet 2018;391(10127):1301-14.
[2] Nakanishi K, Sakamoto M, Yamasaki S, Todo S, Hirohashi S. Akt phosphorylation is a risk factor for early disease recurrence and poor prognosis in hepatocellular carcinoma. Cancer 2005;103(2):307-12.
[3] Luo Y, Ren F, Liu Y, et al. Clinicopathological and prognostic significance of high Ki-67 labeling index in hepatocellular carcinoma patients: a meta-analysis. International journal of clinical and experimental medicine 2015;8(7):10235-47.
[4] Incoronato M, Aiello M, Infante T, et al. Radiogenomic Analysis of Oncological Data: A Technical Survey. International journal of molecular sciences 2017; 18(4).
Figures