4394
Quantitative Transport Mapping (QTM): a new AIF-free perfusion technique to distinguish malignant and benign breast lesions1Weill Cornell Medicine, New York, NY, United States, 2Memorial Sloan Kettering Cancer Center, New York, NY, United States, 3Cornell University, Ithaca, NY, United States
Synopsis
Quantitative perfusion imaging is challenging in the breast because the requisite arterial input function (AIF) is difficult to measure given the lack of large-caliber feeding arteries. To overcome this problem, we show that quantitative transport mapping (QTM), a new AIF-free perfusion model, is not only technically feasible in the breast, but has the potential to better distinguish malignant from benign breast lesions compared to conventional perfusion modeling.
Introduction
Breast tumors demonstrate increased blood flow and increased capillary permeability, which makes dynamic contrast-enhanced MRI a highly sensitive tool for cancer detection.1 Breast MRI specificity, however, is approximately 80 percent,2 creating a clinical need for more precise perfusion methods to improve the diagnostic accuracy breast MRI. Conventional Kety modeling,3 which depends on an accurate arterial input function (AIF) measurement, is problematic in the breast. The breast is supplied by several small-caliber arteries, making AIF measurement unreliable, or even impossible. For this reason, less-than-ideal population-based AIF measurements are often used.4 We propose replacing the Kety model with quantitative transport mapping(QTM),5,6 based on the physical transport equation, thus eliminating the need for the AIF. Herein we share preliminary QTM results in malignant and benign breast lesions.Methods
This HIPPA-compliant, IRB-approved retrospective study included 12 consecutive breast lesions that: 1) were identified on ultrafast-DCE MRI as part of a hybrid protocol with conventional DCE MRI, 2) subsequently underwent image-guided biopsy to reveal an invasive cancer or benign pathology, and 3) had a lesion volume greater than 300mm3. All patients underwent MRI examinations on a 3.0T GE MRI system. Ultrafast DCE-MRI using Differential Subsampling with Cartesian Ordering (DISCO) was acquired continuously for 15 phases (16-channel-breast-coil) or 10 phases (8-channel-breast-coil) during the first 60 seconds, starting at the time of of contrast injection (0.1mmol/kg gadobutrol). Additional acquisition parameters include: TR/TE=3.8/1.7msec, flip angle=10°, in-plane spatial resolution=1.6×1.6mm, thickness=1.6mm, temporal resolution=3.0–7.6 seconds, axial orientation.
For each case, a radiologist with 4 years of experience selected the axial slice best displaying the lesion. Signal intensity was converted to relative enhancement, which was taken as tracer concentration, given the assumed linear relationship between relaxation rate and concentration. QTM was implemented on the 4D imaging data using the Fokker-Planck equation assuming incompressible flow:7
$$\arg\min_{\bf U}\sum_{t}\|\dot{C}(t,{\bf r})+\nabla C(t,{\bf r})\cdot {\bf U}({\bf r})\|_2^2+\lambda\left(\|\nabla u({\bf r})\|_2^2+\|\nabla v({\bf r})\|_2^2+\|\nabla w({\bf r})\|_2^2\right)$$ where $$${\bf U}({\bf r})=u({\bf r})\hat{\bf x}+v({\bf r})\hat{\bf y}+w({\bf r})\hat{\bf z}$$$ are velocity components in spatial dimension and $$$\nabla$$$ denotes spatial gradient. A lambda of 20 was selected. From U(r), the vector flow, f, into a voxel was computed: $$${\bf f}({\bf r})=a_xu({\bf r})\hat{\bf x}+a_yv({\bf r})\hat{\bf y}+a_zw({\bf r})\hat{\bf z}$$$ where ax, ay and az are the cross sectional areas of the voxel.
A blood flow map was computed:
$$$f_{QTM}=|{\bf f}|V(100/(\rho\nu))^{2/3}$$$
, with tissue density $$$\rho$$$ taken as 1.08g/ml, blood
volume V taken as 1.2%8 and v as voxel
volume (in mm3) . fQTM was compared with fKety,
which was computed using a standard two compartment model:
$$\arg\min_{k_a,k_2}\sum_{t}\|\dot{C}(t)-k_aC_a(t)+k_2C(t)\|_2^2$$
For each lesion, the AIF was measured in the ipsilateral internal
mammary artery.
Breast lesions were semi-automatically segmented by a
radiologist. Mean fQTM and
mean fKety were
calculated for each lesion. Paired t-tests evaluated whether there was a
significant difference in blood flow between malignant and benign lesions, and
whether there was a significant difference between fQTM
and fKety across all lesions.
Results
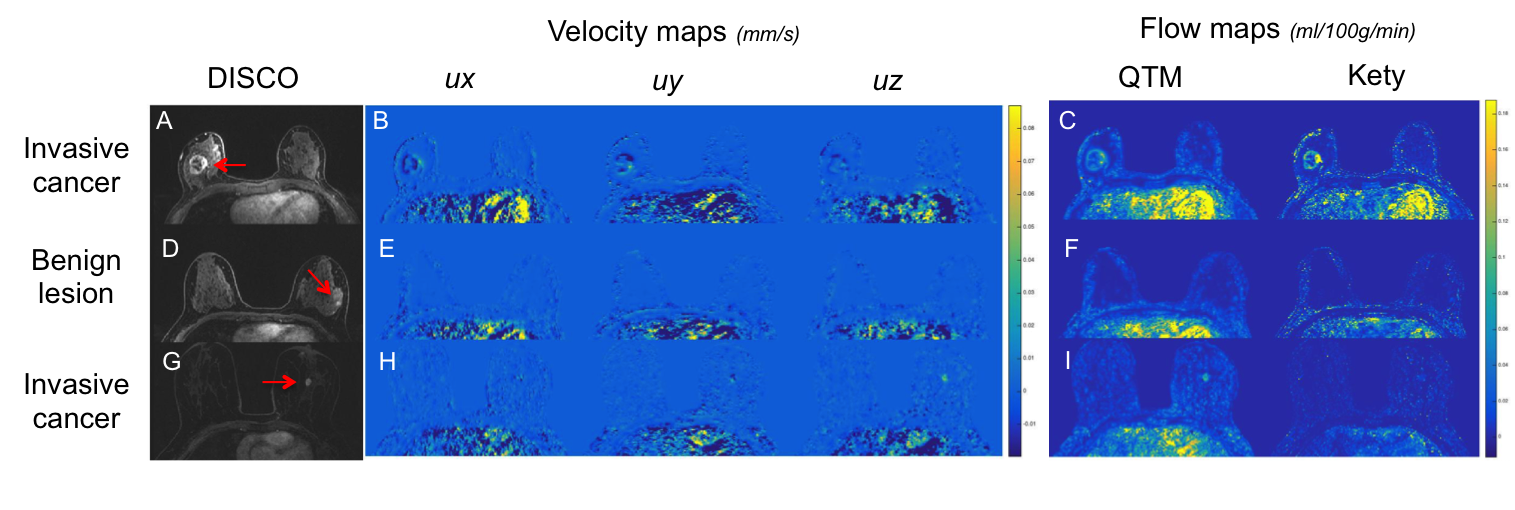
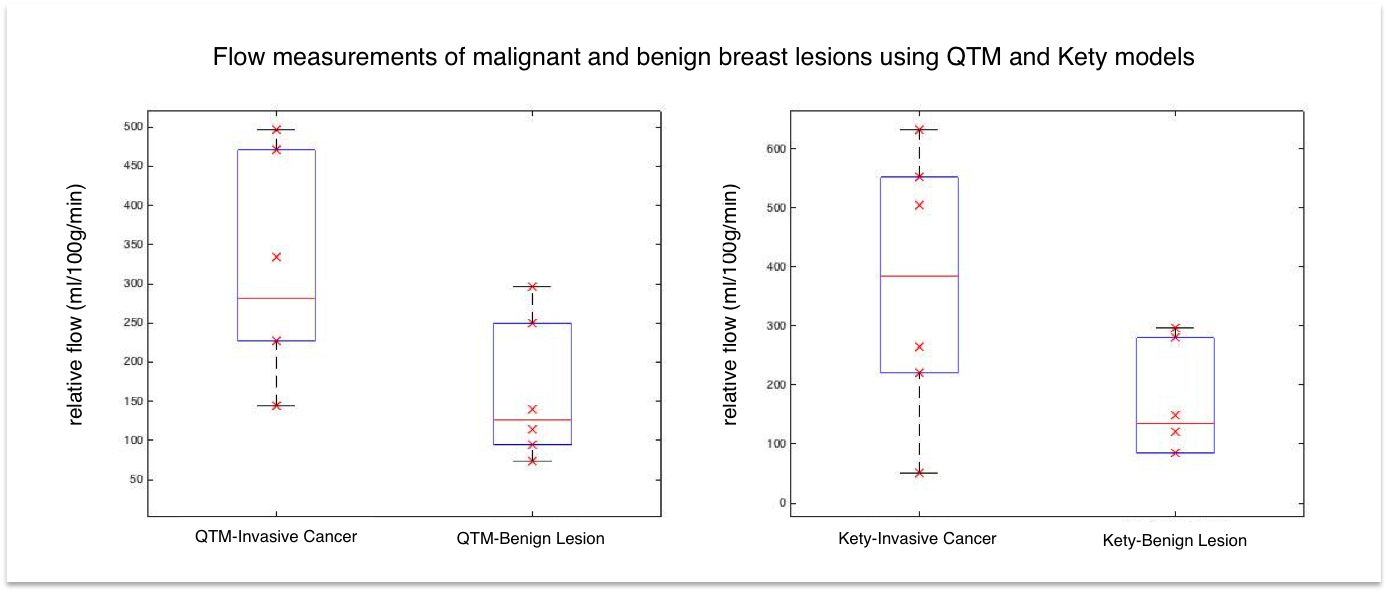
Of the 12 breast lesions, six were invasive cancer and six were benign. fQTM and fKety were successfully reconstructed in all cases. DISCO images, velocity maps, and flow maps for two malignant lesions and one benign lesion are shown in Fig 1. Good general agreement between the methods is observed for the first malignant case and the benign case. In the third case, the malignant lesion is apparent on fQTM but not as well seen on fKety. In Fig. 2, a box plot shows the mean fQTM and fKety for all lesions. Paired t-tests demonstrated a statistically significant difference between malignant and benign lesions using fQTM (p=0.04), but no statistically significant difference using fKety (p=0.07). There was no statistically significant difference between fQTM and fKety across all lesions (p=0.65).Discussion
Our preliminary results demonstrate the feasibility of QTM for AIF-free perfusion modeling in the breast. QTM flow maps were generally similar to the conventional Kety-based analysis. Interestingly, even in this small dataset, QTM better distinguished malignant and benign breast lesions compared to Kety, suggesting it has the potential to increase the specificity of breast MRI. The breast lacks of a large-caliber feeding artery, making conventional AIF-reliant Kety modeling problematic. QTM is therefore particularly well-suited for breast lesion characterization.Conclusion
QTM is a new technically-feasible AIF-free MR perfusion technique, which may be better able to better distinguish malignant and benign lesions compared to conventional Kety methods. These promising results warrant further exploration in a larger patient population.Acknowledgements
No acknowledgement found.References
1. Berg WA, et al: Detection of breast cancer with addition of annual screening ultrasound or a single screening MRI to mammography in women with elevated breast cancer risk. JAMA 307:1394-1404, 2012.
2. Lo G, Scaranelo AM, Aboras H, et al. Evaluation of the Utility of Screening Mammography for High-Risk Women Undergoing Screening Breast MR Imaging. Radiology 2017; 285:36.
3. Cuenod, C.A. and Balvay, D. Perfusion and vascular permeability: Basic concepts and measurement in DCE-CT and DCE-MRI. Diagnostic and interventional imaging. 2013. 94(12): 1187:1204.
4. Parker GJ, Roberts, C. et al. Experimentally-derived functional form for a population-averaged high-temporal-resolution arterial input function for dynamic contrast-enhanced MRI. Magn Reson Med. 2006. Nov;56(5):993-1000.
5. Spincemaille P, Zhang Q, Nguyen TD, Wang Y. Vector Field Perfusion Imaging. Proc. Intl. Soc. Mag. Recon. Med. 25, 2017.
6. Zhou, L, Spincemaille, P. Vector Field Perfusion Imaging: A Validation Study by Using Multiphysics Model. Proc. Intl. Soc. Mag. Reson. Med 26 (2018).
7. Darve E, Solomon J, Kia A. Computing generalized Langevin equations and generalized Fokker-Planck equations. Proc Natl Acad Sci U S A 2009;106(27):10884-10889.
8. Delille, J, et al. Measurements of Regional Blood Flow and Blood Volume in Breast Cancer With MRI. Proc. Intl. Soc. Mag. Reson. Med 9 (2001)
Figures