4393
Spine Quantitative Susceptibility Mapping Using In-Phase Echoes to Initialize the Nonconvex Optimization Problem of Fat-Water Separation (R2*-IDEAL)1Guangdong Provincial Key Laboratory of Medical Image Processing, School of Biomedical Engineering, Southern Medical University, Guangzhou, China, 2Department of Radiology, Weill Medical College of Cornell University, New York, NY, United States, 3Department of Biomedical Engineering, Cornell University, Ithaca, NY, United States
Synopsis
This work aims to investigate the initializations of R2* and field maps in R2*-IDRAL for developing a robust quantitative susceptibility mapping (QSM) in the spine. A 3D multi-echo GRE sequence was implemented to acquire out-phase and in-phase (IP) echoes in 10 subjects. The R2* and background field maps estimated by fitting the magnitude and phase of IP echoes were used to initialize R2*-IDEAL to obtain final R2*, field, water, and fat maps. The final field map was further processed to generate QSM. The results demonstrated that IP initializations of R2* and field in R2*-IDEAL provide robust QSM of the spine.
Introduction
Magnetic susceptibility may be indicative of vertebral disorders, such as pathologic changes in calcification and hematopoietic bone marrow(1), but has yet to be studied using quantitative susceptibility mapping (QSM)(2). In extending QSM from the brain to other body parts such as liver(3-6), heart(7) and spine(8,9), a major challenge is to remove the fat chemical shift contribution to the MRI signal phase in estimating the susceptibility-generated magnetic field(10,11). However, due to similar amounts of fat and water in the spine, it is difficult to solve the nonconvex optimization problem of fat-water separation (R2*-IDEAL). We propose here to use IP echoes for initializing field and R2* in the R2*-IDEAL problem and investigate IP initialization performance against Zero(12) and SPURS(5) initializations for spine QSM.Methods
All exams were performed under protocols approved by the institutional review board and were HIPAA compliant. Ten healthy subjects (7 males, 3 females, age range 24-32 years, mean=28.1 years) were scanned using a 3D chemical shift-encoded six-echo GRE sequence with two successive TRs (9.3ms for both) on a 3T scanner. For the first TR, out-phase echoes (120o between water and fat) were acquired with TE=1.5, 3.8, 6.1ms. For the second TR, IP echoes were acquired with TE=2.3, 4.6, 6.9ms. The other scan parameters were: FA=15º, field of view=25.6×18.0×15.2cm3, voxel size=2×2×2mm3, number of average=2, and total acquisition time=5min.
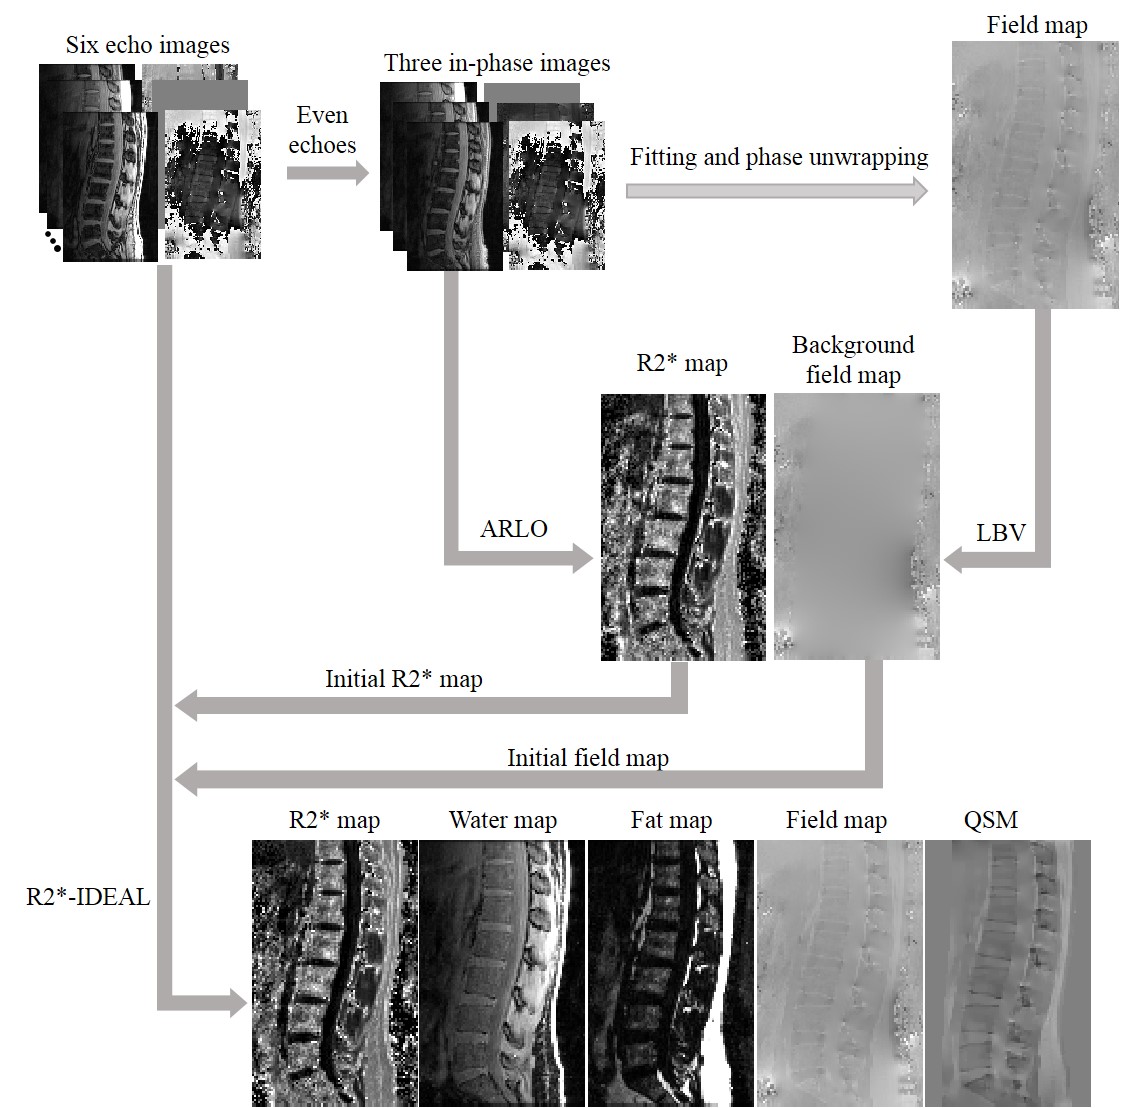
R2*-IDEAL was then solved using three initialization methods: SPURS(5), Zero(12) , and the IP. For the IP method (flowchart in Fig.1), the initial R2* map was obtained from magnitude images of IP echoes by using auto-regression on linear operations(13). The initial field map was obtained using the following steps: 1) a field map was estimated from the phase of IP echoes by using a nonlinear least square fitting method(14); 2) the estimated field map was unwrapped by using a graph cuts approach(5,15); 3) a background field obtained from the unwrapped field map by solving the Laplacian boundary value problem (LBV)(16) was set as the initial field map. After the field map was obtained by R2*-IDEAL, the LBV method was used for background field removal(16), and then QSM was computed by using the preconditioned field inversion method(17). PDFF was computed from the R2*-IDEAL fat and water maps. For resolving calcification and fat in bone marrow, a correction on vertebral QSM with fat susceptibility (χfat) was also performed to remove the effect of χfat (6).
Results
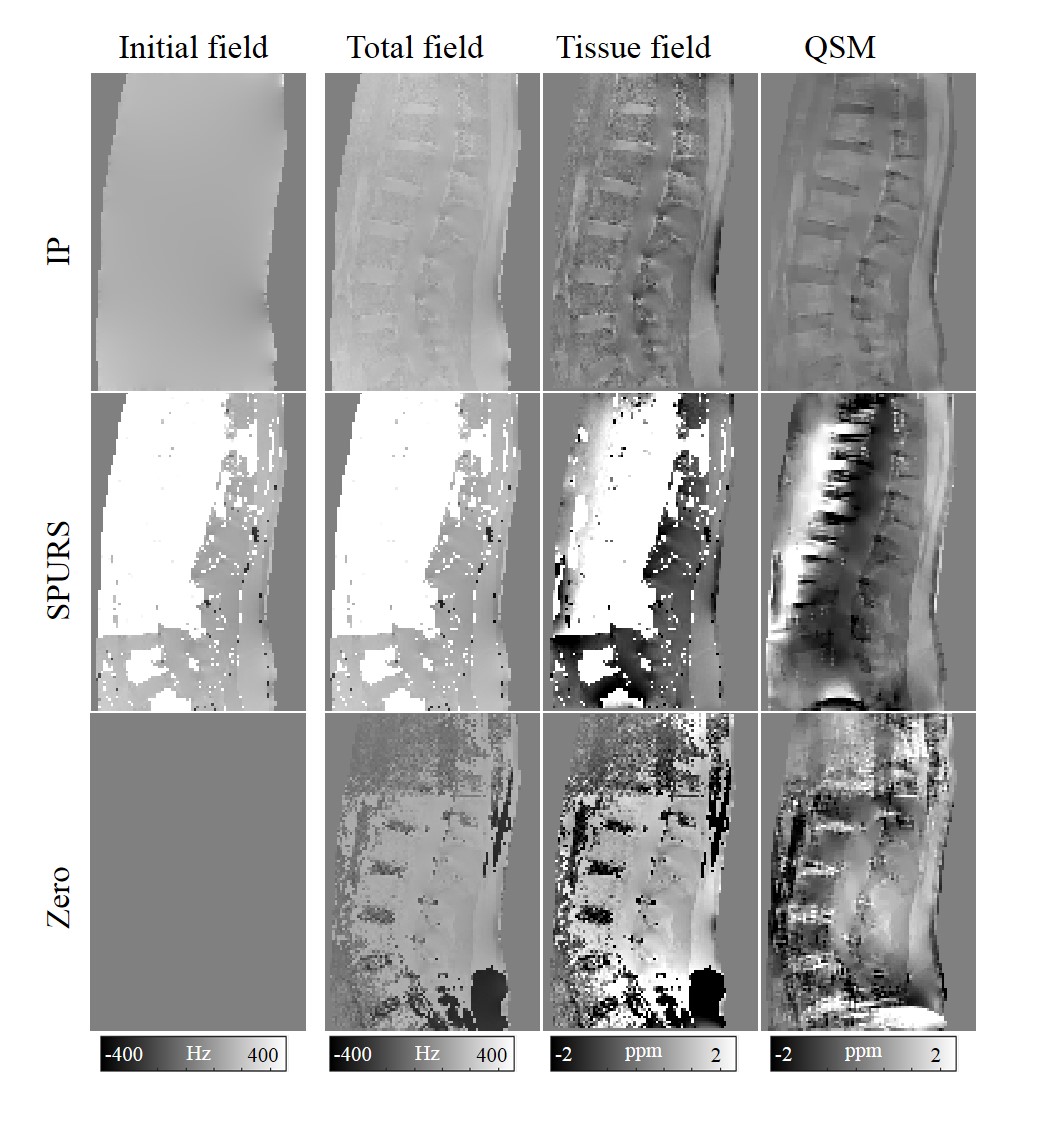
Figure 2 compares different initial field map methods (IP, SPURS, and Zero) for R2*-IDEAL. The initial field map with the SPURS method has very large errors in the vertebrae and tissue boundaries, which is not addressed in the R2*-IDEAL step and propagates to subsequent QSM. For the Zero initialization method, the field map obtained from R2*-IDEAL has errors in the disc area, resulting in incorrect QSM. In contrast, R2*-IDEAL with the IP method produces a homogenous field map and reliable QSM with clear vertebral structure.
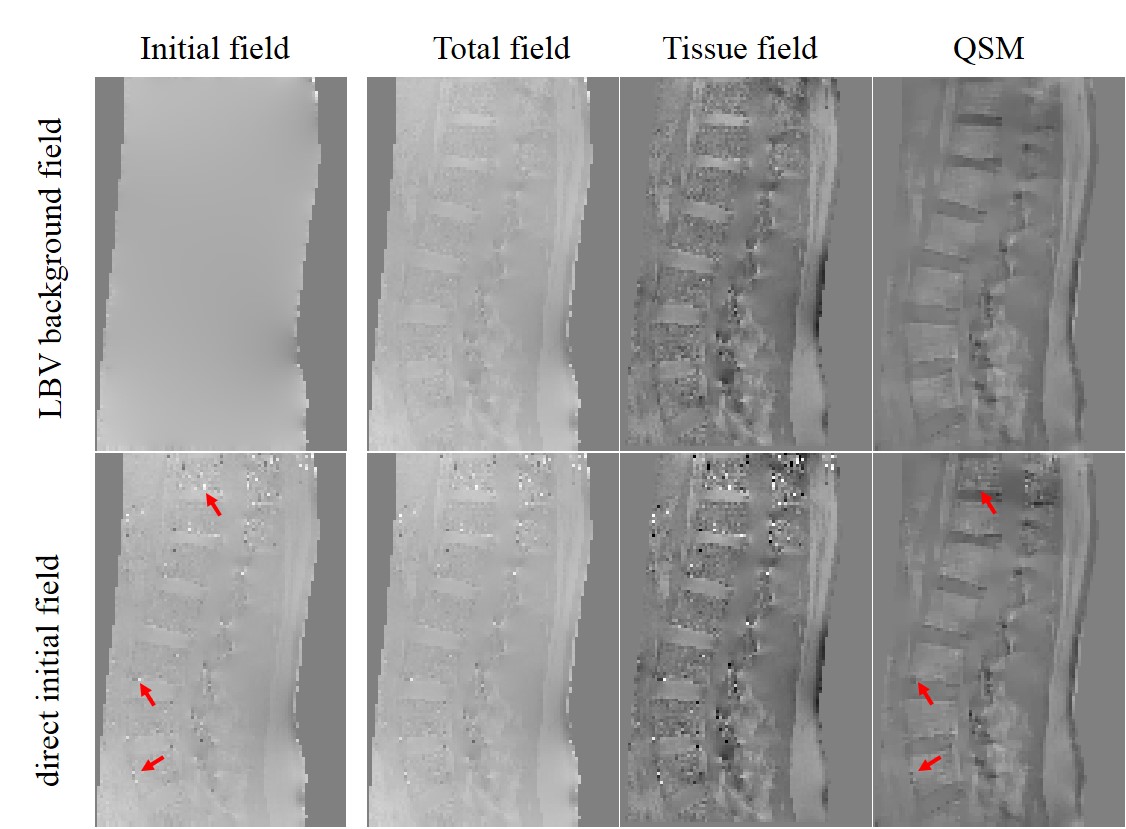
Figure 3 compares the LBV background and direct initial field estimated from IP echoes for initializing R2*-IDEAL. There are noisy bright and dark spots (red arrows) in the direct initial field map that remain in the R2*-IDEAL output, resulting in artifacts in QSM (red arrows). Using the LBV background field as an initialization prevents the appearance of noisy bright and dark spots in the final field of the R2*-IDEAL output, and QSM shows clear structure with less noise.
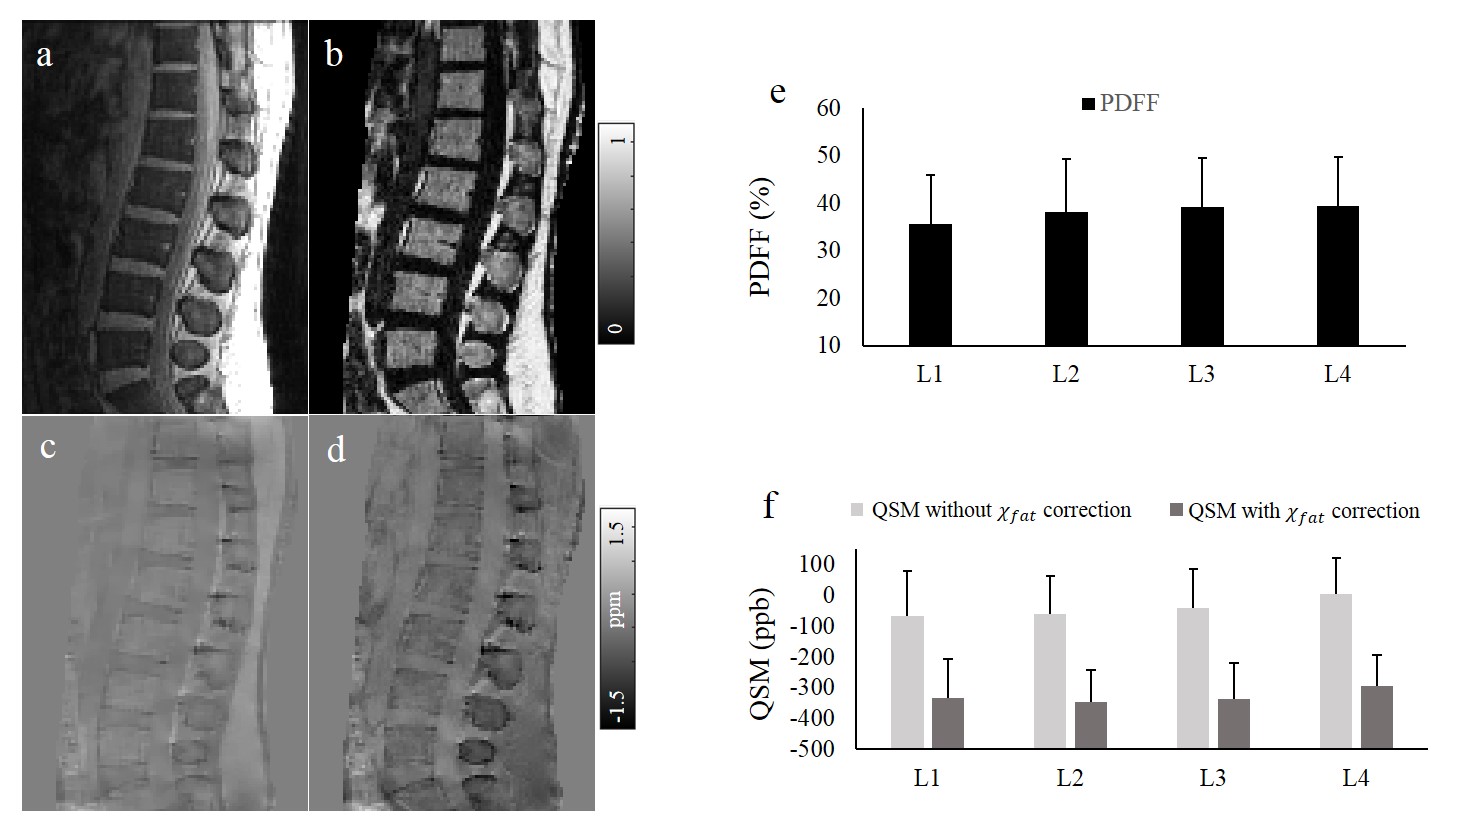
PDFF and QSM reconstructions with the IP method are successful in all 10 healthy subjects. The PDFF map and QSM without and with χfat correction showed clear structure of the spine in Fig.4b-d. The mean and standard deviations of PDFF and QSM without and with χfat correction values within the vertebrae (L1-L4) for all 10 healthy subjects are shown in Fig.4e,f. The PDFF, QSM without χfat correction, and QSM with χfat correction all showed trends of increasing from L1 to L4.
Discussion and Conclusion
Our results indicate robust spine QSM using IP initialization for R2*-IDEAL, while SPURS and Zero initialization substantially deviate from the true solution and result in marked errors in the final field map. IP initialization provides estimates of field and R2* close to the global minimum and overcomes errors in the final field map in the R2*-IDEAL output, therefore enabling reliable spine QSM. A specific implementation for spine QSM data acquisition, as demonstrated in this preliminary work, is to use two successive TRs for acquiring out-phase and IP echoes.
In conclusion, Spine QSM is robust with R2* and background field maps obtained from IP echoes as initialization for R2*-IDEAL. Simultaneous PDFF and QSM from a multi-echo GRE sequence is feasible in the human spine using a gradient-echo sequence with IP echoes.
Acknowledgements
The current work is supported by NIH grant R01 NS095562, R01 NS090464, and National Natural Science Foundation of China (81871349, 61671228, and 61728107).References
1. Schick F, Nagele T, Lutz O, Pfeffer K, Giehl J. Magnetic susceptibility in the vertebral column. J Magn Reson B 1994;103(1):39-52.
2. de Rochefort L, Liu T, Kressler B, et al. Quantitative susceptibility map reconstruction from MR phase data using bayesian regularization: validation and application to brain imaging. Magnetic resonance in medicine 2010;63(1):194-206.
3. Sharma SD, Hernando D, Horng DE, Reeder SB. Quantitative susceptibility mapping in the abdomen as an imaging biomarker of hepatic iron overload. Magnetic resonance in medicine 2015;74(3):673-683.
4. Sharma SD, Fischer R, Schoennagel BP, et al. MRI-based quantitative susceptibility mapping (QSM) and R2* mapping of liver iron overload: Comparison with SQUID-based biomagnetic liver susceptometry. Magnetic resonance in medicine : official journal of the Society of Magnetic Resonance in Medicine / Society of Magnetic Resonance in Medicine 2016.
5. Dong J, Liu T, Chen F, et al. Simultaneous phase unwrapping and removal of chemical shift (SPURS) using graph cuts: application in quantitative susceptibility mapping. IEEE Transactions on Medical Imaging 2015;34(2):531-540.
6. Li J, Lin H, Liu T, et al. Quantitative susceptibility mapping (QSM) minimizes interference from cellular pathology in R2* estimation of liver iron concentration. Journal of magnetic resonance imaging : JMRI 2018.
7. Wen Y, Nguyen TD, Liu Z, et al. Cardiac quantitative susceptibility mapping (QSM) for heart chamber oxygenation. Magnetic resonance in medicine 2018;79(3):1545-1552.
8. Chen Y, Guo Y, Zhang X, Mei Y, Feng Y, Zhang X. Bone susceptibility mapping with MRI is an alternative and reliable biomarker of osteoporosis in postmenopausal women. European radiology 2018. 9. Guo Y, Chen Y, Zhang X, et al. Magnetic Susceptibility and Fat Content in the Lumbar Spine of Postmenopausal Women With Varying Bone Mineral Density. Journal of magnetic resonance imaging : JMRI 2018.
10. Wang Y, Spincemaille P, Liu Z, et al. Clinical quantitative susceptibility mapping (QSM): Biometal imaging and its emerging roles in patient care. Journal of magnetic resonance imaging : JMRI 2017. 11. 11. Wang Y, Liu T. Quantitative susceptibility mapping (QSM): Decoding MRI data for a tissue magnetic biomarker. Magnetic resonance in medicine 2015;73(1):82-101.
12. Reeder SB, Wen Z, Yu H, et al. Multicoil Dixon chemical species separation with an iterative least-squares estimation method. Magnetic resonance in medicine 2004;51(1):35-45.
13. Pei M, Nguyen TD, Thimmappa ND, et al. Algorithm for fast monoexponential fitting based on Auto-Regression on Linear Operations (ARLO) of data. Magnetic resonance in medicine 2015;73(2):843-850.
14. Liu T, Wisnieff C, Lou M, Chen W, Spincemaille P, Wang Y. Nonlinear formulation of the magnetic field to source relationship for robust quantitative susceptibility mapping. Magnetic resonance in medicine 2013;69(2):467-476.
15. Bioucas-Dias JM, Valadao G. Phase Unwrapping via Graph Cuts. IEEE Transactions on Image Processing 2007;16(3):698-709.
16. Zhou D, Liu T, Spincemaille P, Wang Y. Background field removal by solving the Laplacian boundary value problem. NMR in biomedicine 2014;27(3):312-319.
17. Liu Z, Kee Y, Zhou D, Wang Y, Spincemaille P. Preconditioned total field inversion (TFI) method for quantitative susceptibility mapping. Magnetic resonance in medicine 2016.
Figures