4392
MR Relaxivity Mapping using multi-dimensional integrated (MDI) complex signal ratio1UIH America, Inc., Houston, TX, United States
Synopsis
A novel relaxivity mapping method for MR transverse relaxivity mapping (e.g. T2*) is proposed and demonstrated. By extracting an overall complex signal ratio by means of multi-dimensional integration (MDI) , our method offers significantly improved SNR and homogeneous parametric mappings. With MDI, no explicit multi-channel combination operation is required, and calculation efficiency is extremely high for inline calculation.
Introduction
To date, curve fitting is the dominating methodology for quantifying MR relaxivity such as T2*, utilizing the decaying signals acquired at multiple echo times (TEs), along with many mathematical models and optimization algorithms1. However, curve fitting only works on multi-channel combined magnitude images, in which noise distribution is modified and may introduce a mapping bias for low SNR regions. Moreover, depending on the combination algorithm (e.g. SOS and ACC2), additional variation in noise and signal of the combined magnitude images may occur spatially and temporally (i.e. among echoes). On the other hand, quantifying T2* from echo signal ratio has the potential to provide a much simpler yet more comprehensive solution. The reason for the low popularity of this strategy has been the relatively low SNR and mapping sensitivity in the signal ratio. In this work, we propose addressing these issues by extracting an overall complex signal ratio by means of multi-dimensional integration (MDI). With MDI, the need for explicit multi-channel signal combination is eliminated while optimal SNR and sensitivity in the final T2* maps can be achieved.Methods
Consider a data set (2D or 3D) with Ne echoes and Nc channels. The signal of echo ne and channel nc is:
$$$S(n_{e},n_{c})=C_{nc}S_{nc}e^{-TE_{ne} /T_{2}^{*}+i\Delta \omega TE_{ne}+i\varphi _{0}}$$$ [1]
where Cnc and Snc are coil sensitivity profile and baseline signal of channel nc, Δω is off-resonance frequency, and φ0 is baseline phase terms. Define the individual complex signal ratio of echo ne and channel nc as:
$$$\Delta S(n_{e},n_{c}) = \frac{S(n_{e+1} ,n_{c})}{S(n_{e},n_{c})}=e^{-\Delta TE/T_{2}^{*}+i\Delta \omega \Delta TE}$$$ [2]
Where ΔTE is echo spacing. It is clear that the terms of Cnc and TEs have been eliminated, making the ratio independent of channel and echo. By solving the following least square problem, an overall ΔS, with mathematically identical form as Eq.2, can be obtained:
$$$argmin_{\Delta S}\sum_{n_{e}=1}^{N_{e}-1}\sum_{n_{c}=1}^{N_{c}}||S(n_{e}+1,n_{c})-S(n_{e},n_{c})\Delta S||_{2}^{2}$$$ [3]
Finally, T2* can be directly obtained as $$$T_{2}^{*}=-\Delta TE/ln|\Delta S|$$$.
For demonstration, 2D multi-echo GRE knee images were collected on a 1.5T scanner (uMR560, UIH, Shanghai) with a 12-channel knee coil, using following parameters: 8x echoes with monopolar readouts, TE=4.4~34.9ms with ΔTE=4.4ms, matrix size=205x256x10, voxel size=0.78x0.78x3mm. MDI results were obtained using uncombined images as well as ACC combined images. For comparison with curve fitting methods, two exponential models with (i.e. 3-parameter model) and without (i.e. 2-parameter model) noise offset terms and a 2-parameter linear model were tested on ACC images.
Results
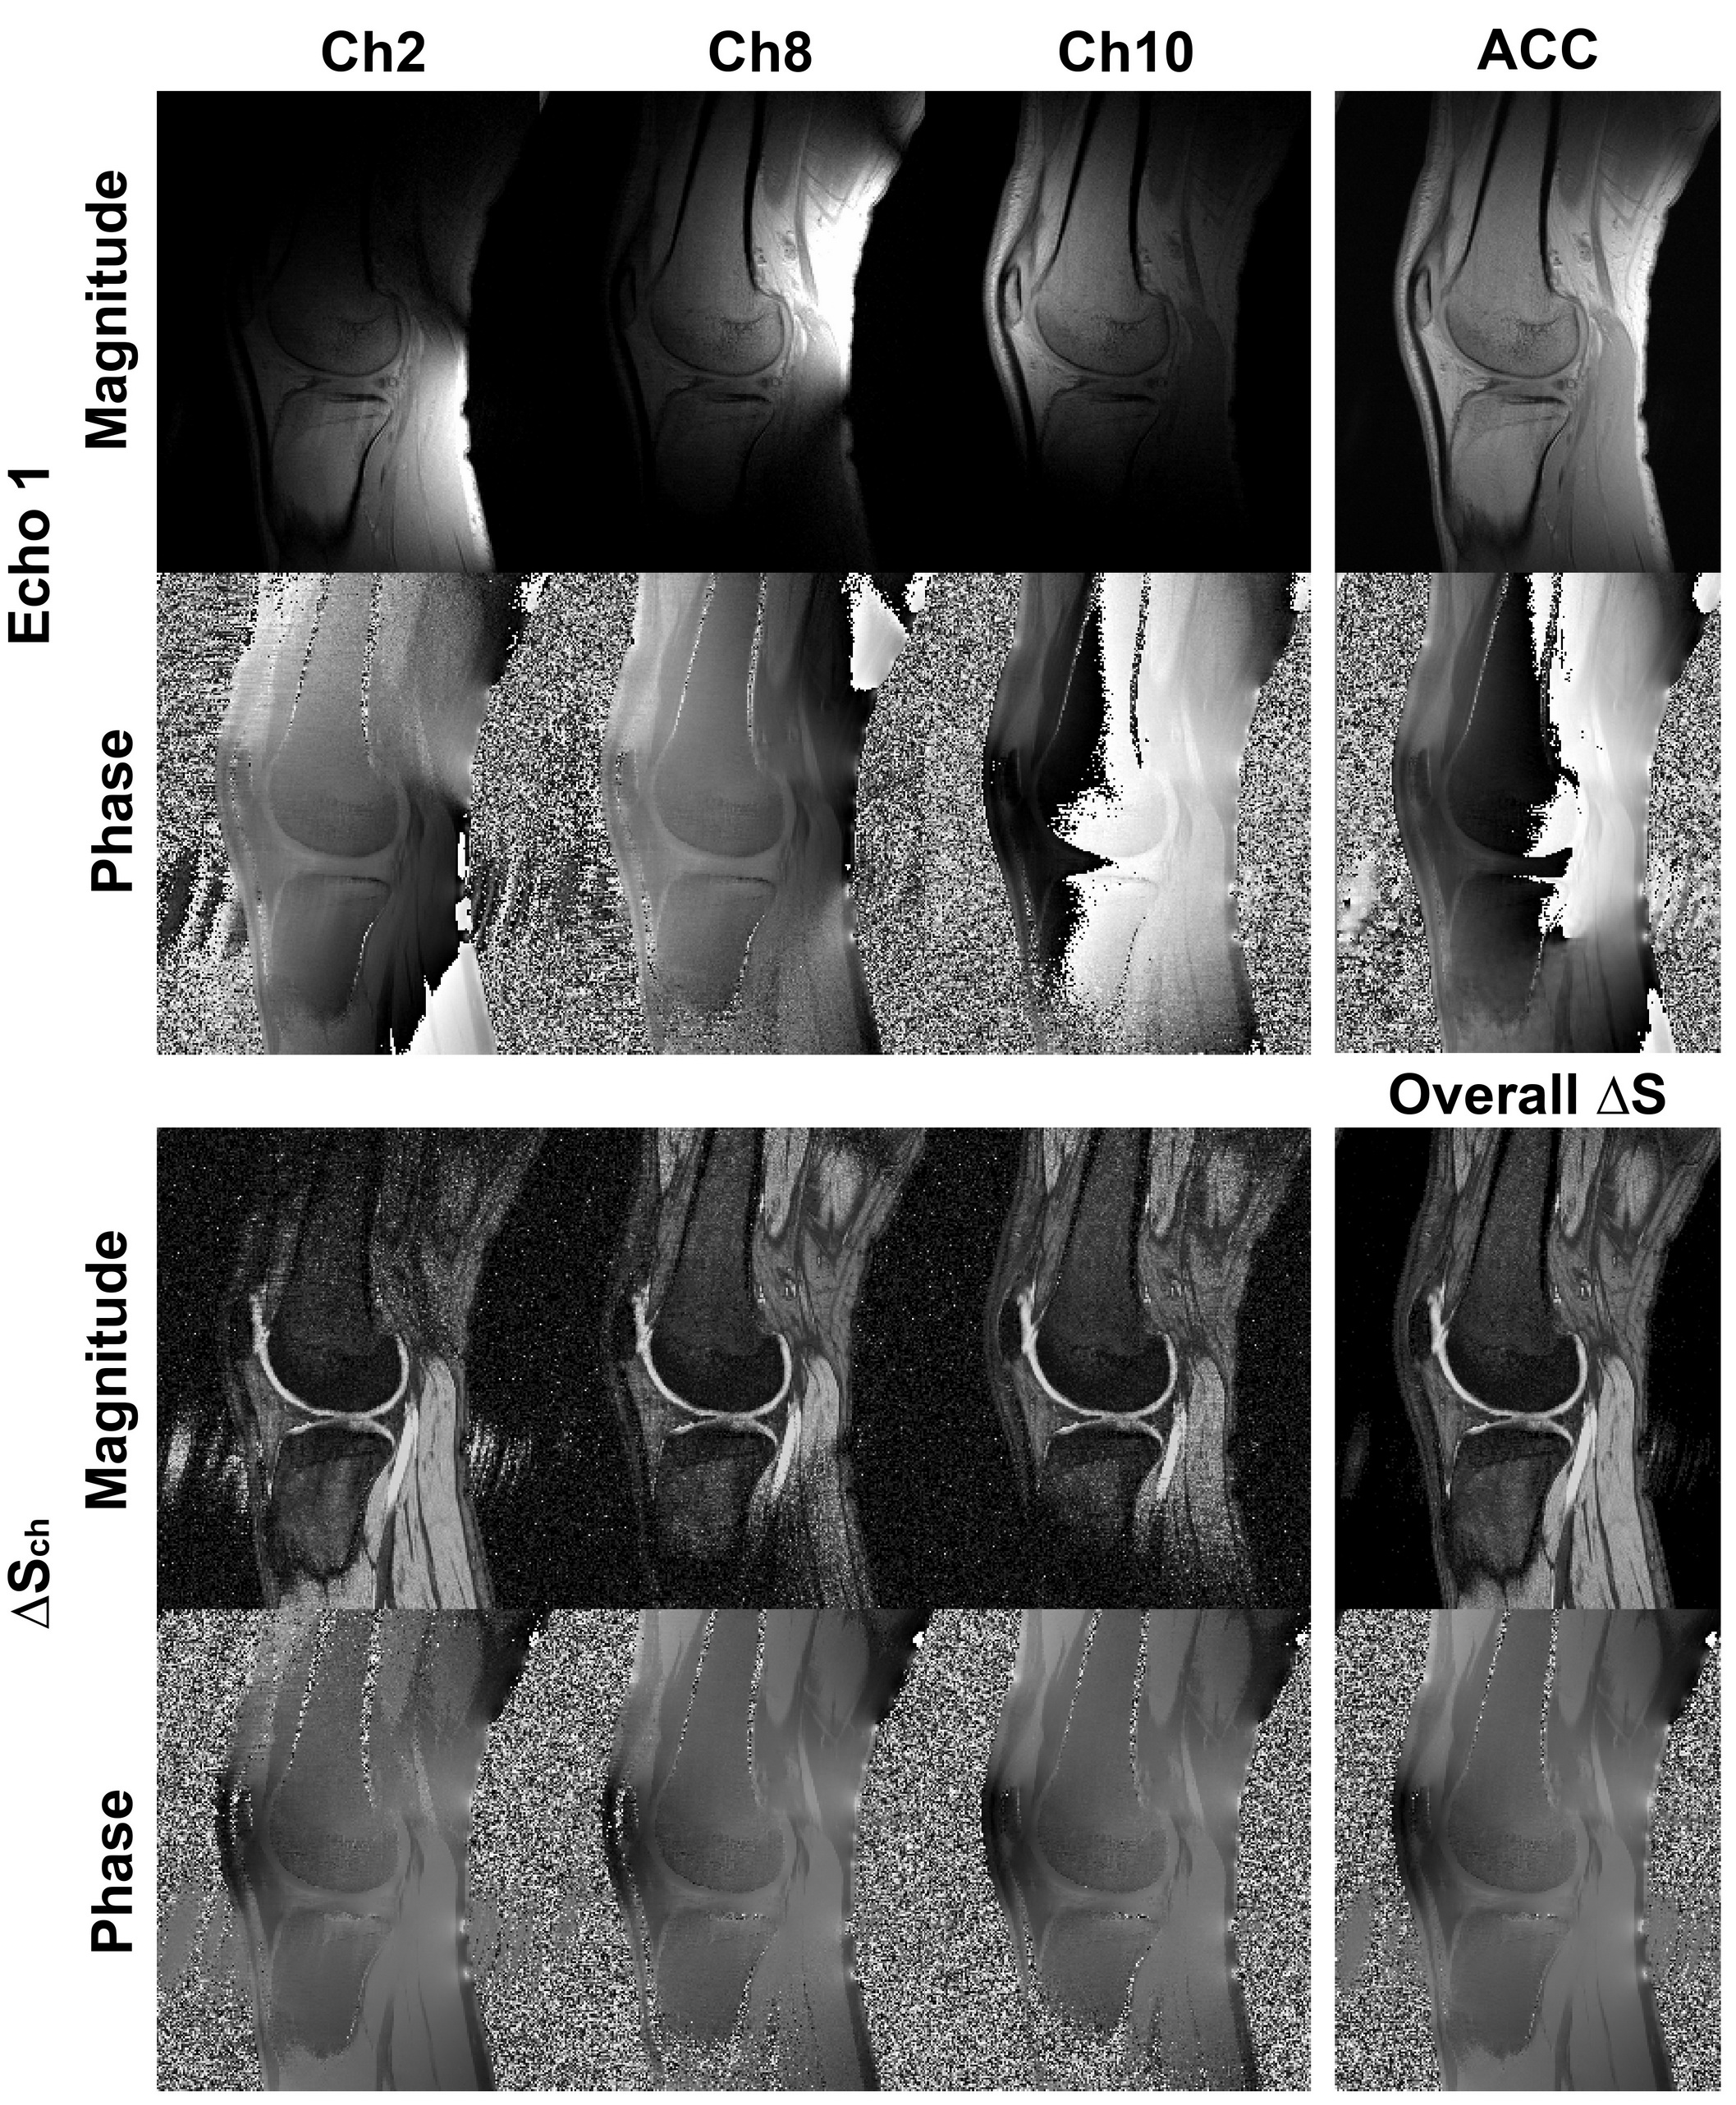
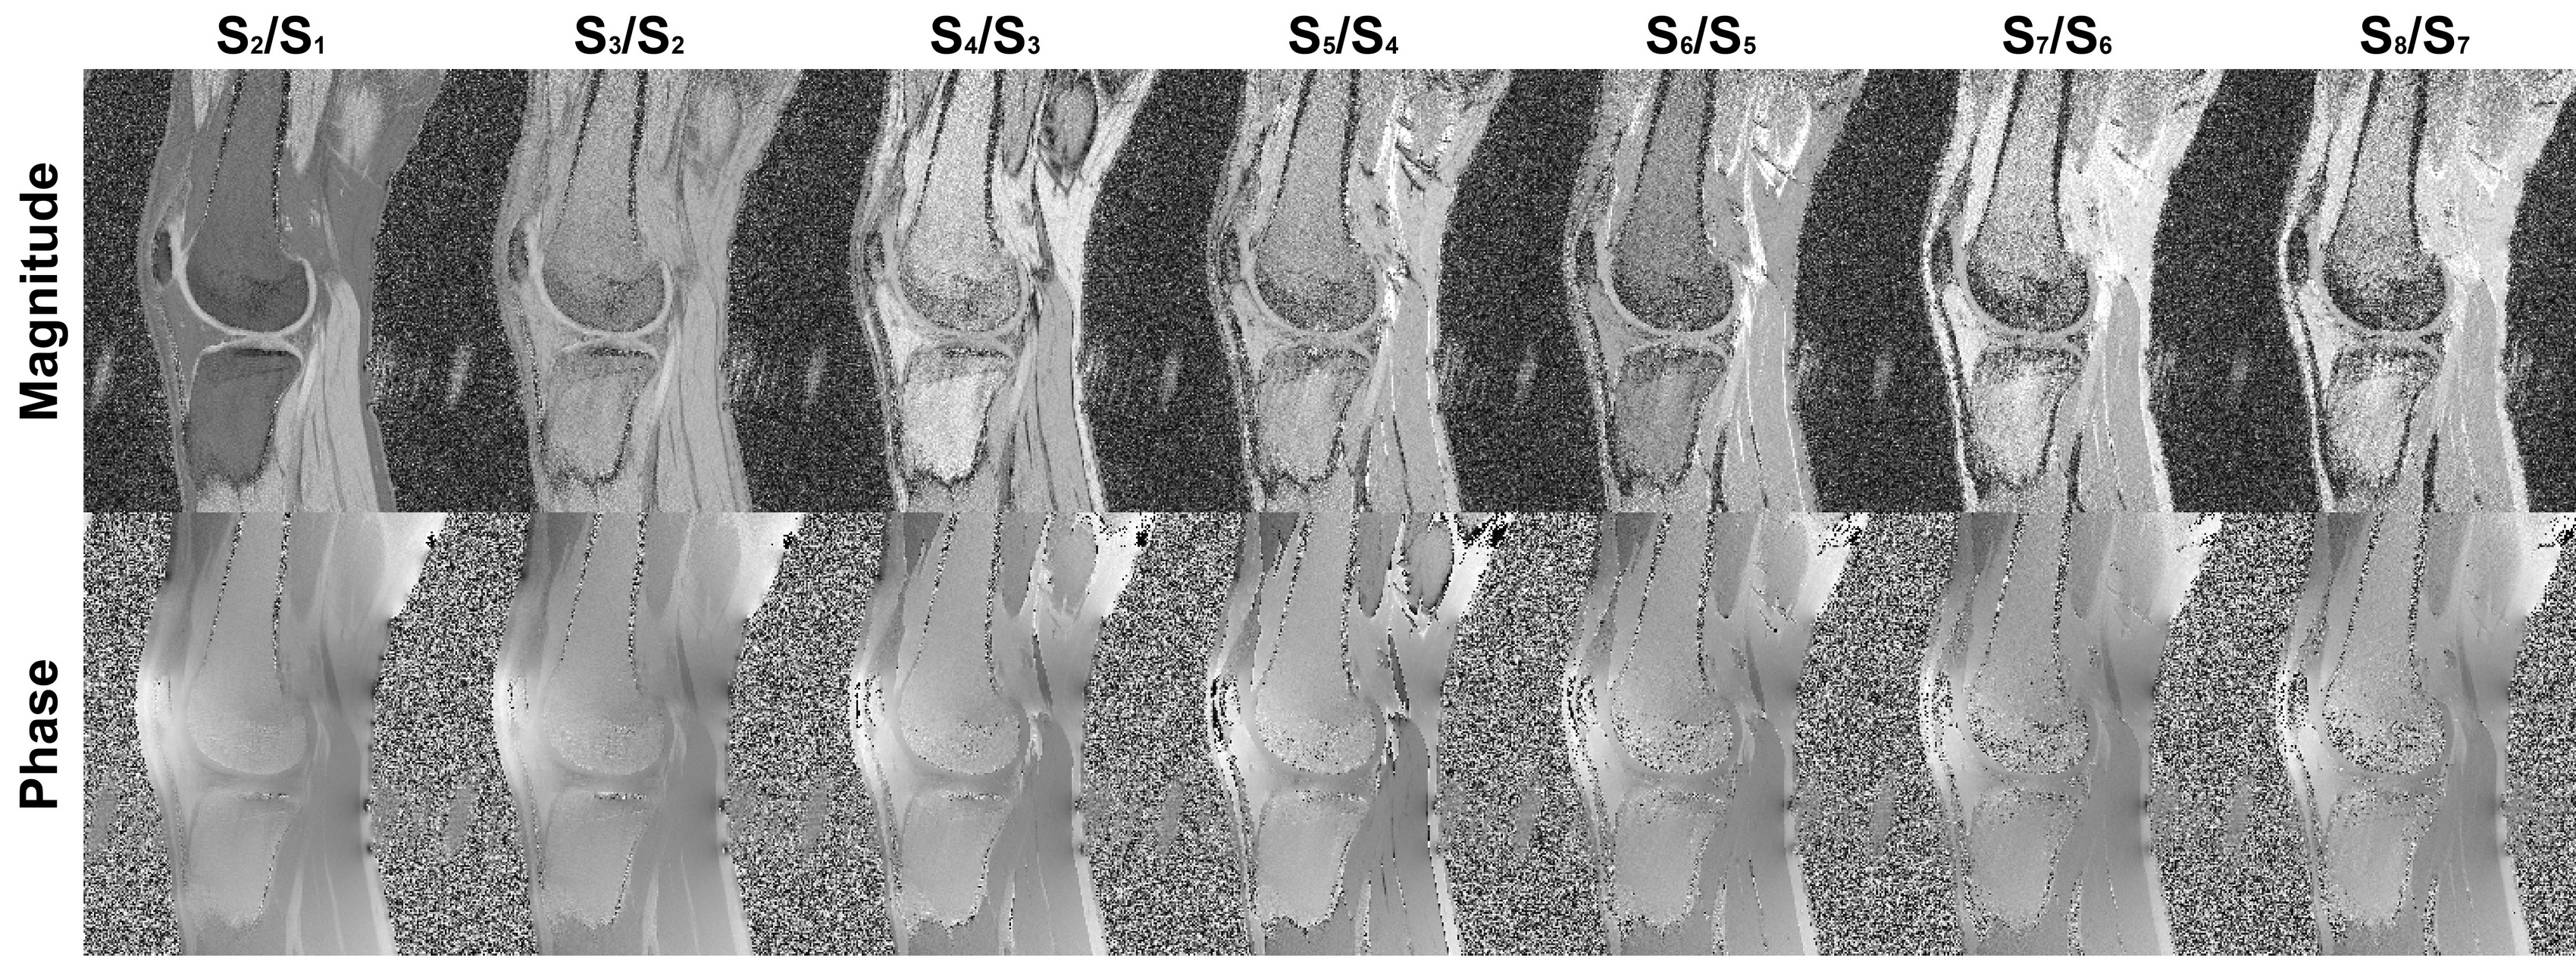
Fig.1 demonstrates the absence of coil sensitivity effects (in terms of signal intensity and field homogeneity) in the corresponding ΔSnc, by solving Eq.3 with for each nc. However, coil sensitivity related SNR variation are still present in individual ΔSnc. On the other hand, by solving Eq.3 for each ne, Fig.2 shows that the signal ratio over the channel dimension is spatially uniform in SNR, albeit SNR decreases temporally, which is expected due to the low signal of later echoes. Therefore by solving Eq.3 simultaneously along both dimensions, spatial and temporal SNR variation will be eliminated.
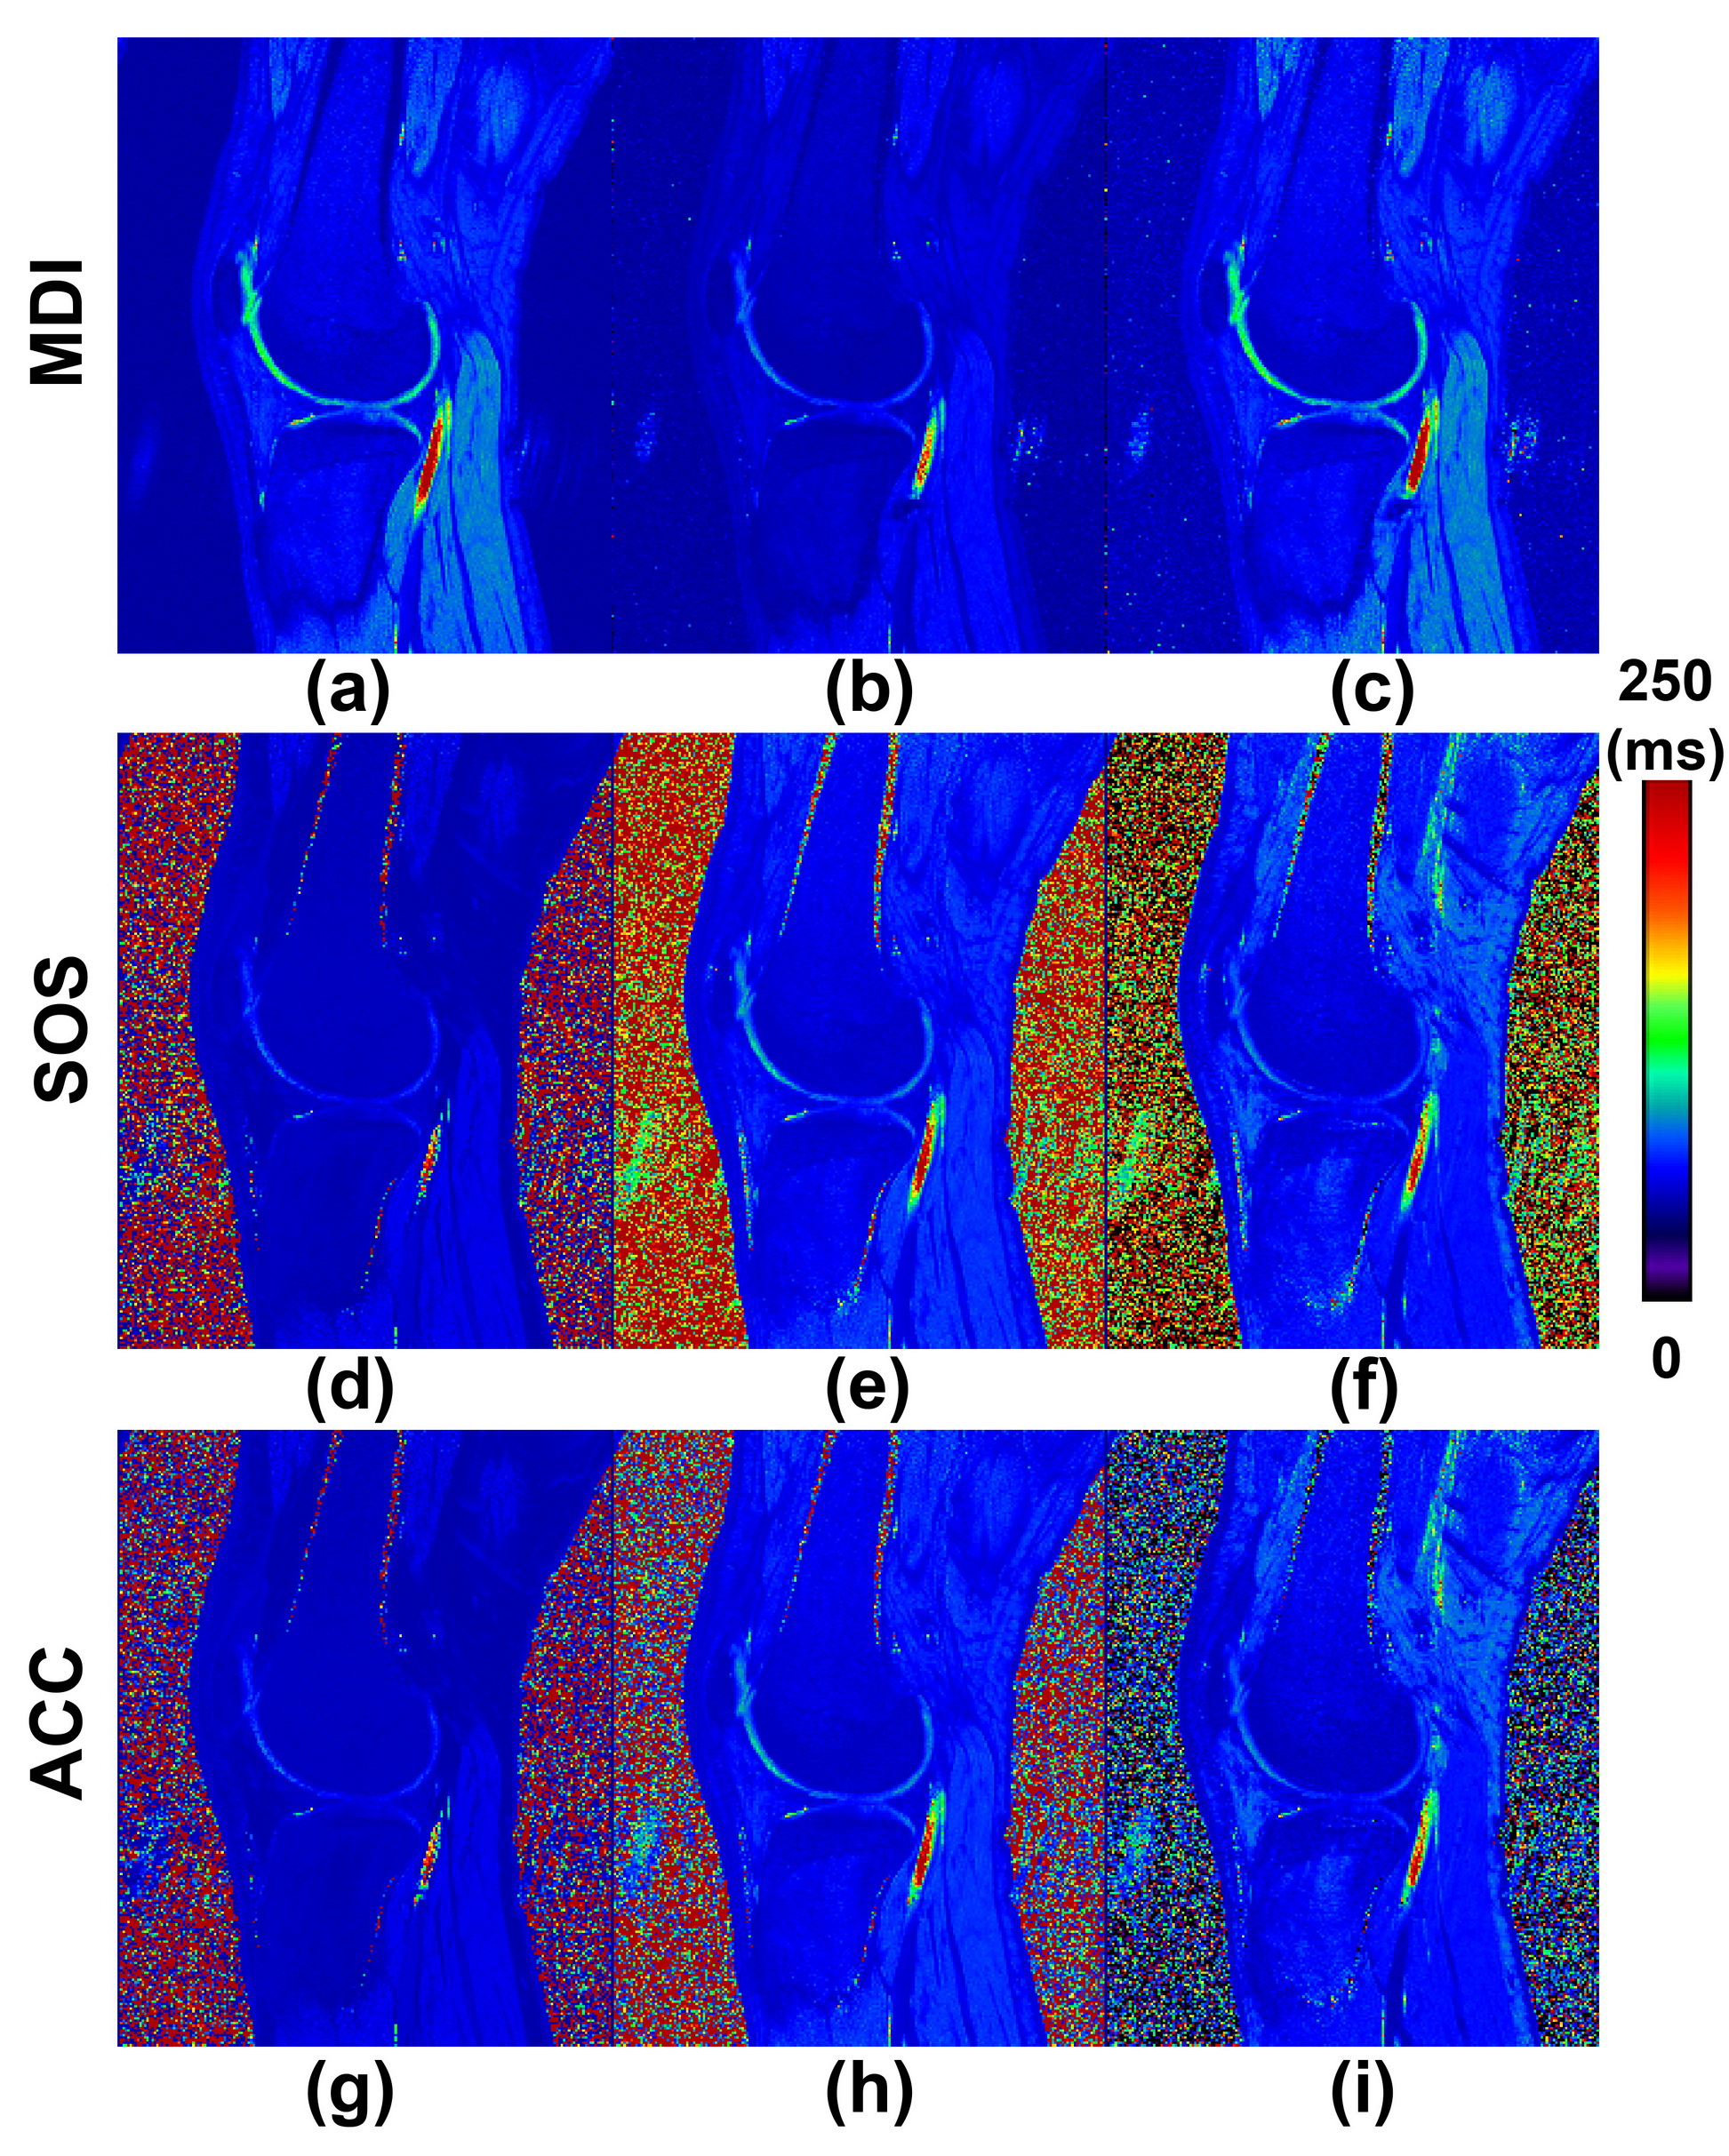
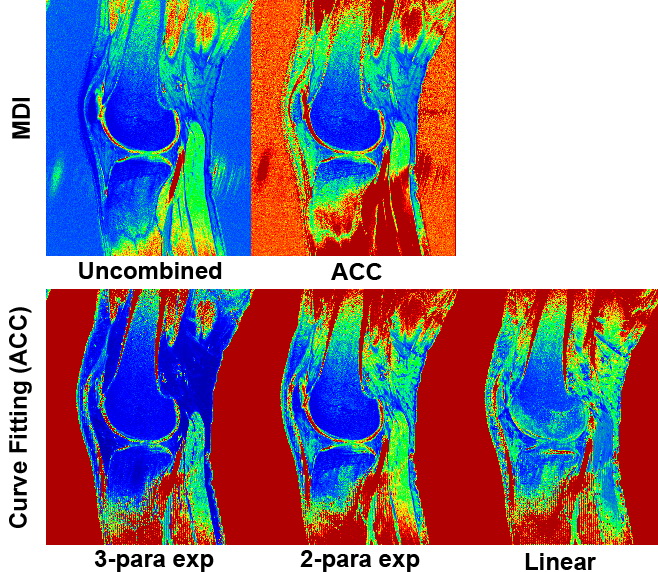
Fig.3 compares T2* maps calculated using MDI vs. curve fitting. The calculation time of MDI on this data set was only a few seconds. Fig.4 shows the noise propagation of the compared methods.
Discussion & Conclusion
We have developed and demonstrated a novel strategy, namely MDI, for MR parametric mapping (e.g. T2*). Instead of curve fitting, MDI solves the least square problem for extracting an overall complex signal ratio, simultaneously integrating both dimensions of echoes and channels. The resultant T2* map has minimal coil sensitivity effects and optimally controlled noise propagation, and thus optimal SNR. No explicit multi-channel combination operation is required, and the calculation speed is extremely fast. Although multi-channel combination methods like SOS and ACC can provide optimal SNR for individual echo magnitude images, it does not necessarily lead to optimal SNR in calculated parametric maps. As demonstrated in Figs.3&4, MDI using uncombined data offers significantly better SNR than curve fitting. Further comparison of computational noise propagation confirmed this (Fig.4), indicating that MDI using uncombined channel data yields significantly less noise propagation than any curve fitting methods. Several issues should be noted. Firstly echo spacing must be kept the same for all echoes. For bipolar readout, the signal ratio should be taken with echoes nech and nech+2. MDI in current form is designed for single exponential component model, and for future study we will improve Eq.3 to accommodate the two-component model for separated water/fat T2* mapping. Also optimization between the choice of echo numbers and echo spacing should be further tested to yield best results. In principle, MDI can also be used for T2 mapping with multi-echo SE data.Acknowledgements
No acknowledgement found.References
1. Bidhult, S., C. G. Xanthis, L. L. Liljekvist, G. Greil, E. Nagel, A. H. Aletras, E. Heiberg and E. Hedstrom. Validation of a new T2* algorithm and its uncertainty value for cardiac and liver iron load determination from MRI magnitude images. Magn Reson Med, 2016; 75(4): 1717-1729.
2. Walsh, D. O., A. F. Gmitro and M. W. Marcellin. Adaptive reconstruction of phased array MR imagery. Magn Reson Med, 2000; 43(5): 682-690.
Figures