4391
Model Based Analysis of Complex Difference Images for Measuring Diameters and Velocities of Penetrating Arteries1Department of Radiology and BRIC, Univeristy of North Carolina at Chapel Hill, Chapel Hill, NC, United States
Synopsis
Pathological changes of penetrating arteries (PAs) may be an important contributing factor of cerebral small vessel disease (SVD). Measurement of PA flow velocity and diameter with phase contrast (PC) MRI remains challenging due to the presence of strong partial volume effects. Here we propose model-based analysis of complex difference (MBAC) images to quantify diameter and velocity of PAs. We demonstrated the accuracy of the MBAC method with simulation and phantom studies. In vivo PA diameter and velocity were obtained for the first time. The MBAC method may serve as a useful tool for understanding the etiopathogenesis of SVD.
INTRODUCTION
Pathological changes of penetrating arteries (PAs) may be an important contributing factor of cerebral small vessel disease (SVD).1 Measurement of PA flow velocity and diameter with phase contrast (PC) MRI remains challenging due to the presence of strong partial volume effects (PVE). Although model based analysis of phase images (MBAP) has been proposed to correct PVE,2 the calculation of model images requires proper modelling of the surrounding tissues, which is hard to achieve for PAs due to the presence of multiple tissue types such as perivascular spaces and white matter. Furthermore, the method fails when the vessel diameter is less than the acquired voxel size, making it unsuitable for PAs. Here we propose model-based analysis of complex difference (MBAC) images to quantify diameter and velocity of PA. Complex difference (CD) removes the static tissue signal, thus avoiding the need for proper static tissues modelling. Furthermore, MBAC utilizes both magnitude and phase information, reducing its sensitivity to noise.METHODS
Assuming vessel perpendicular to the imaging slice, the image from PC-MRI is given by:
I(x,y)=[St+S0·e(v)·exp(iπv/VENC)]*sinc(kx,maxx)*sinc(ky,maxy), (1)
where * denotes convolution, kx,max and ky,max are the largest measured k-space coordinates, St and S0 are the surrounding tissue signal and blood signal without flow effect, respectively, e(v) is flow-induce signal enhancement factor. The velocity spatial distribution is expected to follow a laminar pattern in PAs.3 S0 can be inferred from the signal of nearby WM after correcting for T2*, T1, and water content differences. In order to apply MBAC, two images are acquired with the velocity encoding gradient on and off (VENC=∞), respectively. Model CD and phase contrast images are calculated based on Eq. (1), where e(v) can be obtained via Bloch simulation. The model images are fitted to measured CD and PC images to extract mean velocity (vmean) and diameter.
MBAC were performed on simulated, phantom, and in vivo images to systematically evaluate its performances. Simulated images were obtain by adding Gaussian white noise to images calculated from equation (1). The noise level and model parameters matched with in vivo condition. Phantom and in vivo images were acquired on a Siemens 7T human MRI scanner with a single slice PC MRI sequence. The phantom consisted of a water-filled polyimide tube with ID/OD = 0.165/0.305 mm penetrating a water-filled plastic cylinder. The flow rate was controlled by a syringe pump to achieve desired vmean. In vivo images were acquired for quantifying PA diameter and velocity in centrum semiovale in 6 healthy volunteers aged 21–41, with approval by the IRB. The sequence parameters were: VENC=4 cm/s; resolution=0.3125×0.3125×2 mm3; TE/TR=15.7/30 ms; NA=15; FA=45o. Images were interpolated to 0.1563×0.1563 mm2 voxel size by zero filling in k-space. The PA orientations were calculated from that of overlapping PVS visualized with a 3D T2-weighted sequence.4
RESULTS
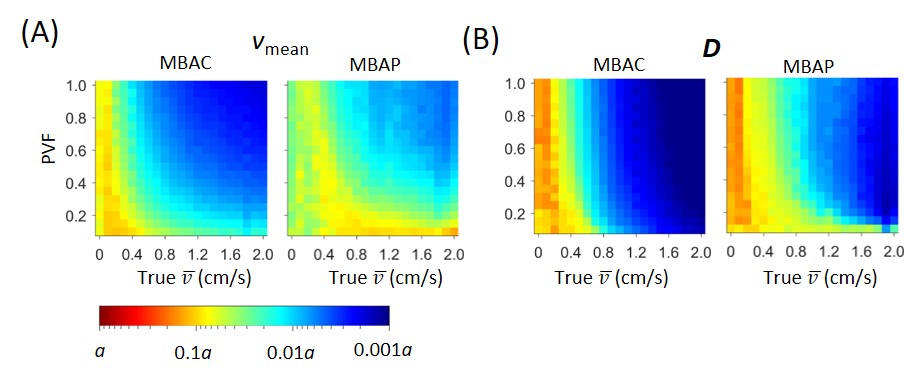
Figure 1 compares noise-related errors of fitted vmean and diameter for MBAC and MBAP at different vmean and partial volume fraction (PVF). PVF is calculated relative to the volume of a single voxel. The standard deviation (SD) increases with decreasing vmean and PVF. The SDs for MBAC are generally much smaller than MBAP at same vmean and PVF.
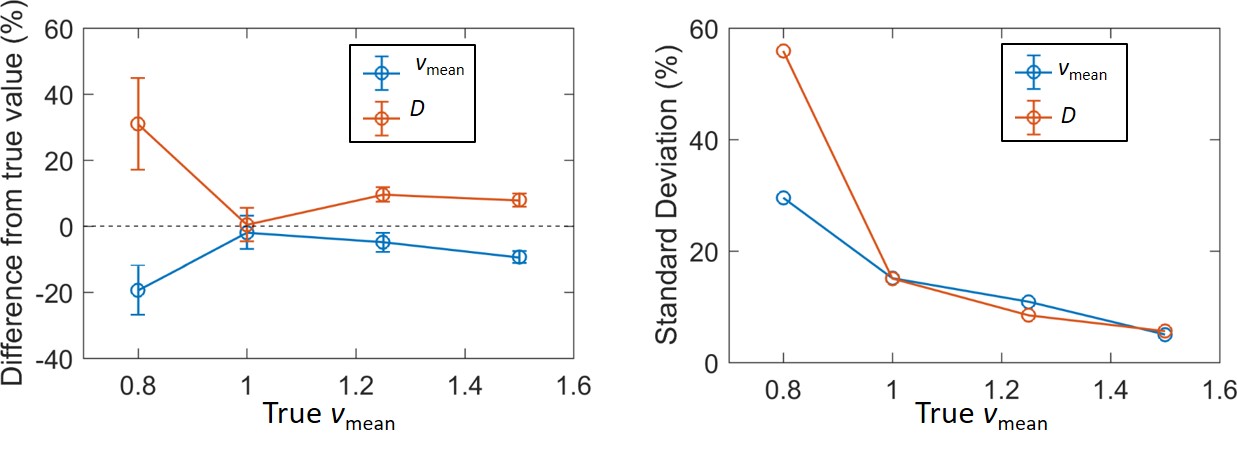
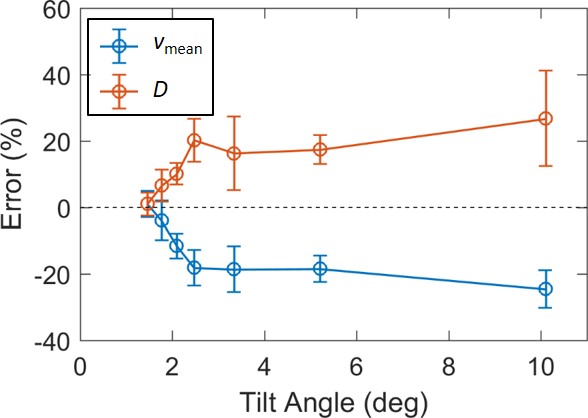
The differences between mean fitted and true vmean and D results are shown in Fig. 2(A), showing <10% error when true vmean ≥ 1 cm/s and increased error at lower velocity of 0.8 cm/s. The SDs of fitted vmean and D increases monotonically with decreasing velocity, as shown in Fig. 2(B). The tilt of vessel from being perpendicular has a strong effect on the accuracy, as shown in Fig. 3. The errors increase linearly with tilt angle until reaching a plateau between 2.5o-5.2o.
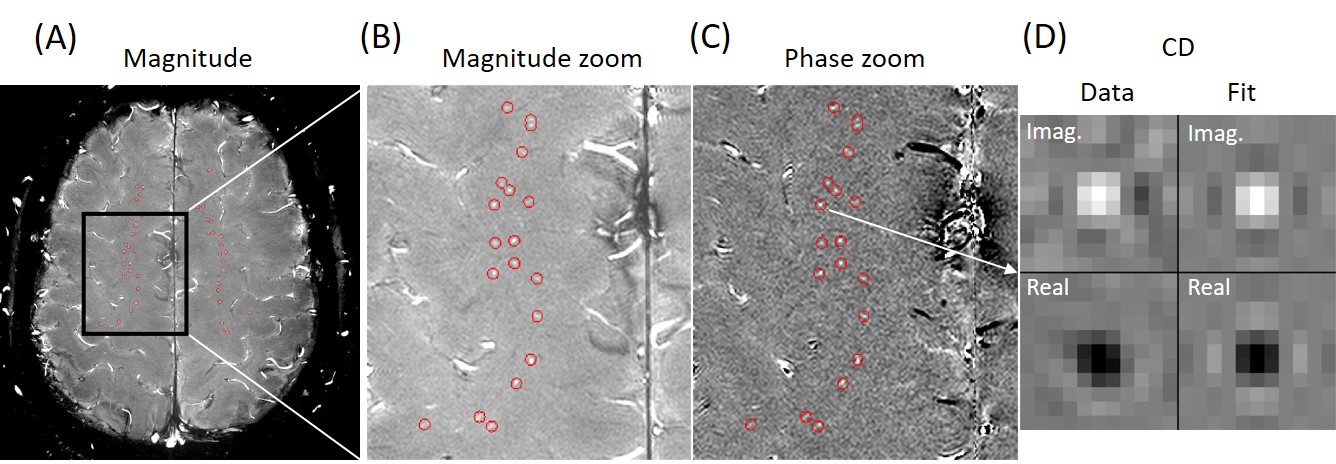
Totally 234 PAs were visualized in vivo in the 6 subjects, among which 17 were approximately perpendicular to the slice (tilt<5°). An example of the visualized PAs and fitted model images are shown in Fig. 4. The mean (SD) vmean and D of the 17 PAs are 1.08 (0.39) cm/s, and 0.17 (0.05) mm, respectively.
DISCUSSION
Our simulation
study demonstrate that MBAC has reduced sensitivity to noise compared to MBAP. For our flow phantom with PVF of only 22%, accurate
diameter and velocity measurements were achieved with MBAC when vmean>1 cm/s and slice is perpendicular
to vessel. Non-invasive measurement of PA diameters and velocity
were achieved in healthy volunteers for the first time. The measured diameters are in good agreement
with those obtained from ex-vivo study.5 CONCLUSIONS
The partial volume effects can be corrected for measuring PA diameter and velocity with MBAC. The method may serve as a useful tool for understanding the etiopathogenesis of SVD.Acknowledgements
This study was supported by NIH grant 5R21NS095027-02.References
1. Fisher CM. The arterial lesions underlying lacunes. Acta neuropathologica. 1968;12:1-15
2. Hoogeveen RM, Bakker CJ, Viergever MA. Mr phase-contrast flow measurement with limited spatial resolution in small vessels: Value of model-based image analysis. Magn Reson Med. 1999;41:520-528
3. Avila K, Moxey D, de Lozar A, Avila M, Barkley D, Hof B. The onset of turbulence in pipe flow. Science. 2011;333:192-196
4. Zong X, Park SH, Shen D, Lin W. Visualization of perivascular spaces in the human brain at 7t: Sequence optimization and morphology characterization. Neuroimage. 2016;125:895-902
5. Pesce C, Carli F. Allometry of the perivascular spaces of the putamen in aging. Acta neuropathologica. 1988;76:292-294
Figures