4386
Confounding Factors in Breast Magnetic Resonance Fingerprinting: B1+, Slice Profile and Diffusion Effects1Philips Research Europe, Eindhoven, Netherlands, 2Physics of Molecular Imaging Systems, RWTH Aachen University, Aachen, Germany, 3Philips Research Europe, Hamburg, Germany
Synopsis
In this study, we evaluate the effect of three potentially confounding factors (B1+ inhomogeneity, slice profile, diffusion) on the outcome of 2D Magnetic Resonance Fingerprinting measurements in the female breast for six healthy volunteers. Each of these factors was included into an MRF dictionary and matching results were compared to a reference dictionary that excluded the correction. For the given MRF sequence, both B1+ inhomogeneity and slice profile correction affected the quantitative relaxation times in the female breast, whereas this was not the case for diffusion.
Introduction
Magnetic resonance fingerprinting (MRF) extracts multiple quantitative parameters from a time series of undersampled images with varying acquisition parameters such as flip angles (FA) or repetition times1. Parametric maps result from matching the temporal signal evolution in each voxel to a dictionary of modelled signals. Hence, the accuracy of the results depends on the extent to which the model replicates the physical reality of the MRF sequence. For gradient spoiled MRF sequences, dictionary calculation involves Extended Phase Graph simulations2, which take into account radiofrequency (RF) excitations, relaxations and re-/dephasing of magnetization induced by spoiling gradients. However, phenomena like in-plane B1+ inhomogeneity, the RF slice profile, i.e., flip angle distribution along the slice direction3,4, and diffusion caused by unbalanced gradient moments5 can induce a bias in the matching results.
The purpose of this study is to evaluate in detail the effect of these potentially confounding factors on the outcome of 2D MRF measurements in the female breast. The measurements, examining quantitative T1 and T2 values of fibroglandular (FG) and fatty tissue, were previously realized in six healthy female volunteers at 1.5 T. In the breast, especially B1+ inhomogeneity is of importance as strong dielectric effects occur6. Diffusion is expected to affect mostly FG tissue (apparent diffusion coefficient of (1.95 ± 0.24) · 10-3 mm2/s at 1.5T7).
Methods
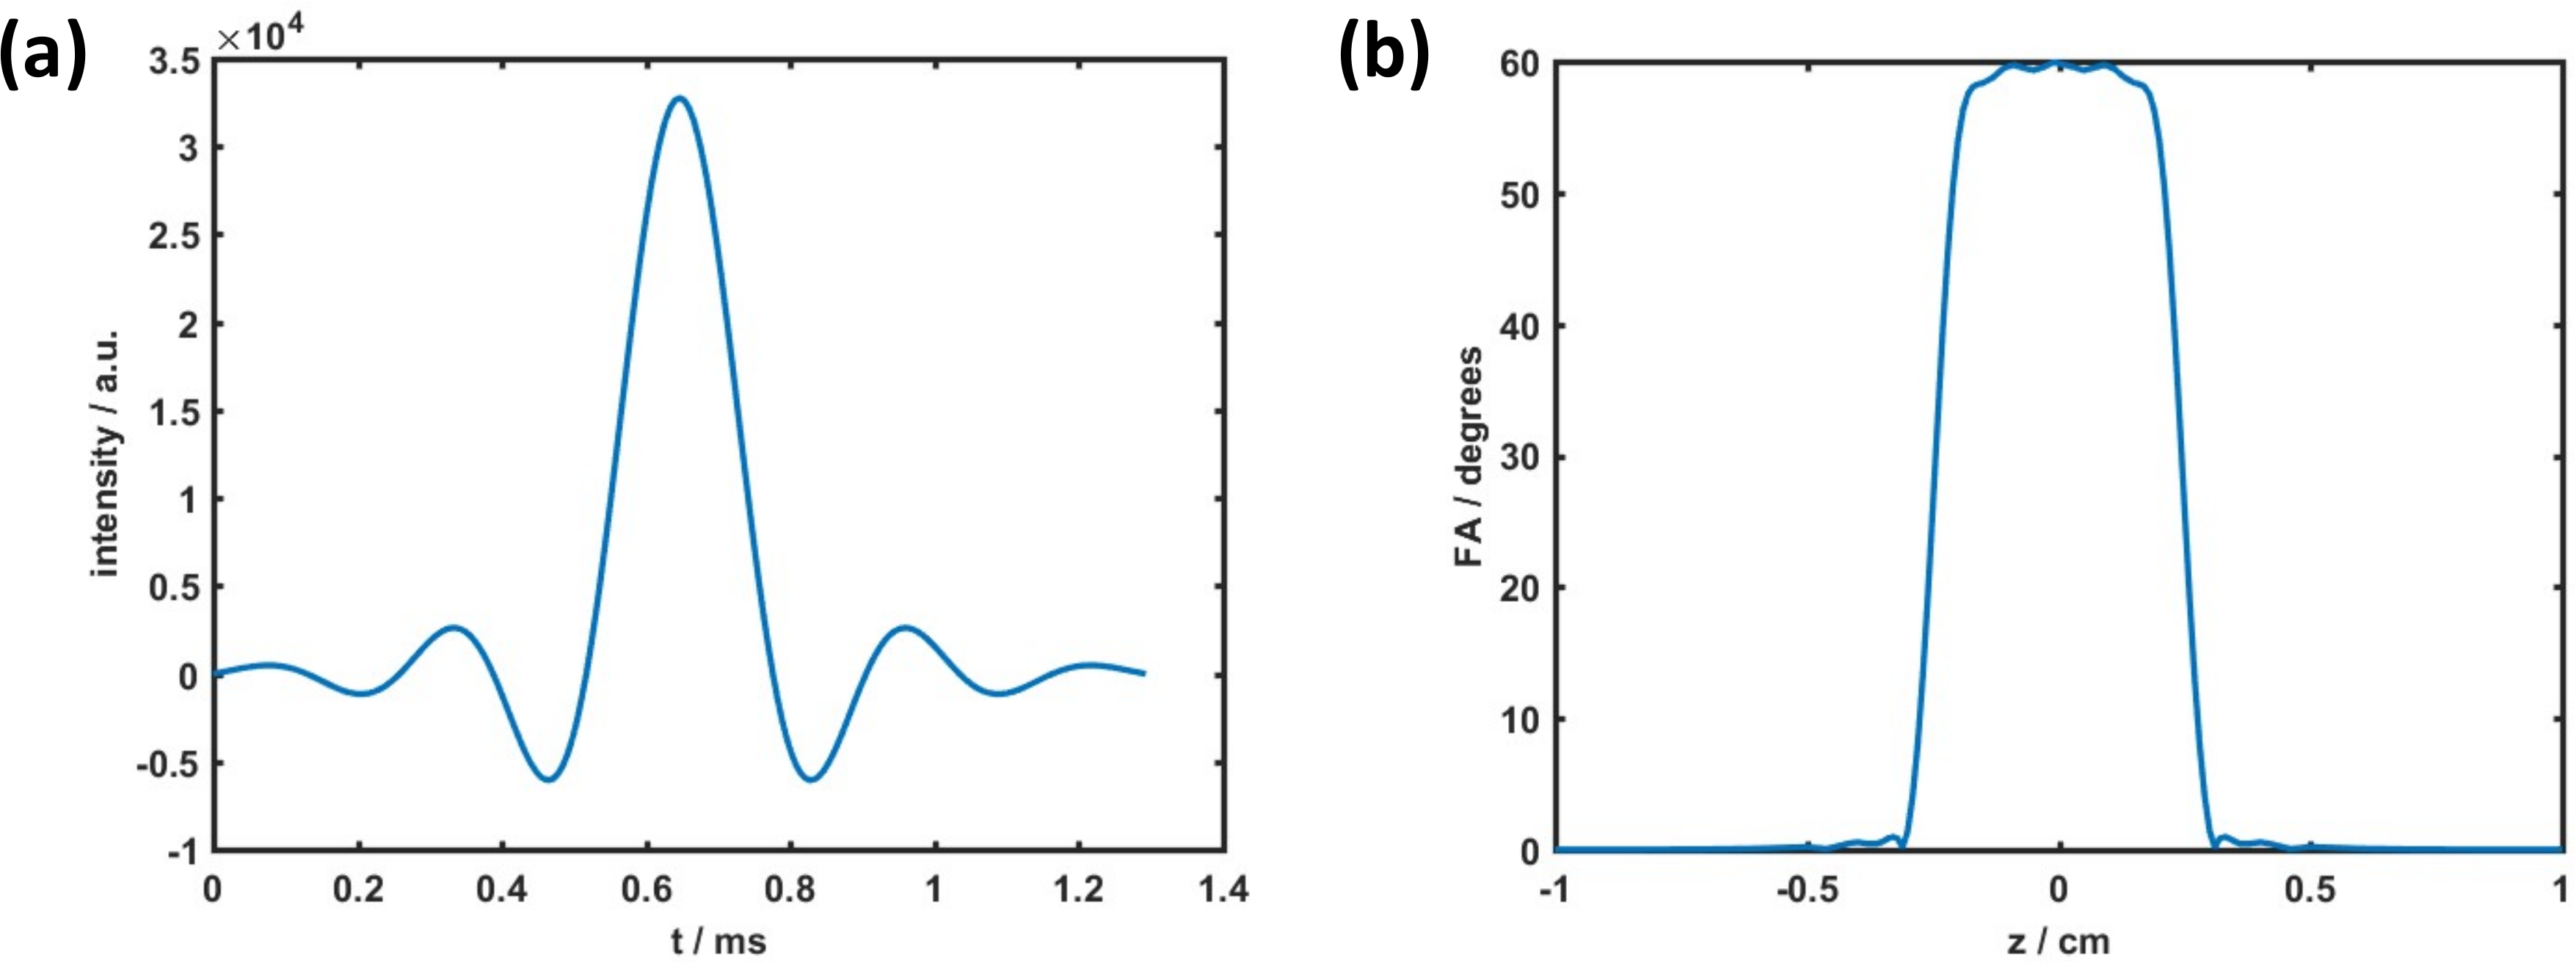
MRF measurements in axial geometry were acquired on a 1.5 T system (Philips Achieva, Best, The Netherlands) employing a spoiled GRE sequence, undersampled spiral readout (one rotating spiral interleave of 7ms acquisition time, 20-fold undersampling), a 430 mm quadratic FOV and 1.9×1.9×5 mm³ voxel size. Acquiring three MRF trains with echo times of (4.6/6.9/9.2) ms permitted water-fat separation and subsequent spiral deblurring8. Each MRF train consisted of 500 TR intervals of 20 ms length and employed Sommer’s flip angle pattern9, preceded by an adiabatic 180° inversion pulse. 4·2π gradient spoiling in slice direction was applied at the end of each TR interval. An RF pulse shape with a close-to-rectangular slice profile was utilized, cf. Figure 1. Additionally, a B1+ map was acquired using the actual flip angle technique10. A reference dictionary was calculated, excluding the above-mentioned effects. One additional dictionary per effect was calculated to subsequently compare the matching results to the reference results in masked areas of FG and fatty tissue. B1+ inhomogeneity was included into the dictionary as a factor fb1 preceding the flip angle train (fb1=0.7…1.3, Δfb1=0.025). For every voxel, matching was conducted on the subset of signal evolutions with fb1 being closest to the measured B1+ map. The slice profile (FA, phase) was calculated for each flip angle based on the Shinnar-Le-Roux algorithm11. MRF signals were integrated over the slice profile. Diffusion was included in the dictionary as an isotropic diffusion operator after each gradient spoiling event12,13. The spoiler gradient was approximated as rectangular (1.1 ms duration, 18.2 mT/m strength, 4·2π spoiling moment). In addition, signal evolutions were simulated for spoiling moments between 0 and 20·2π (gradient durations between 0 and 5.5 ms) for a test tissue (T1 = 1200 ms, T2=70 ms) and matched to the reference dictionary.Results and Discussion
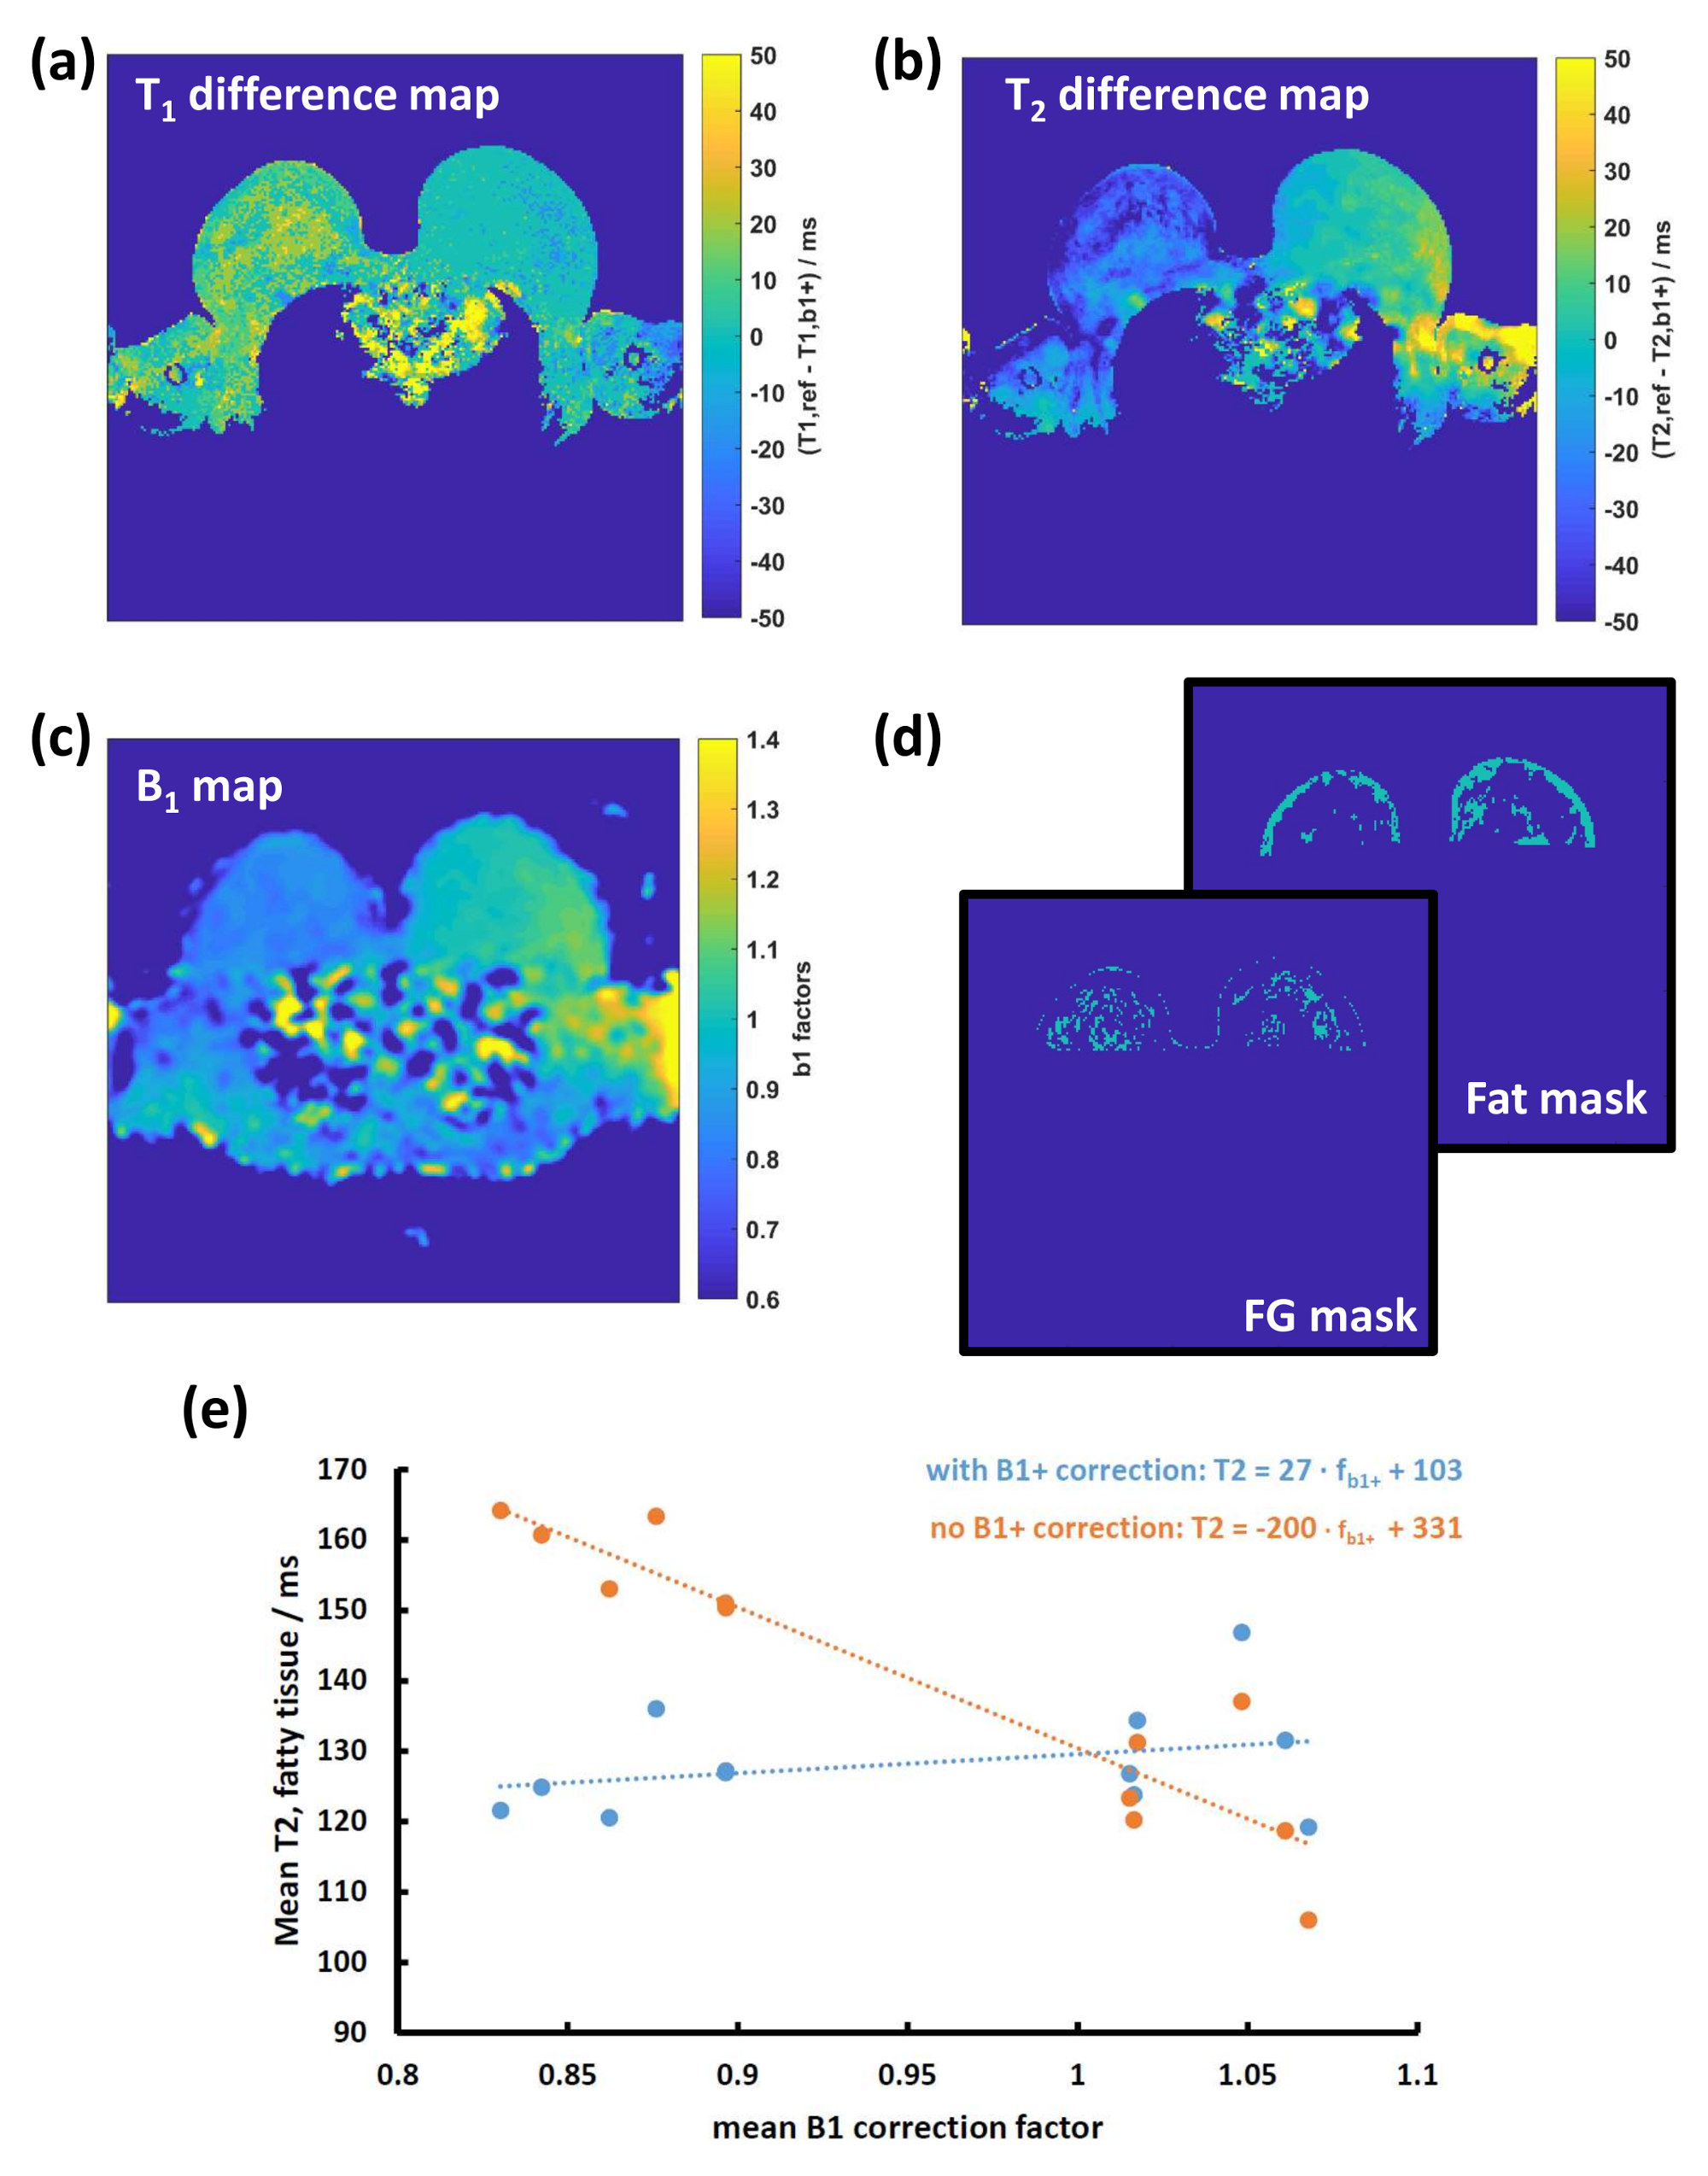
All B1+ maps show higher values in the left breast than in the right breast, reflected by a strong left-right difference in T2 and a slight difference in T1 prior to B1+ correction (cf. Figure 1(a)–(d)). For all volunteers, mean fat T2 values – expected to be homogeneous over the whole breast – were plotted against the corresponding mean B1+ values in the right and left breast, cf. Figure 1(e). For matching to the reference dictionary (orange data points), a strong left- right gradient is visible, which reduces to 15% of its original slope when including the B1+ correction (blue data points).
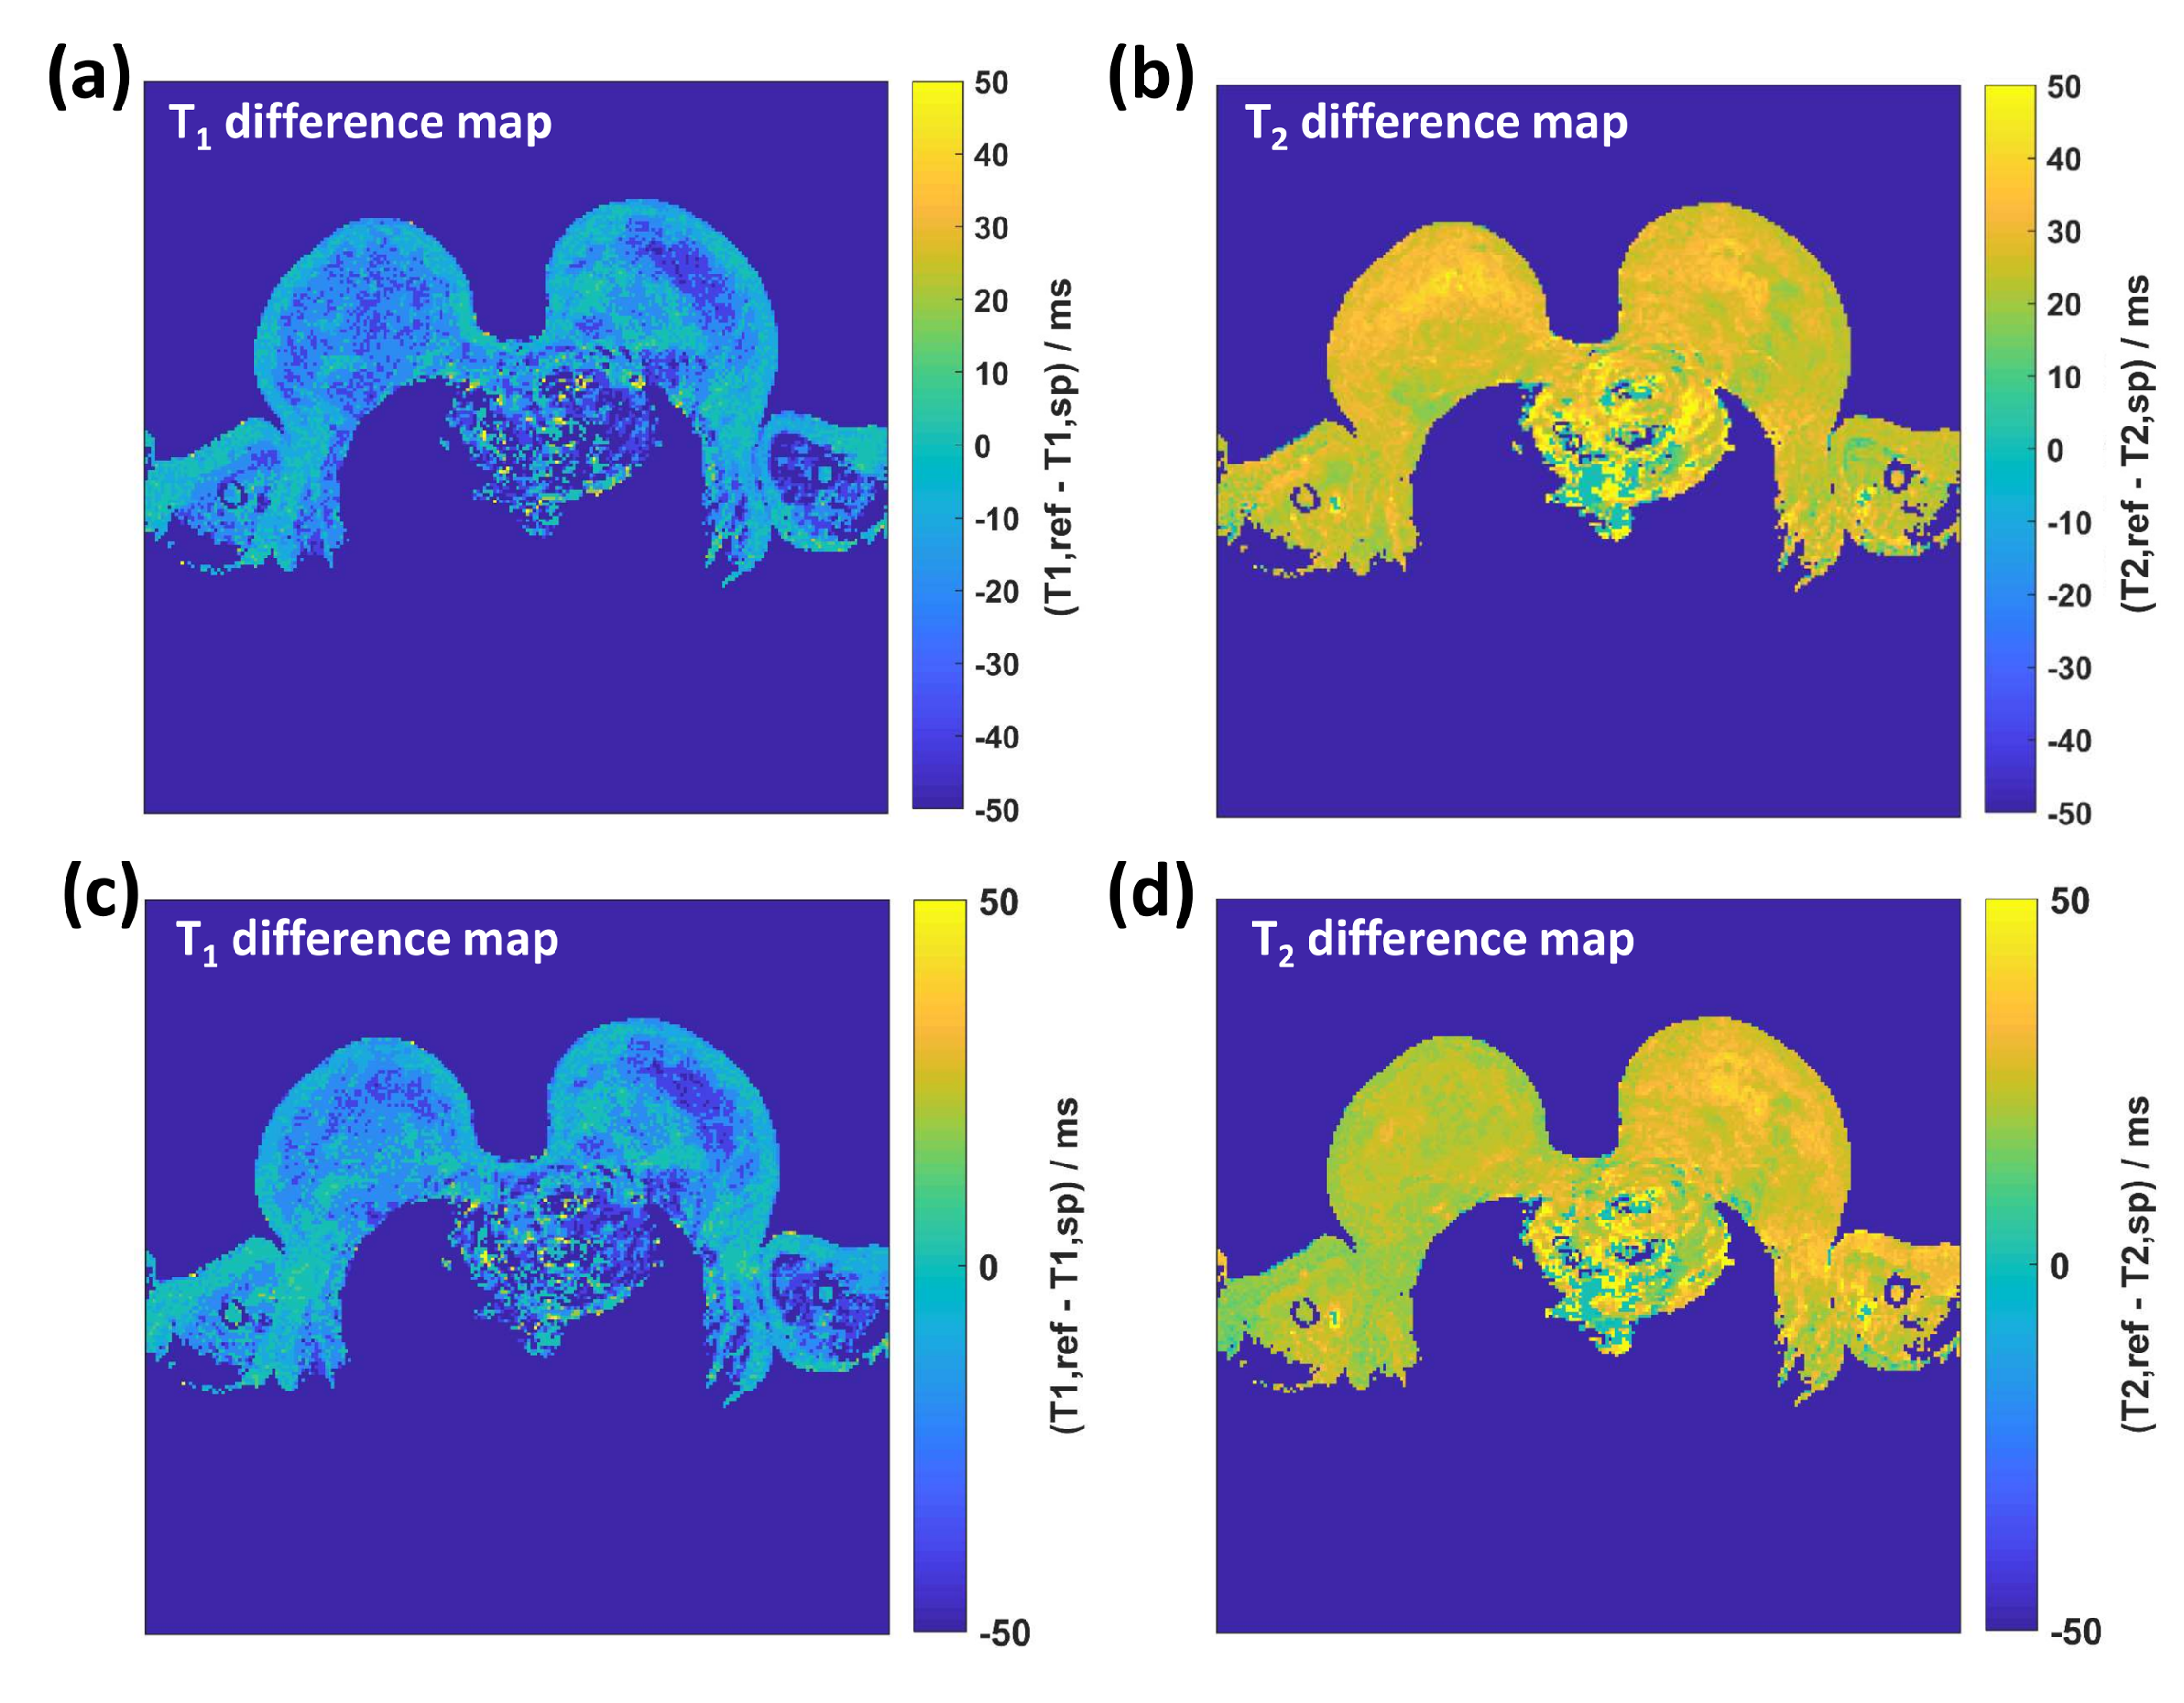
Matching including the slice profile resulted in decreased T2 and slightly increased T1 values in both FG and fatty tissue (cf. Figure 2). The changes in T2 are strong despite the relatively rectangular slice profile of the RF excitation pulses and need further verification.
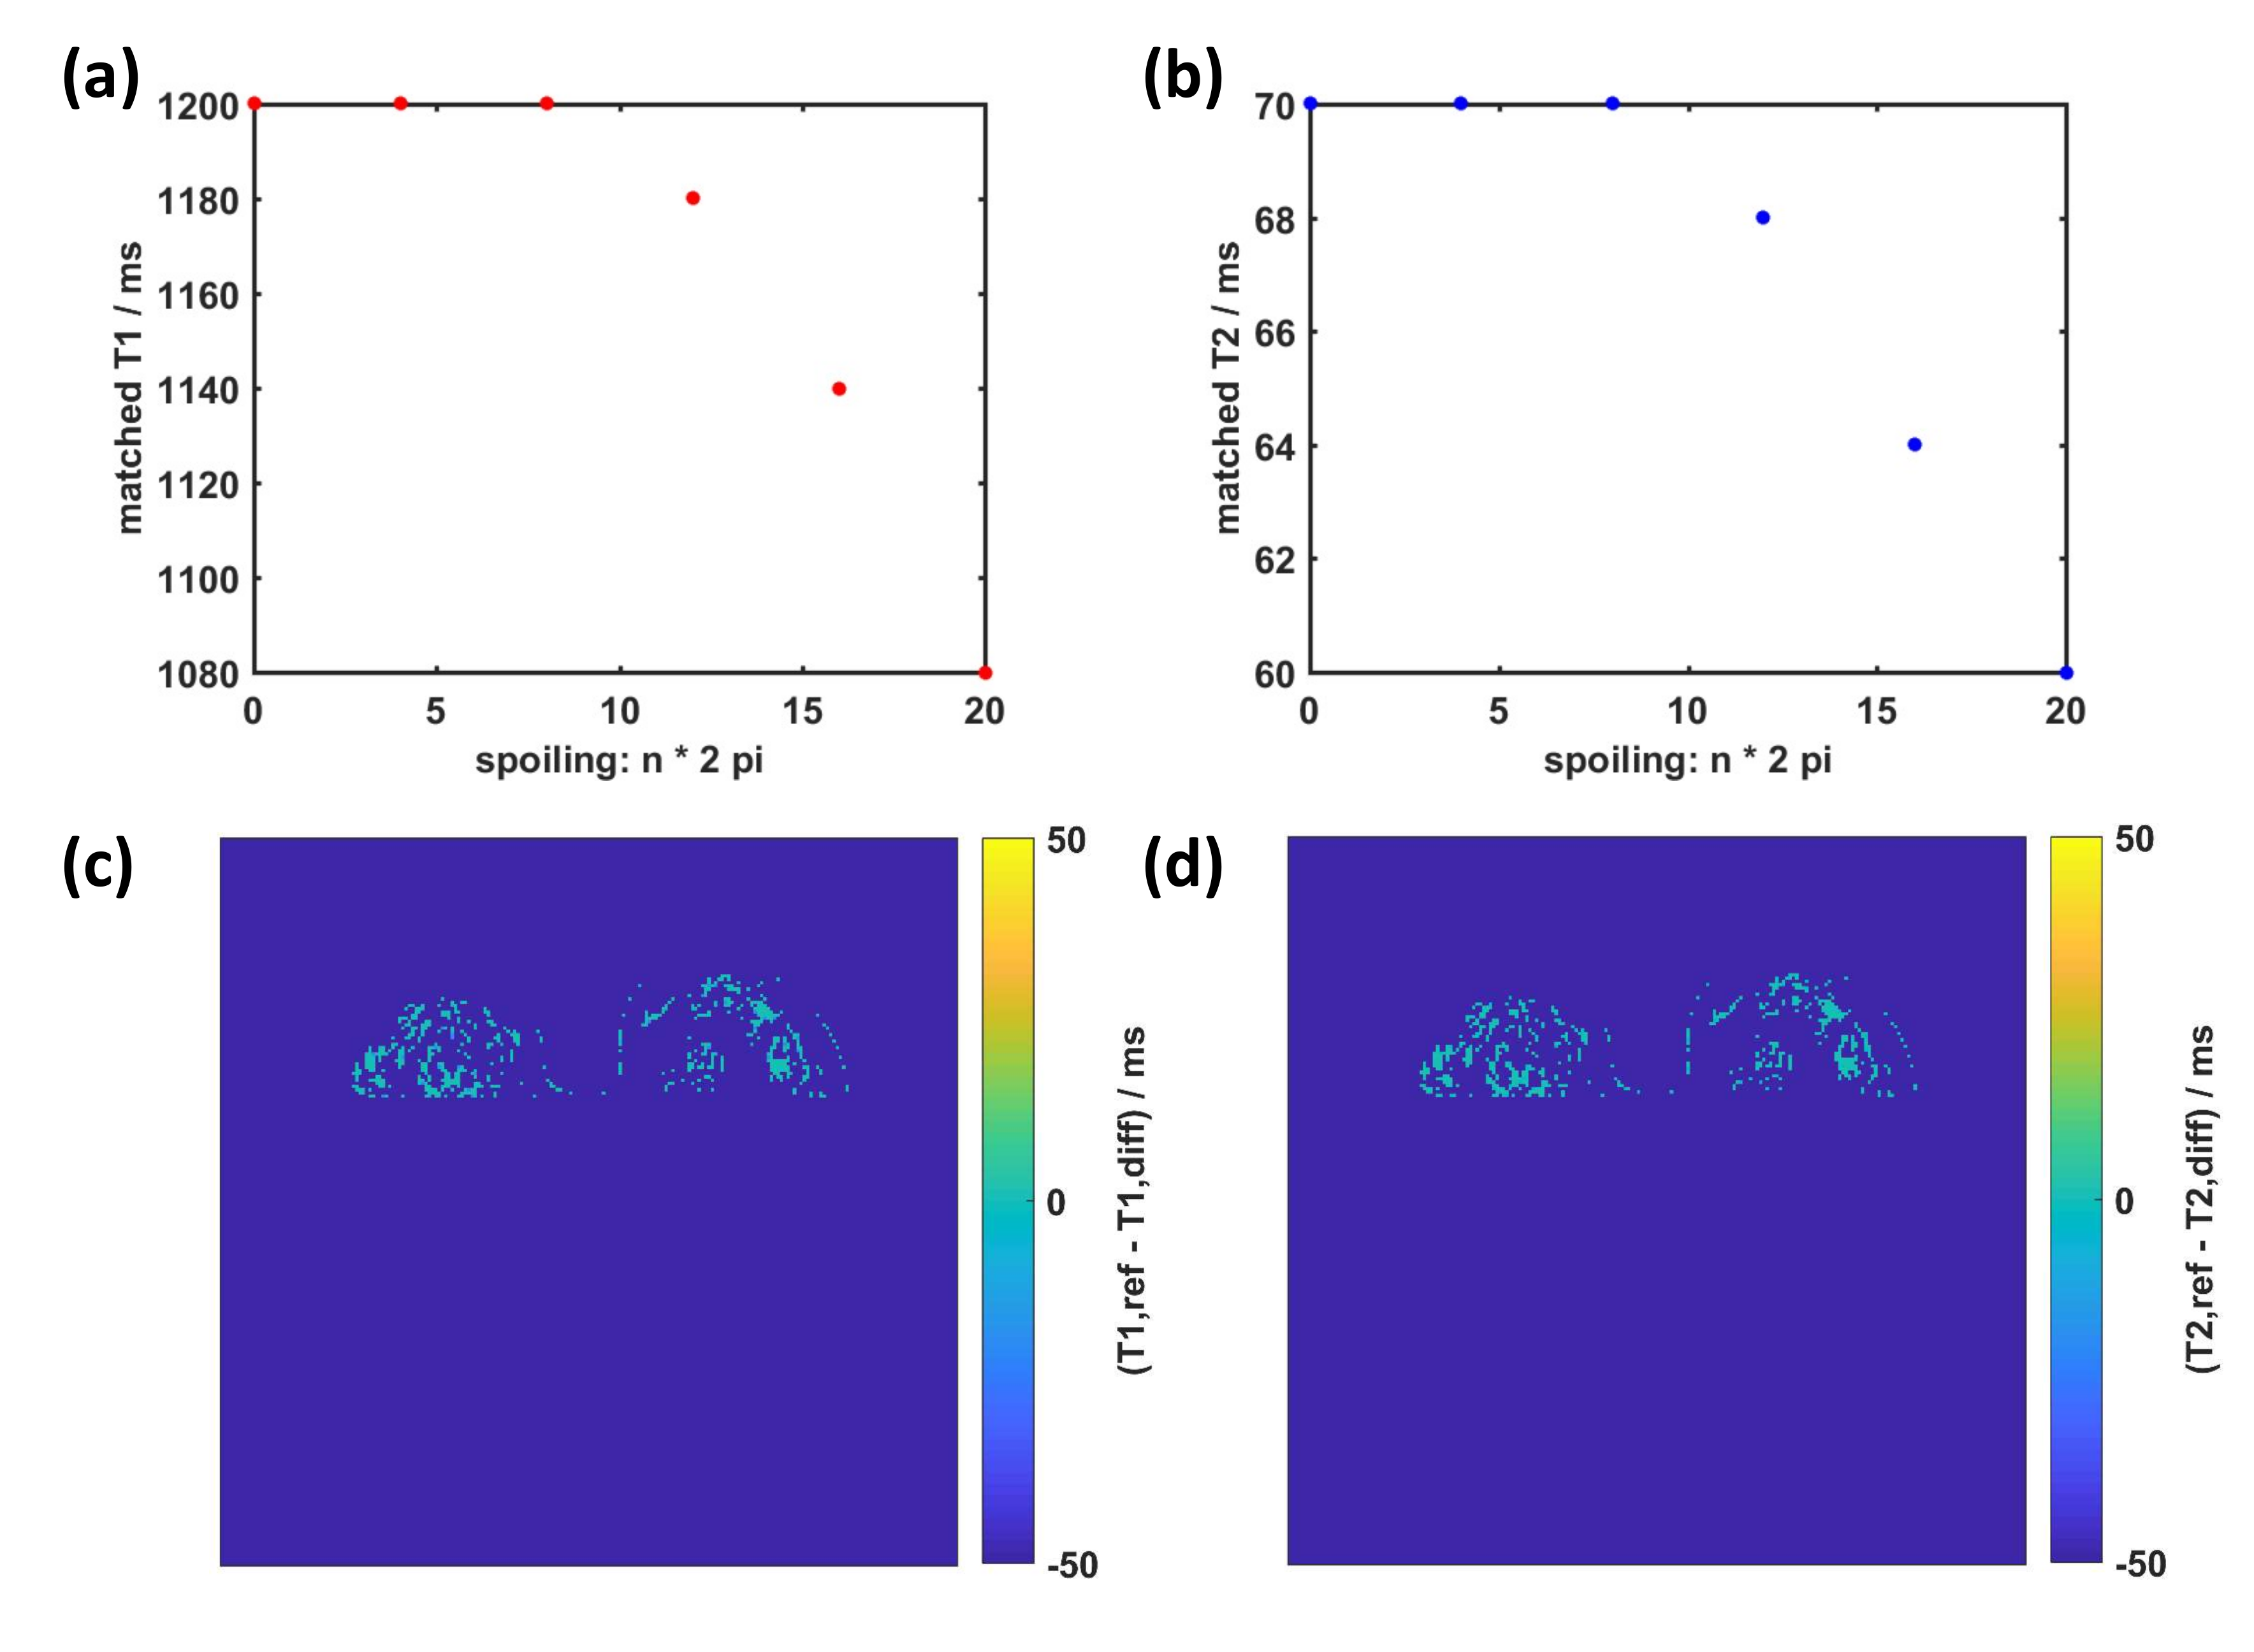
The simulated diffusion results in Figure 4(a)-(b) show for the test tissue that diffusion is expected to have an influence from spoiling strengths of 12·2π upwards. Accordingly, the difference maps in Figure 4(c)-(d) do not show any decrease in the matched relaxation times when including diffusion with 4·2π spoiling.
In conclusion, we showed that an error analysis is important to obtain accurate MRF measurement results. For the given MRF sequence, both slice profile as well as B1+ inhomogeneity correction affected the quantitative relaxation times in the female breast anatomy.
Acknowledgements
This project has received funding from the European Union’s Horizon 2020 research and innovation programme under the Marie Skłodowska-Curie grant agreement No 642445 and under grant agreement No 667211.References
1Jiang Y, et al., MR Fingerprinting Using Fast Imaging with Steady State Precession (FISP) with Spiral Readout. Magn Reson Med 2015; 74:1621–1631.
2Scheffler K. A Pictorial Description of Steady-States in Rapid Magnetic Resonance Imaging. Concepts Magn Reson 1999; 11(5):291–304.
3Hong T, Han D, Kim M, Kim D. RF slice profile effects in magnetic resonance fingerprinting. Magnetic Resonance Imaging 2017; 41:73–79.
4Ma D, Coppo S, Chen Y, et al. Slice Profile and B1 Corrections in 2D Magnetic Resonance Fingerprinting. Magn Res Med 2017; 78:1781–1789.
5Kobayashi Y, Terada Y. Diffusion-weighting Caused by Spoiler Gradients in the Fast Imaging with Steady-state Precession Sequence May Lead to Inaccurate T2 Measurements in MR Fingerprinting. Magn Reson Med Sci 2018. doi:10.2463/mrms.tn.2018-0027.
6Winkler SA, Rutt BK. Practical Methods for Improving B1+ Homogeneity in 3 Tesla Breast Imaging. J Magn Reson Imaging. 2015; 41(4): 992–999.
7Partridge S, Murthy RS, Ziadloo A, et al. Diffusion tensor magnetic resonance imaging of the normal breast. Magnetic Resonance Imaging 2010; 28:320–328.
8Nolte T, Gross-Weege N, Truhn D, et al. Undersampled Spiral Magnetic Resonance Fingerprinting with Water and Fat Blurring Correction. In: Proceedings of the Joint Annual Meeting of ISMRM/ESMRMB, Paris, France, 2018. (abstract 4215).
9Sommer K, Amthor T, Koken P, Meineke J, Doneva M. Determination of the Optimum Pattern Length of MRF Sequences. In: Proceedings of the 25th Annual Meeting of ISMRM, Honolulu, HI, 2017. (abstract 1491).
10Yarnykh, VL. Actual Flip-Angle Imaging in the Pulsed Steady State: A Method for Rapid Three-Dimensional Mapping of the Transmitted Radiofrequency Field. Magn Reson Med 2007;57:192–200.
11Pauly J, Le Roux P, Nishimura D, Macovski A. Parameter Relations for the Shinnar-Le Roux Selective Excitation Pulse Design Algorithm. IEEE Transactions on Medical Imaging. 1991; 10(1):53-65.
12Weigel M, et al. Extended phase graphs with anisotropic diffusion. Journal of Magnetic Resonance 205: 276–285 (2010).
13Lecture notes https://web.stanford.edu/class/rad229/Notes/B2-ExtendedPhaseGraphs.pdf, last access on 8th November 2017.
Figures