4380
DeepKidney: Deep segmentation of MR images for automated glomerular function quantification in heterogeneous pediatric patients1Department of Radiology, Department of Electrical Engineering, Stanford University, Palo Alto, CA, United States
Synopsis
Automated segmentation of kidneys and their sub-components is a challenging problem, particularly in pediatric patients and in the presence of a pathology or some anatomical deformation. We present a segmentation framework using a multimodal U-Net that allows for the automated segmentation of the multiple kidney components as well as a functional evaluation of the glomerular filtration rate. Results achieve an average Dice similarity coefficient of 0.912, 0.853, and 0.917 for kidney cortex, medulla, and collector system, respectively.
Introduction
Motivation. Glomerular filtration rate (GFR) is the biomarker of kidney function and critical for a variety of medical decisions [1]. GFR can be estimated by MRI, but requires segmentation of the kidney, and for some pharmacokinetic models, requires segmentation of different components of the kidney. This processing is often time-consuming, and made more challenging by motion, low SNR, and anatomic variability (heterogeneity) between cases, particularly in pediatrics. The main bottle-neck for GFR estimation by MRI is the need for the manual kidney segmentation, that aside from being an expensive and tedious task, it is also subject to inter- and intra-reader variability. In recent years, deep learning-based algorithms for segmentation have shown to have potential for the production of automated, robust, and accurate results in unseen cases [2,3].
Objective. In this project, we developed a deep-learning-based multi-compartment kidney segmentation method (U-Net) for normal and pathological pediatric cases that automatically segments the kidneys and subsequently predicts the functional GFR maps.
Methods
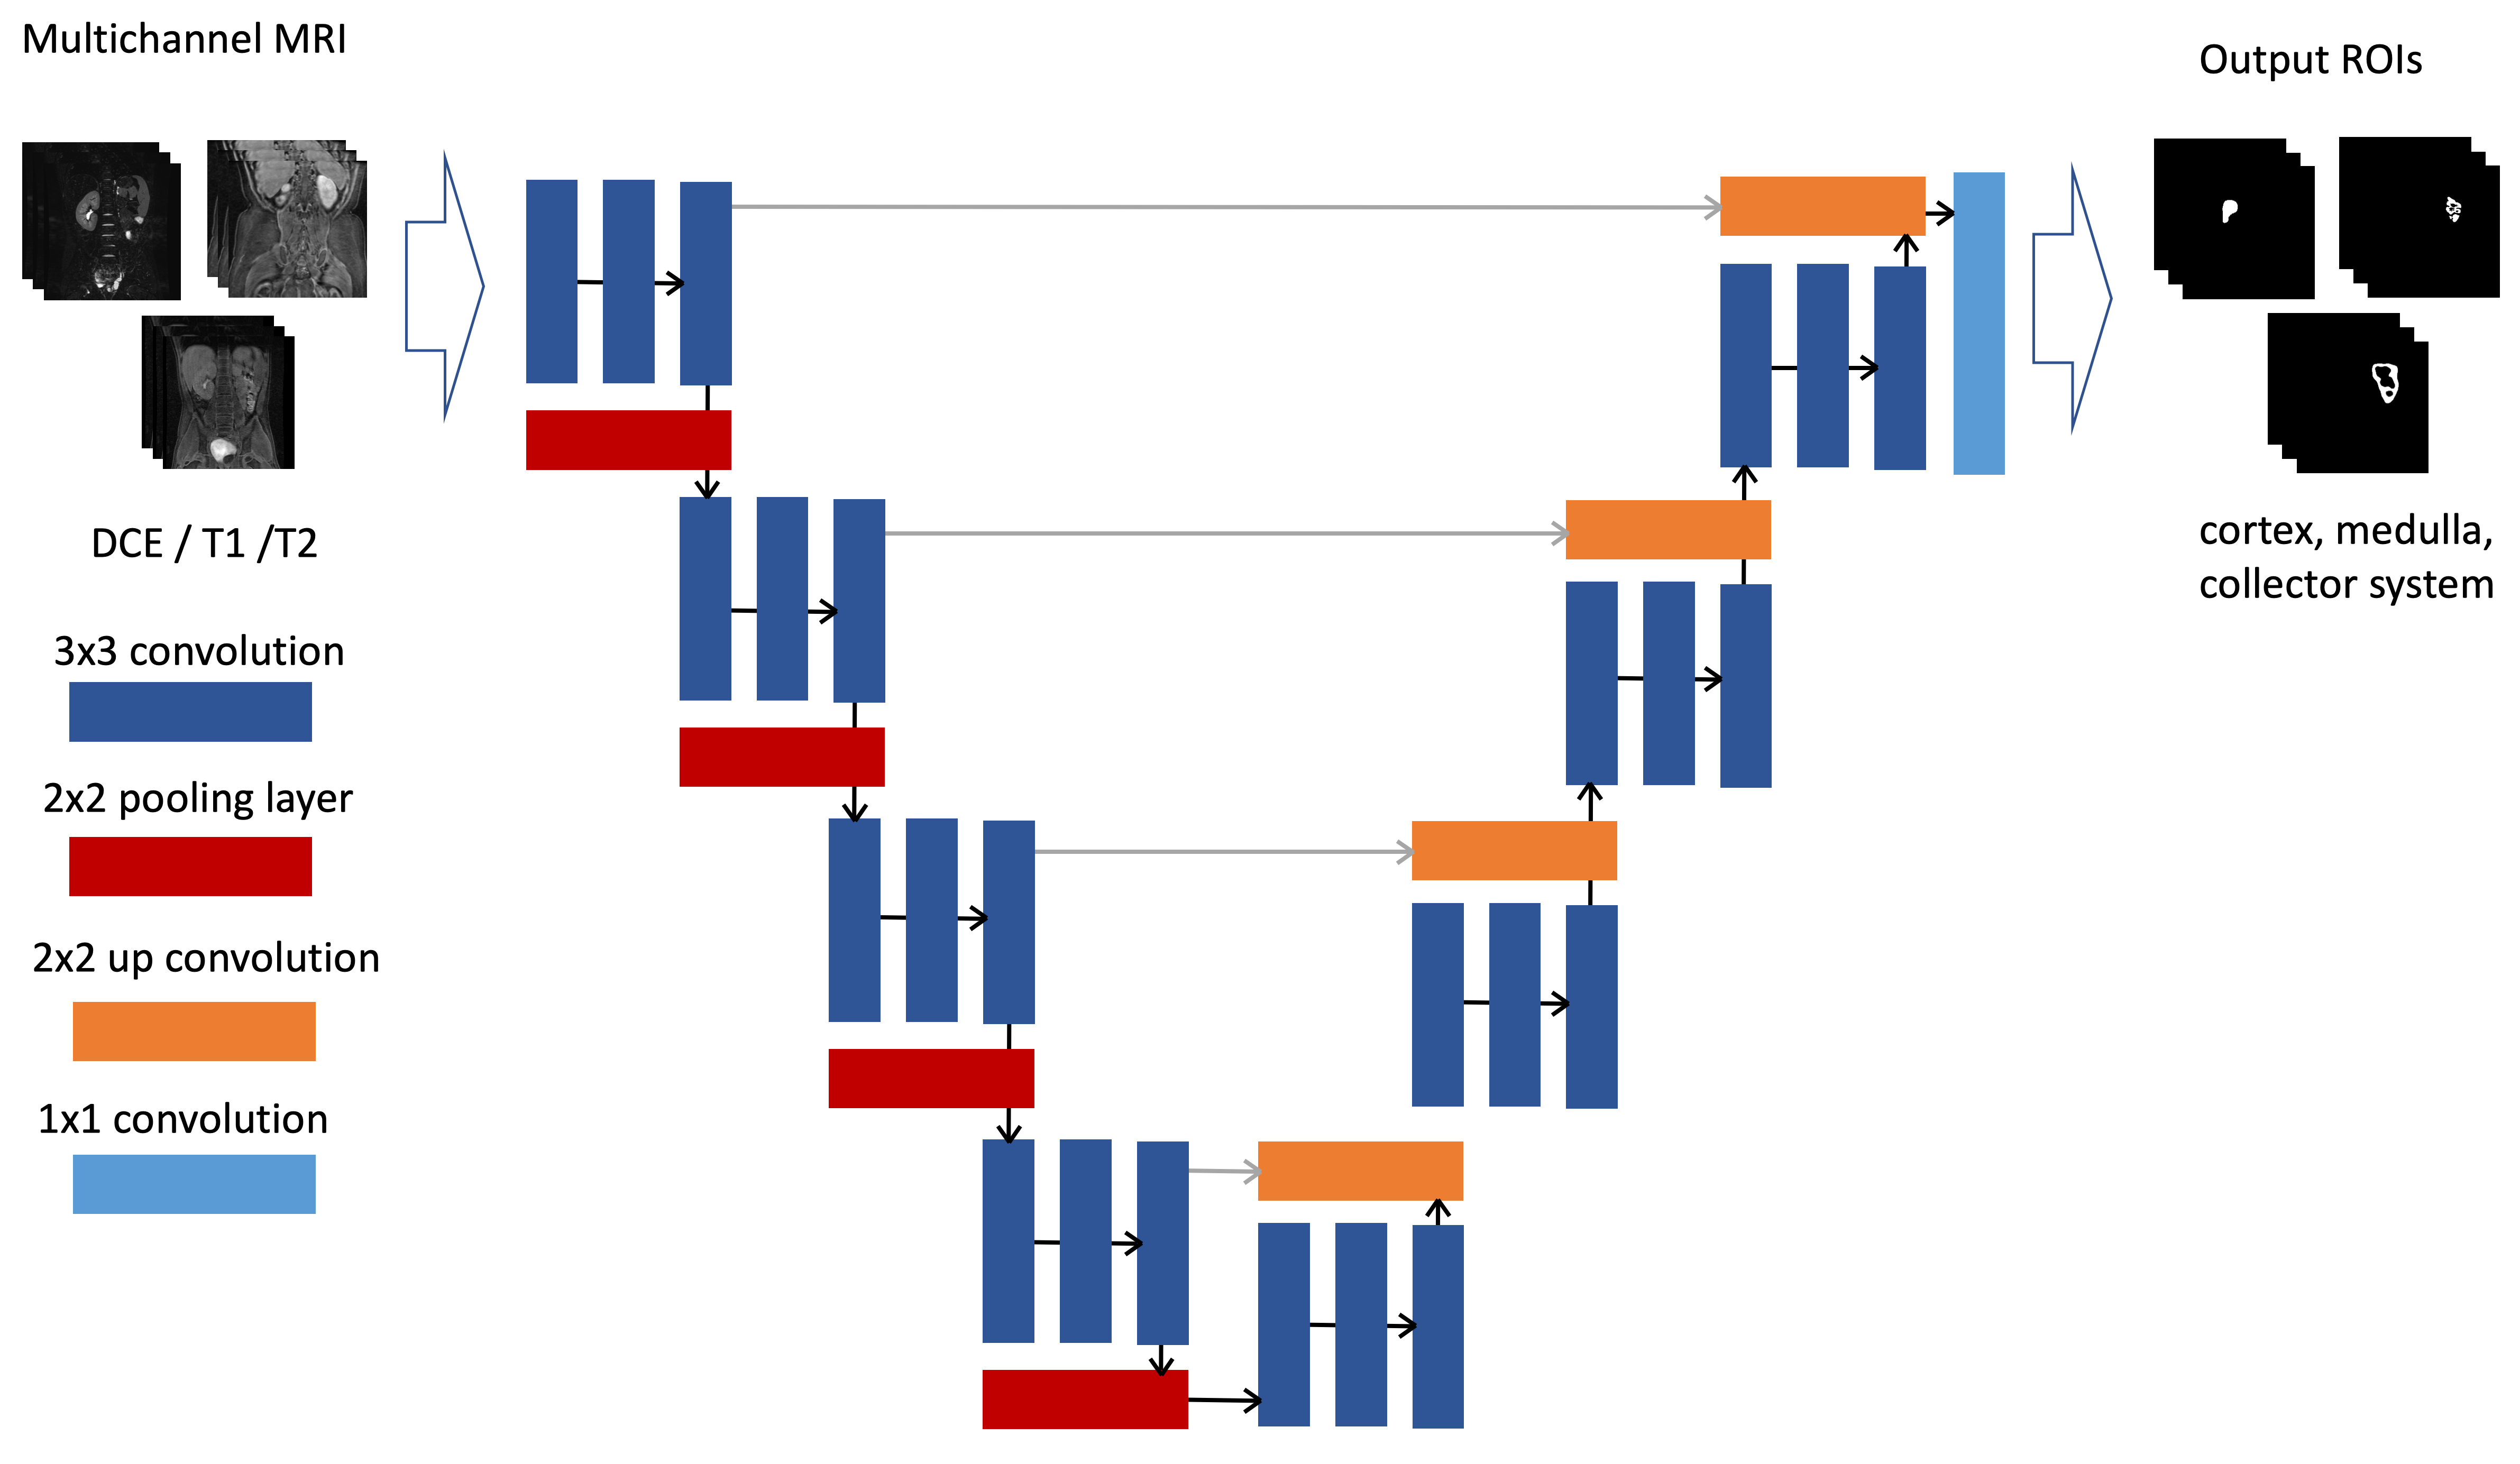
The proposed multi-contrast framework (Figure 1) includes a multi-channel U-Net-based architecture [4] that takes an input dynamic contrast enhancement scan (DCE, 50 phases), pre-contrast T1-weighted images, and T2-weighted images that predicts segmentation maps for the different kidney components (cortex, medulla, collector systems) and functional kidney status (GFR calculation). Imaging was performed using a multiphase 3D modified SPGR sequence with motion navigation, intermittent spectrally selective fat-inversion pulses, and VDRad sampling patterns were used during the contrast injection. Minimum echo time (TE) 1.2–1.6 msec, repetition time (TR) 3.0–3.7 msec, flip angle 15 degrees bandwidth (BW) 100 kHz, slice thickness 0.9–1.2 mm, FOV 20–44 cm, spatial resolution 0.8 x.8–1.4 x 1.4 mm^2, and a total acceleration factor of 7.8–8.0.
Datasets. The input dataset was collected with IRB approval and consists of 40 high-resolution multi-contrast pediatric input cases I(xi,yi) (i.e., DCE, pre-contrast T1, and T2) from which 30 were used for training, 5 for validation and 5 for test. Several of these cases included abnormalities (e.g., hydronephrosis, congenital kidney anomalies) that introduce heterogeneity to our dataset. Manually delineated regions of interest (ROI) were generated for both kidneys by an expert technologist, with subsequent radiologist editing, to train and assess system performance.
Network architecture and training. The network consists of three 3x3 convolution layers on the contracting path and a ReLU and max pooling layers (stride 2) at the end of each block. The upstream network presents a similar configuration with 2x2 up-convolution step and 3x3 convolution layers. The final layer at the end of the up-stream side is a 1x1 fully connected layer to produce pixel-wise scores for the ROIs of size (xi,yi) for an N number of slices that matches the input image volumes. An illustration of the network is shown on Figure 1. Pre-processing steps included registration of the input images as well as standard data augmentation techniques to increase the training sample and make the model more robust. Additionally, this framework automatically calculates the GFR and generates functional maps (Figure 3). Training was performed independently for each kidney (left, right) and its respective components, using multi-contrast inputs for each run (multi-phase DCE, T1, T2). We employed a cross-entropy loss function and the Adam optimizer using Keras with Tensorflow on an NVIDIA Titan X GPU with images of size 256x256 pixels using patches of size 48, 24, 12 and 6 on both down- and up-streams for 100 epochs.
Results
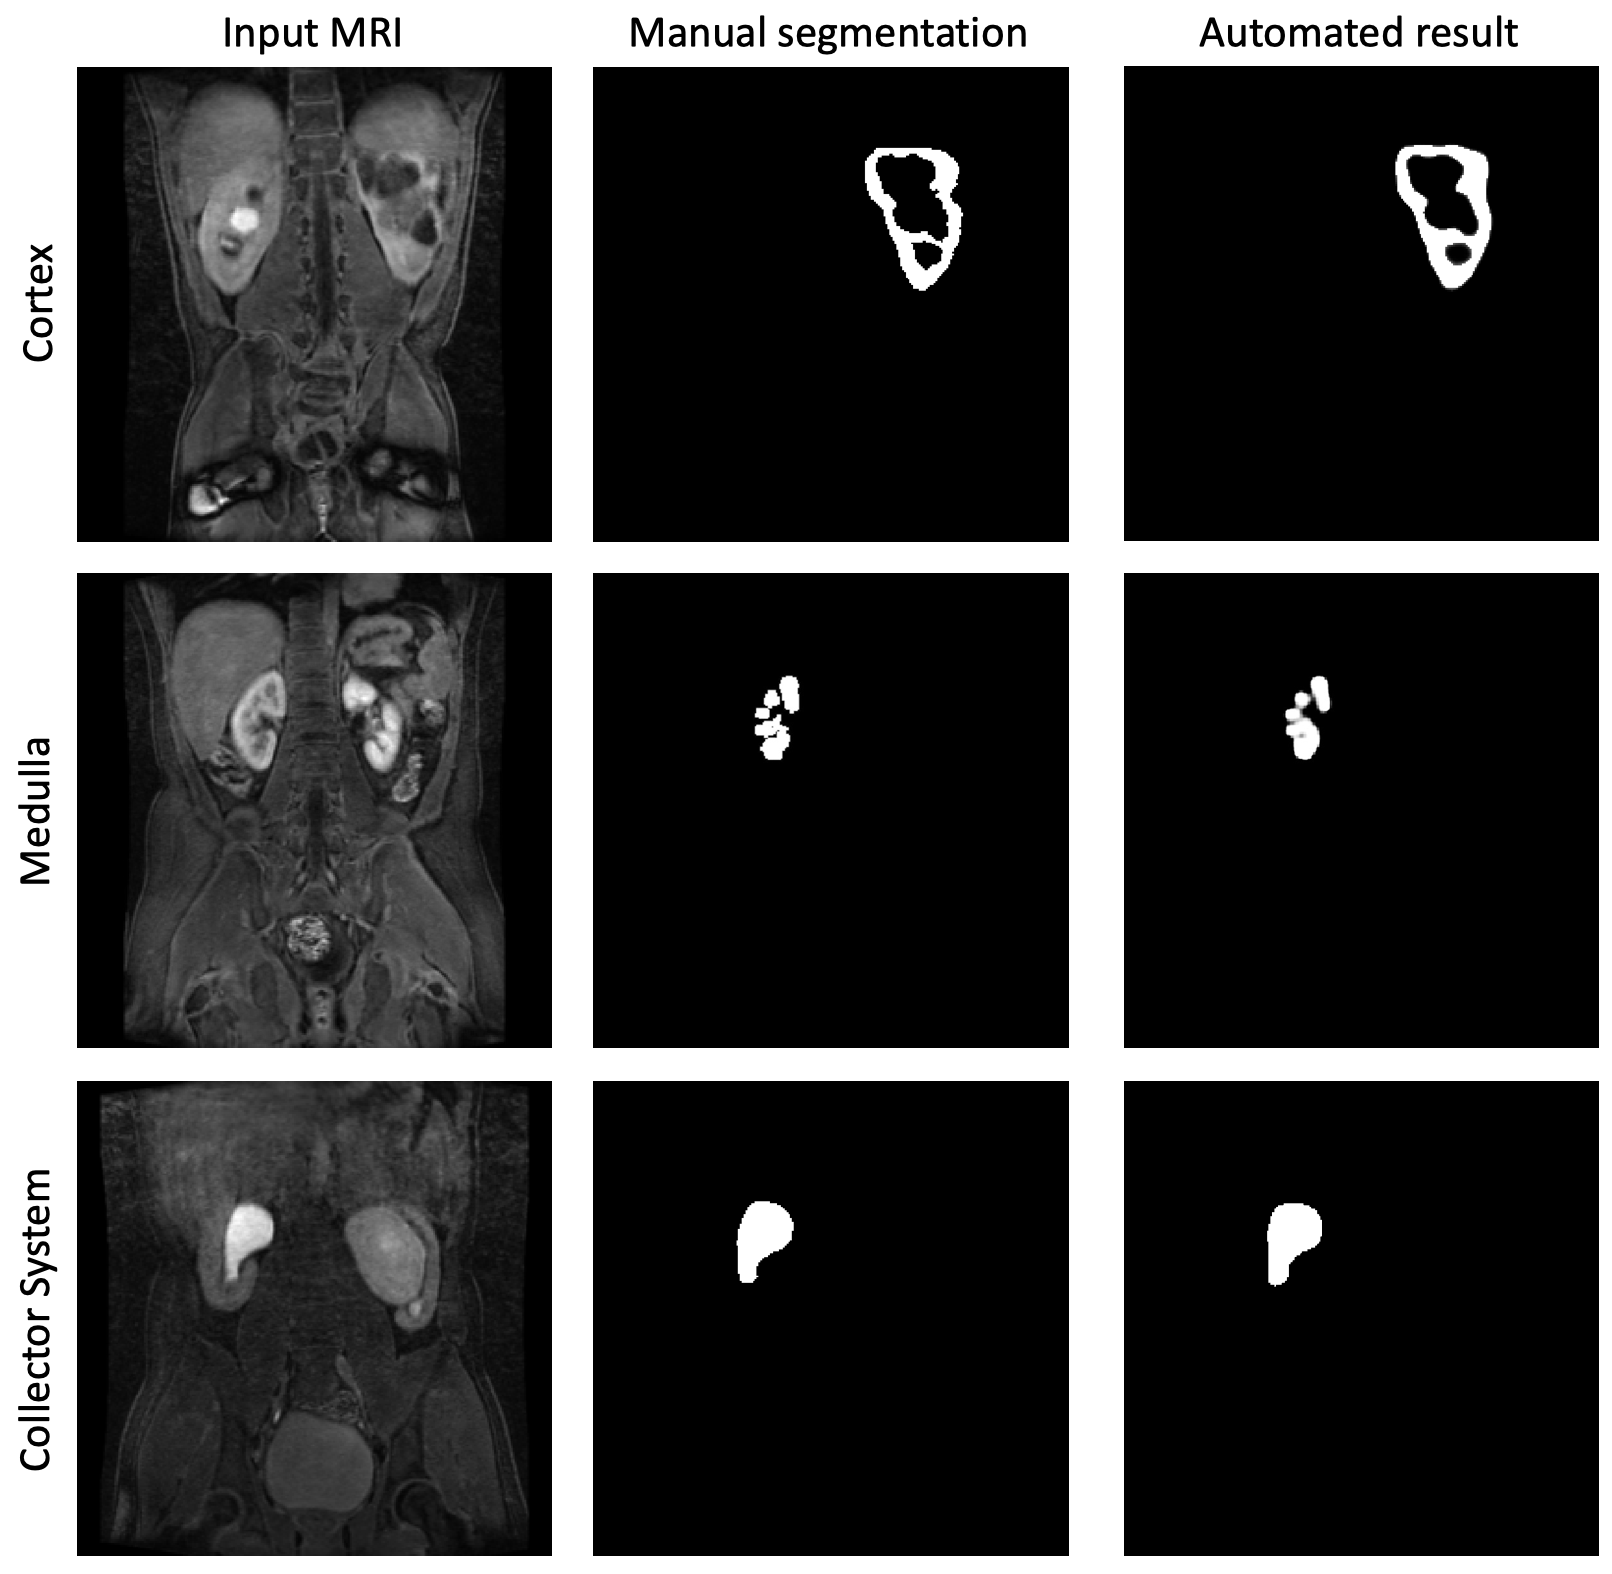
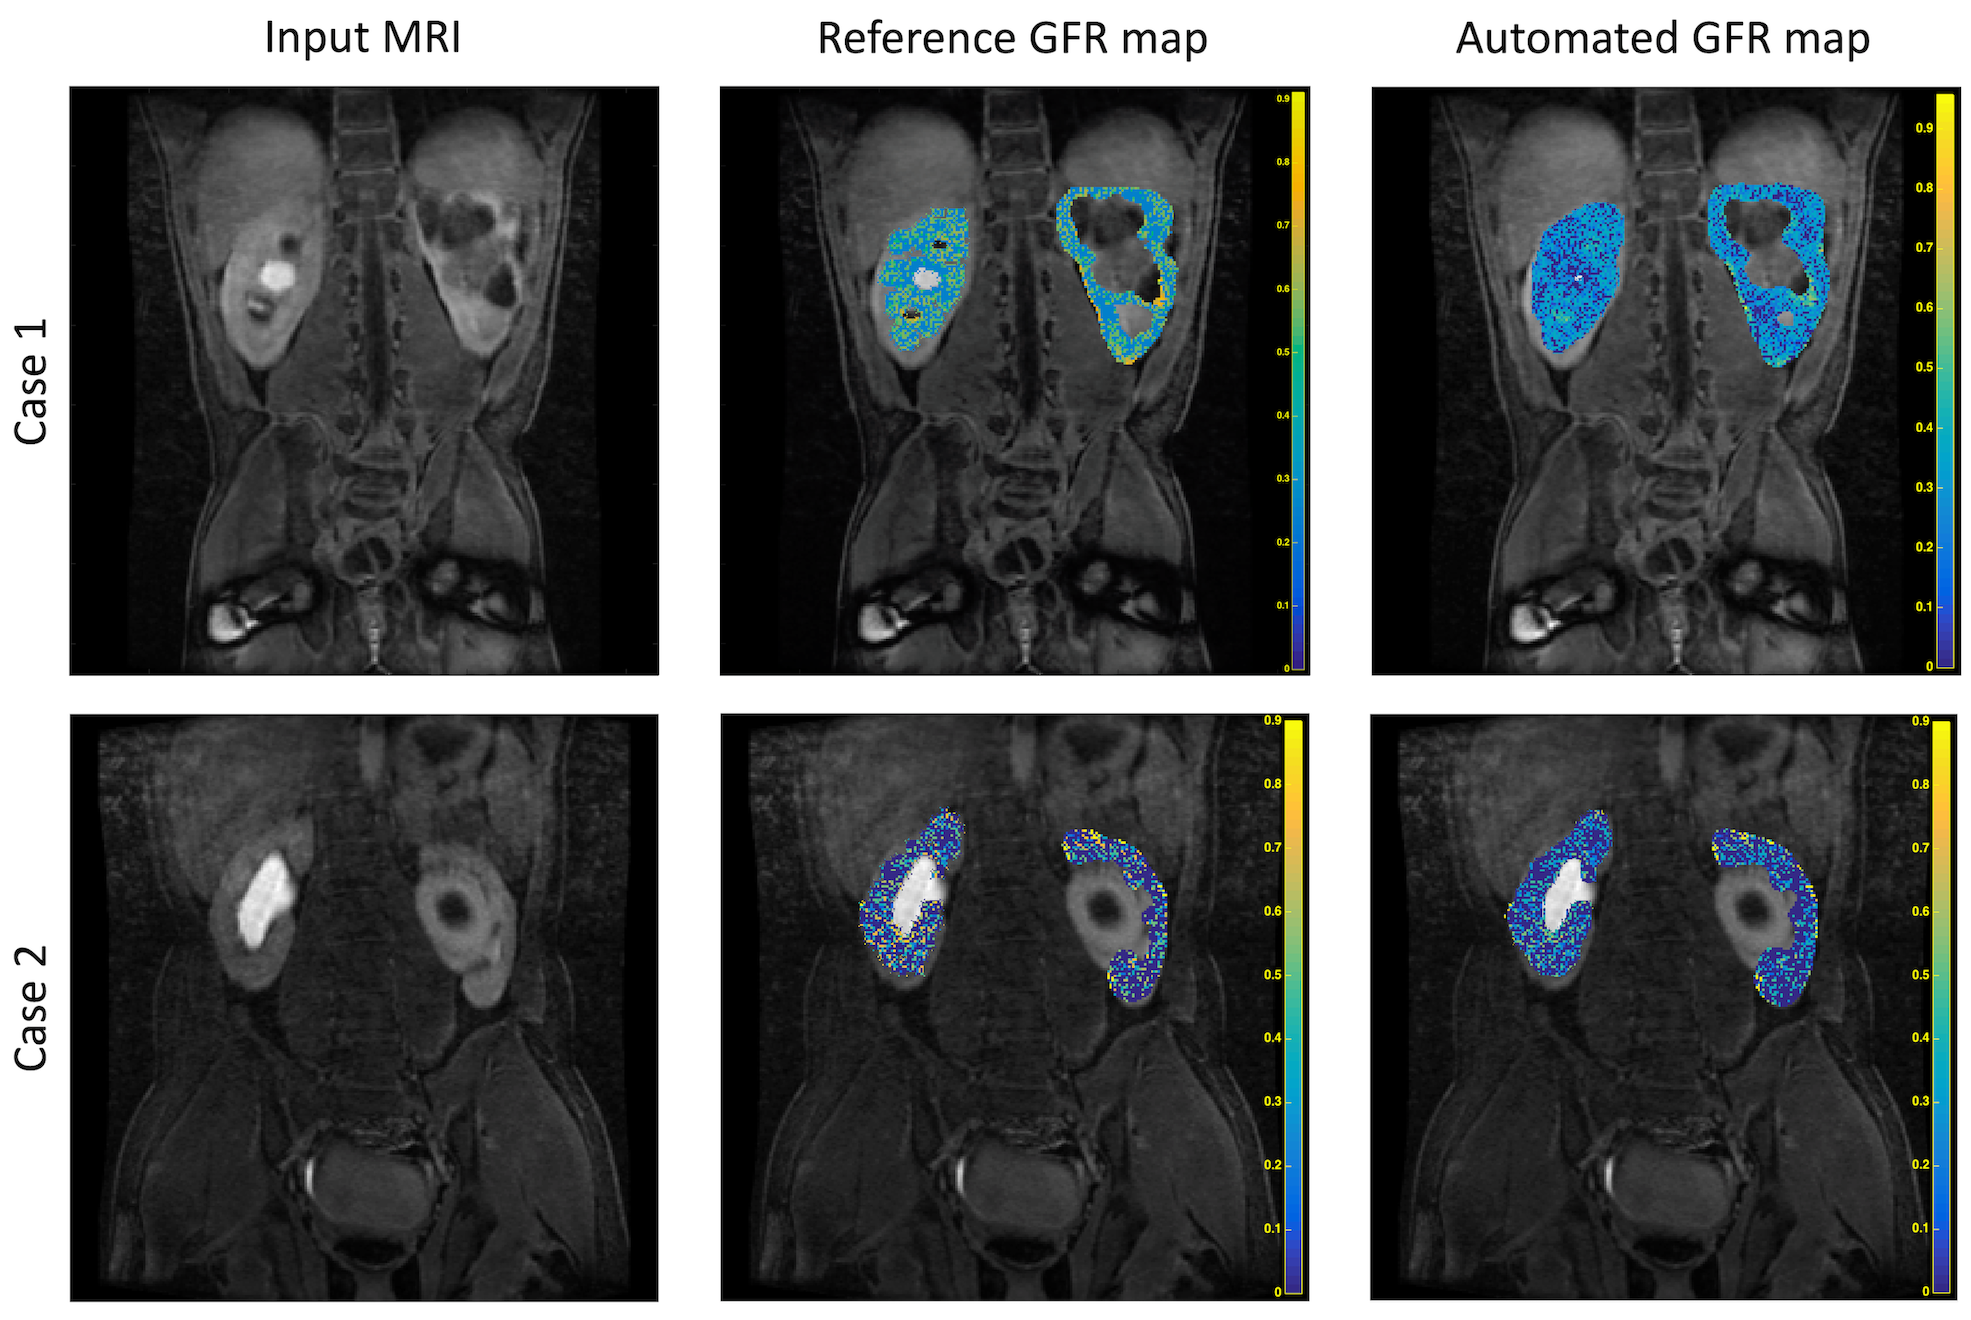
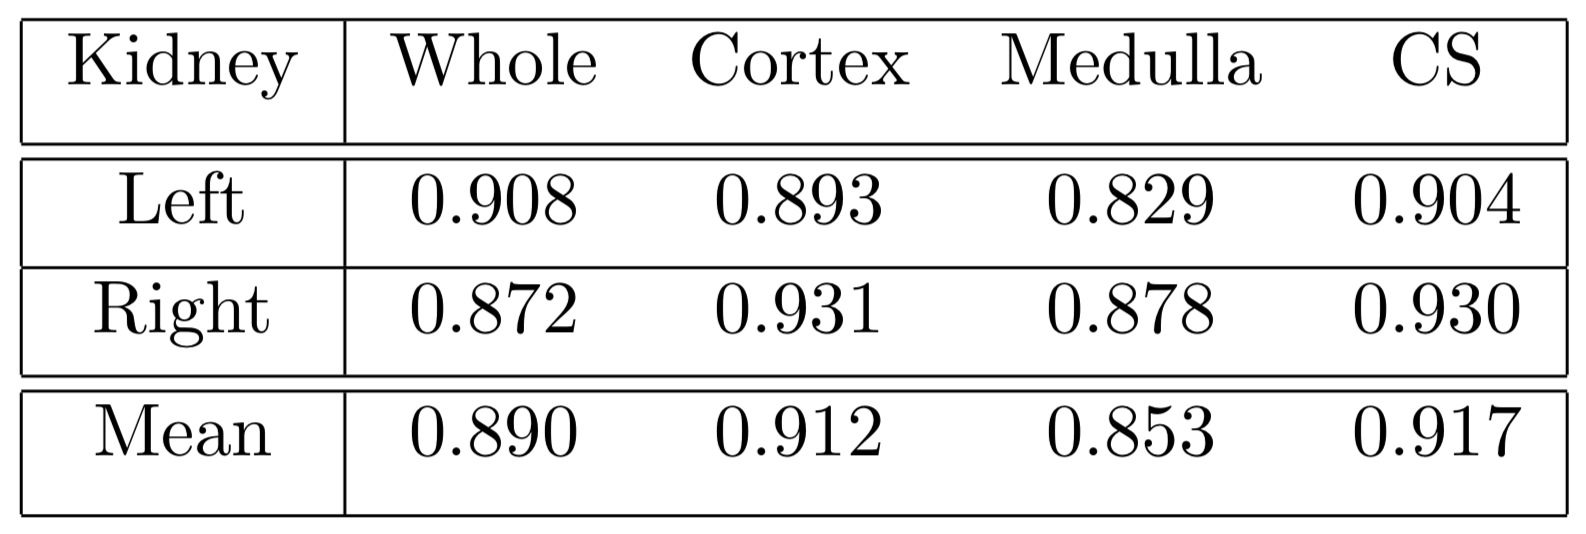
The framework was evaluated using a five-fold cross validation, and achieved a mean Dice coefficient of 0.912 for the kidney cortex, 0.853 for medulla and 0.917 for the collector system (Figure 2, Table 1). Additionally, from these automated segmentations we calculated GFR using the Patlack-Rutland model [5], obtaining similar (93.7% similarity) GFR maps between both scenarios (Figure 3). The predicted total GFR was calculated to be 58.671 ml/min (compared to a 61.720 ml/min, difference of 5.1%) for left kidneys and 55.871 ml/min (compared to 51.947 ml/min, difference of 7.5%).Discussion and Conclusion
We demonstrate a deep learning approach to obtain accurate segmentation on heterogeneous medical data (low SNR, anatomic variability, motion). In this project, we developed a framework that is able to accurately segment the different kidney components and produce an estimate of functional status on pediatric cases. The results are better than other previously reported methods for kidney segmentation (no sub-component or functional evaluation) [2]. Ongoing work includes expanding the network to robustly process severe deformities (hydronephrosis, resection cases, congenital disorders), evaluate alternative cost functions and parameters for different scenarios and optimize the training and evaluation of these large image studies (higher spatial resolution, higher temporal resolution).
Acknowledgements
Acknowledgements: NIH R01EB009690, NIH R01EB026136, and GE Healthcare.References
1.- Yoruk, Umit, et al. "High temporal resolution dynamic MRI and arterial input function for assessment of GFR in pediatric subjects." Magnetic resonance in medicine 75.3 (2016): 1301-1311
2.- Çiçek, Özgün, et al. "3D U-Net: learning dense volumetric segmentation from sparse annotation." International Conference on Medical Image Computing and Computer-Assisted Intervention. Springer, Cham, 2016.
3.- Piedra, Edgar A. Rios, et al. "Brain Tumor Segmentation by Variability Characterization of Tumor Boundaries." International Workshop on Brainlesion: Glioma, Multiple Sclerosis, Stroke and Traumatic Brain Injuries. Springer, Cham, 2016.
4.- Ronneberger, Olaf, Philipp Fischer, and Thomas Brox. "U-net: Convolutional networks for biomedical image segmentation." International Conference on Medical image computing and computer-assisted intervention. Springer, Cham, 2015.
5.- Hackstein, Nils, Jan Heckrodt, and Wigbert S. Rau. "Measurement of single‐kidney glomerular filtration rate using a contrast‐enhanced dynamic gradient‐echo sequence and the Rutland‐Patlak plot technique." Journal of Magnetic Resonance Imaging: An Official Journal of the International Society for Magnetic Resonance in Medicine 18.6 (2003): 714-725.
Figures